


Services on Demand
Article
 English (pdf)
 Article in xml format
 Article references
Indicators

Related links
-
 Cited by Google
 -
 Similars in Google
Share

 Permalink
South African Journal of Higher Education
On-line version ISSN 1753-5913
S. Afr. J. High. Educ. vol.34 n.3 Stellenbosch 2020
http://dx.doi.org/10.20853/34-3-3358
GENERAL ARTICLES
Improving distance learning mathematics modules in South Africa: a learning design perspective
L. E. GreylingI; B. HuntleyII; K. ReedyIII; J. RogatenIV
IDepartment Mathematical Sciences, University of South Africa (Science Campus). Florida, South Africa, e-mail: lgreylin@unisa.ac.za / https://orcid.org/0000-0002-8007-141X
IIDepartment Mathematical Sciences, University of South Africa (Science Campus). Florida, South Africa, e-mail: dr.belindahuntley@gmail.com
IIILearning and Teaching Innovation, The Open University. United Kingdom, e-mail: Katharine.reedy@open.ac.uk
IVLearning and Teaching Innovation, The Open University. United Kingdom, e-mail: Jekaterina.Rogaten@open.ac.uk
ABSTRACT
In order to deliver high-quality learning and teaching, the Open University (OU) has adopted an approach to developing its curriculum called OU Learning Design, which supports a consistent and structured design, specification and review process. It provides a simple set of tools and resources to assist teams in choosing and integrating an effective range of media and technologies, defining their pedagogic approach, and sharing good practice across the institution (Subotzky and Prinsloo 2011).
The objective of this study was to apply OU Learning Design tools in the context of the largest distance education university in Africa (Unisa) to identify areas that could be changed in order to improve student outcomes and retention. Two Unisa first-level mathematics modules were evaluated and mapped using OU Learning Design approaches and tools to identify areas for improvement. Qualitative and quantitative data on students' educational experience in these modules and longitudinal academic progress data were used to better understand the challenges students are facing on those courses.
The process uncovered areas where improvements need to be made and among the core recommendations were improvement of workload distribution across both modules, the timing of the examination period, and a greater variety of learning activities. These reflections will be used to inform the next "Plan" stage of the Action Research spiral.
Keywords: distance education, learning design, grades, dropout, mathematics
INTRODUCTION
The University of South Africa (Unisa) is the leading open distance education institution in Africa and has more than 400 000 students enrolled in a variety of courses. The main aim of open distance education is to be a vehicle for achieving sustainable development - particularly equitable access to high-quality education for all - that addresses the skills requirements of the labour market. For students who face socio-economic and demographic disadvantages (e.g., gender, race, disability, later learners and learners with caring responsibilities), distance education (DE) offers access to higher education. Additionally, the SDGs also promise high-quality education, but this requires capacity building to assess what works and how to fine-tune teaching to meet student needs.
This article presents and discusses a research collaboration work between the Open University UK (OU) and Unisa, as part of the IDEAS1 project. The current study explores the design of the educational programmes that are currently taught in the science, technology and engineering faculty (CSET) at Unisa. The overall aim of this research is to identify which elements of module learning designs impact on student engagement in the learning process and could be changed in order to improve outcomes and retention. The main goal of this research is to answer the following questions:
1) How can evaluation of learning design be used to identify areas that could be changed in order to improve student outcomes and retention?
2) To what extent are the OU Learning Design approaches applicable in the Unisa context?
LEARNING DESIGN
Learning design (LD) is a field of educational research and scholarship that focuses on the designing, describing and sharing of learning activities to support educators' design practices. It is about designing for student engagement with learning tools, materials and communities. Conole (2013, 121) describes learning design as "a methodology for enabling teachers/designers to make more informed decisions in how they go about designing learning activities and interventions, which is pedagogically informed and makes effective use of appropriate resources and technologies".
As practised at the Open University (OU) UK, LD has two key purposes: (1) to support and enable module or qualification design; and (2) to enhance quality by evaluating designs for their effectiveness in delivering intended learning outcomes. LD at the OU is characterised by three principles: (1) it contains mechanisms to encourage design conversations across disciplines and expert roles; (2) it makes use of tools and instruments as a means of describing and sharing designs; and (3) it incorporates the strategic use of information and data to inform and guide the decision-making process. The OU LD approach puts the student at the heart of the design process - it focuses on the student journey and the process of learning in a distance-learning context. Thus, in order to deliver high-quality teaching and learning, the OU LD approach promotes a consistent and structured design, specification and review process. It offers a simple set of resources and tools that supports an approach based on student activity.
In all, LD provides a holistic overview of students' learning, of which student engagement is an essential part. Student engagement is a contested term that is sometimes conflated with satisfaction and often measured in terms of successful outcomes (achievement and retention) for which metrics are readily available. MacFarlane and Tomlinson (2017, 9) suggest that student engagement "may be understood as based mainly on behavioural expectations that relate to students adopting a positive attitude towards learning actively and more broadly contributing to the life of the institution leading to higher levels of individual achievement and degree completion. It also strongly implies that teaching strategies need to use active and experiential approaches in order to achieve enhanced student engagement."
In this article and for the purpose of this study, student engagement is regarded as a process and relationship in which all involved (students, academics and professional services staff) actively work in partnership (Healey, Flint and Harrington 2014). This aligns with the view proposed by Newswander and Borrego (2009, cited in Macfarlane and Tomlinson 2017, 1-2) that student engagement "implies a learning environment where participants, drawn from diverse backgrounds, are actively engaged in a participatory culture and experience an adequately resourced and interactive approach to teaching".
Learning design processes and tools
LD focuses on the process of learning and the student journey, that is, what the student does to learn. At the start of the design process, a number of aspects should be agreed, such as what the pedagogic intent of the module or piece of learning will be. The intentions should be referred to throughout the design process to ensure that the design fulfils initial aspirations and meets the needs of students.
The LD tools assist in choosing and integrating an effective range of media and technologies, defining pedagogic approach, and sharing good practices across the university (Subotzky and Prinsloo 2011). The aforementioned tools include the visualisation of designs using tools such as the OU learning design tool, module map and activity profile, and a range of creative workshop resources and activities to support design and reflection in workshops.
The activity planner provides a framework or taxonomy for categorising the different types of activities that students use to learn. The learning design activities are presented in Table 1.
In addition to information about the overall balance of activity types across a module, more detailed data on student workload can be captured and visualised using the workload part of the online tool (detailed presentations are included in the results section.) The OU definition states: "Module-directed workload includes resources and activities for which structured guidance is provided and with which all students are expected to engage in order to complete and pass the module" (Open University UK 2017, 4). In other words, it is everything that the module materials explicitly direct students to do to meet intended learning outcomes. Module-directed workload would include reading the module guide, reading and making notes using set books and other non-optional resources provided by the module team, engaging with core study materials on the Virtual Learning Environment (VLE), including watching provided videos and listening to provided audio clips, and completing non-optional activities on the VLE, on the web, at work or embedded in set study texts, including non-optional research activities.
Workload is mapped using the OU LD tool, which allows both the quantity of assimilative content (e.g. reading the prescribed book and module guide) and the amount of time that students are directed to spend on other types of activity, such as note-taking or assessment, to be recorded. Video and audio content which provides an alternative to text is classed as assimilative. When mapping workload and entering details into the online tool, agreed conventions are used that have been derived from the OU Learning Design Initiative research.
The following study speeds are used at OU UK:
• 20 words per minute (wpm) for extremely challenging texts (e.g. mathematical equation-rich texts or for complex musical scores)
• 35 wpm for challenging and concept-dense texts
• 70 wpm for medium texts
• 120 wpm for easy texts
• 200 wpm for scanning texts (e.g. reading novels or skim reading other materials)
These speeds can be adjusted according to discipline, type of material and level of student. In addition, norms associated with other materials, for example video, audio, equations and figures (simple and complex), are used to calculate how long it is likely to take students to study them.
Review of learning design research
The OU's learning design approach, developed through the OU Learning Design Initiative (OULDI) project, has been extensively tested in a variety of research studies and shown to have a positive impact on students' learning. The OULDI project ran from 2007 to 2014 (with national funding from Jisc2 from 2008 to 2012) and focused on developing resources and approaches, and testing tools, that supported institutional curriculum design processes and design practices or cultures.
Outputs included tools for sharing learning design expertise, for example the Cloudworks site: http://cloudworks.open.ac.uk; visualisation of designs using tools such as Compendium LD, the module map and activity profile; and a range of creative workshop resources and activities to support design and reflection in workshops. Nine pilots were run across six UK universities, resulting in a set of key findings and lessons learned (Cross et al. 2012). In terms of impact on practices, it was found that "in learning to use the tools, approaches and resources of learning design, staff acquire new conceptual frames, deeper understandings of pedagogies and a richer language to describe their intentions, reasoning and practice" (Cross et al. 2012, 12). In 2012, the learning design tools and approaches started to be embedded into business as usual at the Open University UK, with mandatory adoption of LD into the curriculum design process from March 2014.
Since 2014, there has been rapid progress in bringing insights from the OULDI project together with learning analytics research at the OU' s Institute of Educational Technology (IET), to achieve practical benefits for the design, delivery and review of OU modules. By analysing large and fine-grained datasets containing evidence of how students are engaging in practice, OU researchers have gained new understandings of how to design modules engage and retain learners across the diverse OU student population. This is evidenced through a number of empirical studies testing the link between learning design and learning analytics at the OU, and summarised in an overview of over ten years of research in allying learning design with learning analytics at the Open University UK (Rienties et al. 2017).
In the first large-scale empirical study, Rienties, Toetenel and Bryan (2015) used K-means cluster analysis on 87 modules to identify four common patterns that OU teachers follow when developing distance learning modules. These are: Cluster 1, constructivist (strong emphasis on assimilative activities such as reading, watching and listening); Cluster 2, assessment-driven (fair amount of time allocated to assessment and limited focus on assimilative, communication and interactive activities); Cluster 3, balanced-variety (relatively more balanced design between seven types of learning activities with a relatively high focus on experiential activities); and Cluster 4, social-constructivist (uses a more learner-centred design approach, with relatively more time allocated to communication, productive and interactive activities).
A subsequent study by Rienties and Toetenel (2016) found that learning design strongly influenced student behaviour, satisfaction and performance. They linked the design of 151 modules taught from 2012 to 2015 at the OU with the behaviour of 111 256 students. The data was analysed using multiple regression, and researchers found that learning designs strongly predicted VLE engagement and academic attainment of students. Findings indicated that one of the strongest predictors of students' retention was the relative amount of communication.
A third large-scale empirical OU study by Toetenel and Rienties (2016a) compared 157 learning designs at the OU. The results showed that on average students were anticipated to study for assessments 21.50 per cent of their learning time, although substantial variation (SD = 14.58%, range 0-78%) was found among these modules. Although a wide range of designs were present at the OU, in its majority they were highly focus on assessment and assimilative learning activities, with low use of student-active learning activities (e.g. finding information, communication, productive).
In follow up research of 148 learning designs by Toetenel and Rienties (2016b), it was found that when OU teachers were provided with the visualisations of their initial learning design activities, in comparison with teachers who were not provided with this information, they modified their designs towards more student-active learning activities, such as finding information and communication, while at the same time reducing the emphasis on the assimilative learning activities. Thus, by following a systematic approach to learning design (consisting of visualisation of initial LDs and workshops) teachers were able to develop more balanced designs that developed student skills.
In the last two years, more fine-grained weekly LD has been added (gained through detailed mapping of module content), making it possible to detect the optimum combination of LD activities per subject, study-level and type of student per week and over time. An empirical study by Nguyen et al. (2017) on the learning designs of 74 modules over 30 weeks, with an emphasis on computer-based assessment (CBA), showed that the workload on a week-by-week basis for other activities reduced when assessment activities were present. It also signified that assessment and communication activities significantly predicted student engagement in VLE activities. Overall, by controlling for heterogeneity within and between modules, 69 per cent of the variance in VLE behaviours could be explained through learning designs. In addition, although assessments were correlated with pass rates, they had no clear correlation with satisfaction.
A further empirical study by Nguyen, Rienties and Toetenel (2017) unpacked the complexity of learning design by using network analysis techniques to examine the interrelationships among various types of learning activities. Results showed that learning designs differ considerably across different subjects. This finding was supported in a follow-up study by Rienties, Lewis, McFarlane, Nguyen and Toetenel (2018), which used fine-grained data of four language studies modules and contrasted weekly learning design data of 2 111 learners. The results showed that the OULDI taxonomy required to be somewhat adjusted for the language context, because communication activities were labelled differently in this specific subject.
Consideration of workload is a significant aspect of the learning design research evidence, which suggests that excessive and uneven workload can have an impact on retention (Whitelock, Thorpe and Galley 2015). Workload mapping is a focus of the Unisa study described here.
The review of the literature about LD and evidence for the effectiveness of LD suggest that examining the LD of courses taught at Unisa is a strong starting point for addressing questions about quality and equitable access to the open distance education in South Africa. Since teaching and learning take place at a distance, mediated by module materials, the design of these materials plays a key role in how students learn. As such, looking at the LD of the sources at Unisa will help to address some aspects of quality and equitable access questions.
Since earlier studies had found that there are disciplinary and contextual differences in the ways that learning designs are viewed and labelled, the project team also evaluated the suitability of the OU learning design tools and approaches for use in an African ODL context (Mittelmeier et al. 2018) and sought feedback on what adjustments might be needed. An evaluation of two workshops held at Unisa in April 2018, with around 60 participants in total, showed that while large-scale changes to practice might not be envisaged, academic course designers felt that they would take a more systematic, structured and intentional approach to design or revision of their modules. Many participants also expressed enjoyment of the collaborative hands-on nature of the workshop activities and could see how these would be useful in their own setting.
The overall aim of the current study was to pinpoint areas where the design of the two Unisa Mathematics modules could be improved. The study sought to answer the following research questions:
• Can OU LD tools and approaches be used to identify areas that could be changed in order to improve student outcomes and retention?
• How far can the OU Learning Design approaches be applied in the Unisa context?
Due to time constraints, the study focuses on the design of learning materials and does not include student evaluations of their learning experience, although this was noted as a key source of data to consider in future.
METHOD
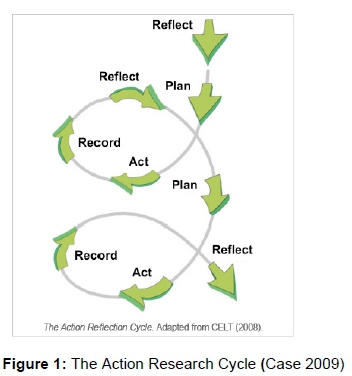
This study adopted an action research approach. Action research can be described as any research into practice undertaken by those involved in that practice, with an aim to change and improve it (Open University Centre for Outcomes Based Learning 2005). It is a process of enquiry by practitioners into the effectiveness of their own teaching and their students' learning. In the words of Norton (2009, xvi), "The fundamental purpose of action research is to systematically investigate one's own teaching/learning facilitation practice with the dual aim of modifying practice and contributing to theoretical knowledge". Thus, researchers are no longer detached observers; they are embedded in the research process as active participants who have a stake in the outcomes. Typically, action research is collaborative in nature and has three key elements: (1) systematic investigation into (one's own) teaching or learning facilitation practice; (2) modification or improvement of practice; and (3) contribution to theoretical knowledge (Norton 2009).
Having first identified the question or problem to be addressed, action research involves an iterative cycle, namely Plan - Act - Observe - Reflect (see Figure 1).
Study settings and modules overview
Unisa is an open distance learning (ODL) institution with a student population comprising diverse ethnic, cultural and language backgrounds. The student profile includes South African and international students, ranging from students straight out of school to mature students embarking on studies for the first time. Unisa provides opportunities for students to further their qualifications either part time or full time. In order to address the research questions in this study, two level 1 mathematics modules from the Science, Engineering and Technology (CSET) faculty were selected.
The two level 1 mathematics modules selected for this study were: Module 1 "Pre-Calculus A" and Module 2 "Mathematics 1 Engineering". These two core modules for the Education and Engineering qualifications attract high student numbers. In addition, Module 1 is a key module for Education students who are training to become mathematics teachers. Both Module 1 and Module 2 are blended modules that make use of a combination of online and printed study material.
The low pass rate in these modules has been a cause for concern. Failure in a core module prolongs students' time to complete a qualification and in the worst cases leads to total dropout from the university. The module leaders volunteered those modules to find ways to improve student engagement, communication, interactivity, assessment and performance (the "Reflect" phase of the Action Research cycle). As such, it was thought that LD as done at OU would provide a strong basis for recommending improvements ("Plan").
Module 1
Module 1 is an undergraduate year-long module at NQF level 5, with one study guide and a textbook. This module intends to develop basic algebraic skills, which can be applied in the natural and social sciences. The broad aims of this module are to provide students with an understanding of basic ideas of algebra and to teach them to apply the basic techniques to problems related to drawing and interpreting graphs of linear, absolute value, quadratic, exponential, logarithmic and trigonometric functions, and to solve related equations and inequalities, as well as simple real-life problems. The focus is on building strong algebraic and trigonometric skills that will support the development of analytical skills that are crucial for problem-solving in more advanced mathematics and related subjects.
The formative assessment component of Module 1 consists of five assessments throughout the year, contributing 20 per cent to the final pass mark. Assignment 01 is the compulsory assignment for admission to the examination. This assignment covers chapter 1 of the prescribed book, as well as the study guide. It is a multiple-choice assignment with five marks awarded for every correct answer and a calculator may not be used. The topics covered in Assignment 01 include real numbers, exponents and radical algebraic expressions, rational expressions, equations, graphs of equations, circles, lines, solving equations and inequalities. Assignment 02 is a written assignment based on chapter 2 of the prescribed book - functions. Assignment 03 is also a written assignment based on chapter 4 - exponential and logarithmic functions. Assignment 04 is a written assignment on chapter 5 - trigonometry. Assignment 05 is a multiple-choice assignment on more trigonometry. The remaining 80 per cent of the course score comes from the examination results. The three-hour examination covers all study material.
Module 2
Module 2 is a first-level semester-long module at NQF level 5, with two study guides and no textbook. This module is compulsory for all six of the National Diplomas in Engineering (i.e. electrical, civil chemical, mine, industrial and mechanical engineering). The broad aim of the module is to equip students with an understanding of the basic ideas of algebra and calculus, and to teach them to handle problems related to Cramer's rule to solve systems of linear equations, complex number systems, the binomial theorem, basic differentiation and integration. The focus is on building strong mathematical skills that will support the development of analytical skills that are crucial for problem-solving.
The formative assessment component of Module 2 consists of two assessments. Assignment 01 is weighted at 40 per cent and Assignment 02 is weighted at 60 per cent.
Together they contribute 20 per cent to the final pass mark. Both assessments are written assignments. Submission of one of the assignments gives admission to the examination. Assignment 01 is on study guide 1 and covered the following topics: the binomial theorem, determinants and Cramer's rule, partial fractions, complex numbers and the conic sections. Assignment 02 is on study guide 2 and covered basic differentiation and integration techniques and practical applications. The summative assessment is a two-hour examination covering both study guides. The examination contributes 80 per cent to the final pass mark.
Data sources and procedure
The ethical approval for this study was obtained from the Unisa Ethics Board as part of the IDEAS project ethics application. In order to answer this study's research questions, two different sources of data were gathered to provide insight into the student experience. This constituted the "Act" stage of the Action Research cycle.
Firstly, the learning designs of these modules were evaluated using OU LD approaches and tools. Student workload and the balance of activities were mapped using the OU's online learning design tool to code the amount of module-directed workload and the range of activity types that students were required to engage in.
Secondly, students' academic performance on this module from 2010 to 2016 was retrieved from the Unisa database and analysed to determine overall trends in the module pass rate. This data were compared to the 2017 data for both modules to see if the patterns were similar to previous years. In addition, detailed data on the summative and formative assessments of both modules in 2017 were retrieved and analysed to get a better understanding of students' progress in the module in relation to the learning designs of the respective modules.
The fundamental concerns of our research design were validity and relevance. Comparing two sources of data helped researchers to gain a better understanding of the complex relationship between module LD and students' learning and academic progression.
RESULTS AND DATA ANALYSIS
Module 1
Historic overview of pass rates
Students' academic performance data for Module 1 for years 2010 to 2016 were analysed to examine historical trends in students' progress. From 2010 to 2017, 2 990 students enrolled for Module 1. There were two examination periods in each year (January and October). Over the years, 920 students repeated the module mainly two to three times, but there was a number of students who attempted to pass this module five or six times. There was no noticeable difference between the numbers of local and international students who resat the examination. The demographic distribution of students in each year showed that there were no substantial differences in terms of their demographic backgrounds across cohorts. Thus, there were some small fluctuations in the percentage of students from any one particular background across years, but overall student composition remained relatively similar throughout the study period.
Students' attainment on the module was coded into three categories: (1) module failed; (2) absent/non-submission of assessment; and (3) module passed. The results of the historical progression trends for Module 1 are presented in Figure 2.
As can be seen from the Figure 2, the pass rates and therefore retention were consistently low over the years, which suggested that the causes did not just lie with individual students or particular cohorts. This was therefore an ideal opportunity to review learning design and consider what changes could be made in order to identify and remove potential bottlenecks in the programme and improve student learning and outcomes.
Learning design coding
The coding of the learning design was complex, involving a number of stages to achieve a reliable outcome. Firstly, an LD specialist from the OU worked with the module lecturers to create student profiles. These profiles took the form of personas of students who in the experience of the module leaders would study on the modules. Specific design challenges were identified, including:
• Student diversity: We cannot assume a common starting point.
• Language: The majority of students do not have English as their first language.
• Africanisation and decolonisation of mathematics subjects.
• Lack of contact between module lecturers and tutors.
• Lack of access to the internet (some students only have a cell phone; data are very expensive).
• Getting students to engage with online learning materials and not to focus solely on assessment.
• Student retention.
• Timings of assessment feedback so that students could act on it.
Secondly, the module leaders provided their estimate of how the balance of activities was distributed in the module. The self-report on the module design indicated that the module leaders intuitively judged the module to have high a percentage of assessments. Thirdly, detailed mapping of the module was carried out, focusing on the module-directed workload.
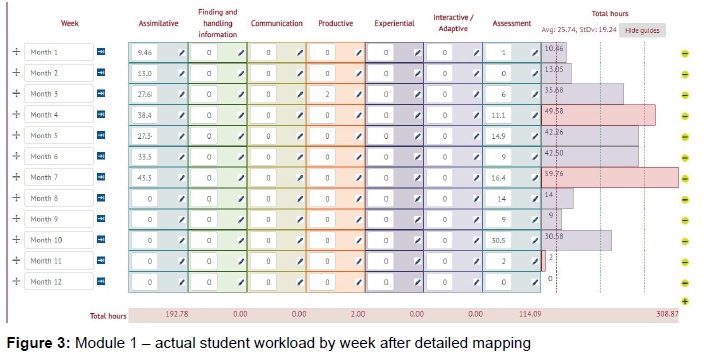
Importantly, in the case of the Unisa first-level mathematics modules, the study speed was generally set to 20 words per minute. If students were reading less complex texts, for example in the study guide, more words per minute were required. A medium study speed was agreed to be 40 words per minute, and a fast speed 60 words per minute. Three minutes were allowed for each equation students were required to study in the textbook, five minutes were allowed per figure and five minutes per table. This was based on the complexity of the study material and also allowed for the fact that many students would not be reading in their first language. Time allowed for video and audio material was automatically doubled, since the assumption was that students would need to watch or listen to this material at least twice. In other words, when entering the time for a five-minute video, it would automatically be calculated by the tool to require ten minutes.
The OU online workload tool was used to calculate workload for each week or month of the module (see Figure 3). Workload was broken down according to the seven categories of the OU activity planner framework (Galley 2015, 14 - see Table 1) and the data visualised on the tools (Figures 3 and 4). This enabled visualisation of the overall balance of different types of student activity across the entire module, as well as detailed analysis of the actual weekly workload.
As can be seen from the Figures 3 and 4, the workload was especially heavy in months 4 and 7. In month 4, the first assignment was due and students were expected to prepare for the second assignment. In month 7, Assignment 04 on Trigonometry was due and extra material was provided due to the difficulty experienced by students in assimilating the complexity of the content. Towards the end of the module, the directed workload tapered off because students would be expected to revise for their examination. As such, in relation to research questions 1 and 2, the OU LD tools could be applied successfully in the Unisa context and they effectively highlighted and identified design problems in Module 1.
Detailed assessment overview
As mentioned previously, Module 1 had five formative assessments that accounted for 20 per cent of the grade and an examination that accounted for the 80 per cent of the overall grade. The pass rate of different assignments is illustrated in Figure 5 and the pass rate for the module as a whole is presented in Figure 6.
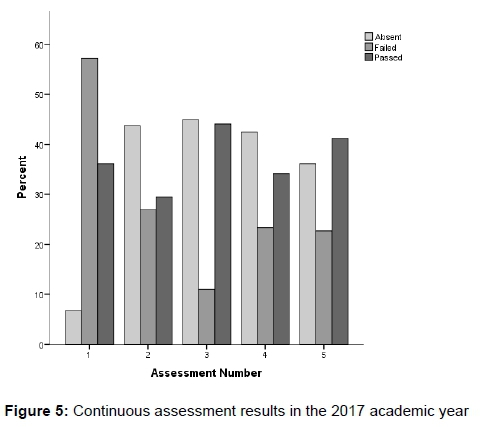
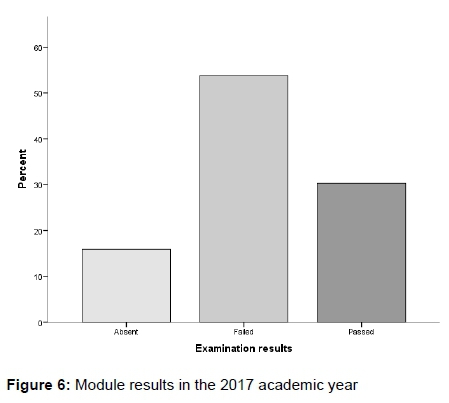
In relation to students' overall progression and success rate in Module 1, the results were similar to those of previous years and followed the trend observed in the historic success of the module. In relation to continuous assessments, the highest number of students submitted Assignment 01, but the highest number of students also failed this assignment. The remaining four assignments had a very different pattern: the majority of students chose not to submit any work (as these were non-compulsory formative assessments), resulting in a lower percentage of fails. The percentage of students obtaining a pass grade and above fluctuated between assessments, with Assignment 03 and Assignment 05 having the highest pass rates. This trend possibly indicates that students withdrew from the module after they had failed the initial assignment.
Learning design related to the fact that only Assignment 01 was compulsory. However, it was sufficient merely to submit the assignment - students were not required to pass Assignment 01 to gain admission to the examination. The continuous data on student performance in assignments revealed that the students overestimated their content knowledge and did not engage with the study material sufficiently, consequently they failed Assignment 01. This impacted on their attitude and performance in subsequent assignments.
Module 2
Historic overview of pass rates
A total of 11 724 students were enrolled to study Module 2 between the years 2010 and 2017. There were two examination periods in each year (June and October). Over the years, 2 801 students repeated the module mainly twice (23.9%), but there were some students who attempted to pass this module five or six times (3.2%), and even ten or more times (<1%). Non-South African students were better at passing the module the first time around (64.8%) than South African students (56.8%).
The historical examination data for years 2010 to 2016 were analysed. The demographic distribution of students in each year was similar to those obtained for Module 1 and the overall student composition remained relatively similar every year. In order to see how successful students were in passing this module, the same coding as for Module 1 was used and three groups of students were identified: those who did not submit assignments or were absent during an assessment; those who failed the module; and those who passed the module. The historical distribution of the module examination results per semester for each academic year are presented in Figure 7.
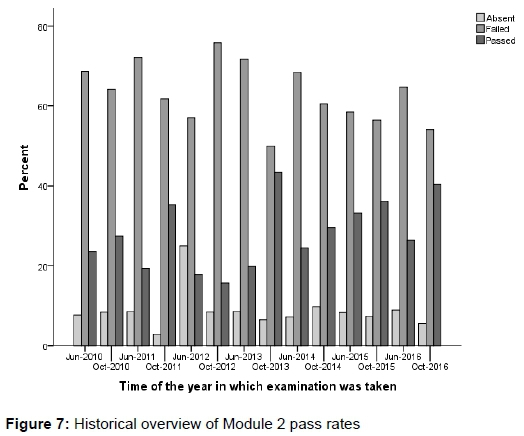
As can be seen from the Figure 7, a large majority of students failed the module, and students who wrote the examination in June were more likely to fail than those students who wrote the examination in October. The notable exception was the October 2012 period, when students did worse in October than they did in the June examination. There was also an uncharacteristic spike in the pass rates in October 2013, when the pass rate almost doubled. However, in 2014 the pattern again resembled pre-2012 patterns. Thereafter pass rates improved year on year. The spike in the pass rate for October 2013 was thought to be the result of the introduction of e-tutors. However, as the e-tutors continued their work in the subsequent semesters, the improvement in the pass rate was not sustained.
Learning design coding
The same procedure as that described for the Module 1 learning design section was employed to see how the module workload was distributed. An overview of the activities is presented in Figure 8 and the weekly workload is presented in Figure 9.
As can be seen from Figures 8 and 9, the workload for Module 2 was found to be much heavier than suggested by the module materials. Weeks 7 and 8 had a particularly heavy workload owing to a large amount of study material to assimilate (week 7) and preparing for the written Assignment 02. In week 11, prior to the final examination, the directed workload appeared lighter, but students would be expected to be revising. Week 12 reflected the assessment activity only. Module 2 results also showed that the distribution of workload, a lack of communication activities and the emphases on assimilative and assessment activities might be problem areas -a further indication that the OU LD tools would be useful for mapping the modules at Unisa and identifying problems with the design of Module 2. The data analysis and visualisation constitutes the "Record" phase of the Action Research Spiral.
Detailed assessment overview
During the study period (2010-2016) there was a significant difference between June and October examination pass rates. In 2017, when the module was mapped, there was no notable difference between students who wrote their examinations in June and those who wrote in October. The pass rates for continuous assessments in Semesters 1 and 2 are illustrated in Figure 10, and the module results for the 2017 academic year (semesters 1 and 2) are presented in Figure 11.
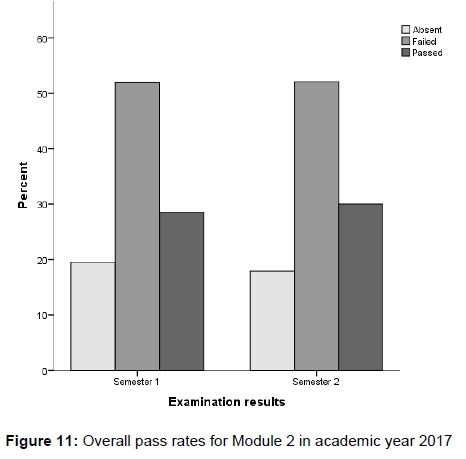
Prior to the learning design analysis, the opinion was that students submitted only Assignment 01 to obtain examination admission and fewer students submitted Assignment 02. The heavy workload in week 7 pointed out by the LD analysis led to another view, namely that students were overwhelmed by the amount of work to be done. In week 7, students were expected to assimilate double the amount of work done in any other week.
Students performed well in both Assignments 1 and 2, as the assignments were open-book assessments that were done in their home environment.
The number of students absent from the examination was about the same as the number of students who did not submit Assignment 02. Students who wrote the examination after they had passed the continuous assessments could therefore expect to pass the final examination. As most students failed the examination, the module assignment is an area to be improved.
DISCUSSION
A number of insights were derived during the "Reflect" phase of the Action Research cycle. Engagement is affected by high workload in certain parts of the module. Peaks in module-directed workload occur where students grapple with tricky topics. In Module 1, trigonometry is a complex concept with a significant amount of new material to assimilate in a relatively short period of time. The same applies to the introduction of integration in Module 2, week 7.
In both modules there are some weeks, for example the weeks leading up to the final examination, when directed workload appears lighter owing to the expectation that students will be studying and revising. The module materials do not explicitly state what students should do at this point. It may be useful to provide more structured guidance to students about how to use this time. The question of how to design modules to support student revision is one that the OU UK is also currently attempting to answer.
OU UK research shows a strong link between communication activities and retention (Rienties and Toetenel 2016). Neither Module 1 nor Module 2 has a significant communicative element built into the design. E-tutors are employed to run student forums. The content of the forums and additional material supplied by the tutors are not part of the design. This adds to the student workload and is therefore ignored by most.
In the case of Module 1, the design of the continuous assessment impacts significantly on student engagement and outcomes, while in Module 2 the final assessment has a greater impact.
LIMITATIONS
Student engagement aspires to involve students as partners in their own learning. As such, future research should aim to obtain student and tutor feedback on both these modules. Students and tutors are key stakeholders and getting feedback from them will enable triangulation between learning design and learning analytics data. Also, in keeping with the "spiral of action research", we want to keep learning from the experience of those directly involved in learning and teaching in order to improve the design.
The geographical distance between collaborators in this research also posed a challenge at times. For example, OU learning design places a strong emphasis on creative and collaborative face-to-face workshop techniques, which were not possible in this study. Instead, the learning design specialist explained the key elements of the design process via Skype, and asynchronous communication and collaboration methods were used to share information.
CONCLUSIONS AND RECOMMENDATIONS
Despite the limitations of this study, this is the first action research study that tested the application of OULD tools in the context of distance higher education in South Africa. Using learning analytics along with learning design tools, this research has outlined the issues faced in the two distinct modules. The main concerns were student engagement and academic outcomes. By analysing student activity and visualising designs, we have uncovered areas where design can be improved in order to address these problems. Furthermore, application of learning design in these two mathematics modules showed that although there are some shared challenges, each module has its own unique aspect that needs to be improved which further supports the adaptability of the OULD in the context of a different educational system.
Overall, the mapping done by the IDEAS project provides evidence of student workload issues and highlights aspects of design that should be focused on when these two modules are reviewed and redeveloped for online delivery. Specific recommendations for enhancements are as follows:
• A more even distribution of workload per month for Module 1 and per week for Module 2.
• A tutor manual so that tutorial activities form part of the workload. This should include directed questions to start a conversation about module content between the tutor and students, as well as among students themselves.
• The final assessment part of Module 2 should be further investigated. The time allowed and the timing in the examination period, among other factors, may contribute to the low pass rate.
• To increase student engagement, a greater variety of learning activities should be planned.
These reflections will inform the next "Plan" stage of the Action Research spiral. Further research is needed to test the proposed solutions to the learning design issues identified in this study and to gather feedback from students. In terms of the research questions, the module leaders found that the data visualisations yielded useful insights about how design of their modules could be improved and that the OU LD approach was relevant and applicable in the Unisa context.
In light of a global move towards more blended approach to teaching in higher education, the findings obtained in this study can further guide educators to effective change of the curriculum towards a better designed online learning environment. In particular, In South Africa the disruptions to the academic calendar due to student and service delivery protests, forces universities to move into the distance education space and online delivery of courses, and therefore, insights gained at UNISA can be useful in the broader South African context.
ACKNOWLEDGEMENT
The IDEAS project is funded by a Newton Grant from the Economic and Social Research Council, UK [ES/P002161/1] and the National Research Foundation, SA [UTSA160329161196].
NOTES
1 http://ideaspartnership.org/
2 Jisc is the UK's not-for-profit national expert body for digital technology and digital resources in higher education, further education and research; it plays an important role in coordinating development initiatives in areas such as curriculum design and digital capabilities, in order to inform educators' practice and institutional strategy.
REFERENCES
Case, A. 2009. The action reflection cycle, adapted from CELT (2008). https://www.flickr.com/photos/caseorganic/4069528636 (Accessed 2 March 2018). [ Links ]
Conole, G. 2013. Designing for learning in an open world. London: Springer. [ Links ]
Cross, S., R. Galley, A. Brasher and M. Weller. 2012. Final Project Report of the OULDI-JISC Project: Challenge and change in curriculum design process, communities, visualisation and practice. Institute of Educational Technology, The Open University. http://www.open.ac.uk/blogs/OULDI/wp-content/uploads/2010/11/OULDI_Final_Report_Final.pdf (Accessed 7 August 2018). [ Links ]
Galley, R. 2015. Introducing methods for enhancing curriculum innovation and quality. Institute of Educational Technology. http://www.open.ac.uk/iet/learning-design/sites/www.open.ac.uk.iet.learning-design/files/files/ecms/web-content/Learning-Design-at-the-Open-University.pdf (Internal site - accessed 26 June 2017). [ Links ]
Healey, M., A. Flint and K. Harrington. 2014. Engagement through partnership: Students as partners in learning and teaching in higher education. Higher Education Academy, UK. https://www.heacademy.ac.uk/system/files/resources/engagement_through_partnership.pdf (Accessed 28 February 2018). [ Links ]
Macfarlane, B. and M. Tomlinson. 2017. Critiques of student engagement. Higher Education Policy 30: 5-21. DOI: 10.1057/s41307-016-0027-3 (Accessed 13 January 2019). [ Links ]
Mittelmeier, J., D. Long, F. M. Cin, K. Reedy, A. Gunter, P. Raghuram and B. Rienties. 2018. Learning design in diverse institutional and cultural contexts: Suggestions from a participatory workshop with higher education professionals in Africa. Open Learning: The Journal of Open, Distance and E-learning. https://doi.org/10.1080/02680513.2018.1486185 (Accessed 13 January 2019). [ Links ]
Newswander, L. and M. Borrego. 2009. Engagement in two interdisciplinary graduate programs. Higher Education 58(4): 551-562, cited by B. Macfarlane and M. Tomlinson. (2017) In Higher Education Policy 30: 1-4. doi:10.1057/s41307-016-0026-4 (Accessed 13 January 2019). [ Links ]
Nguyen, Q., B. Rienties, L. Toetenel, R. Ferguson and D. Whitelock. 2017. Examining the designs of computer-based assessment and its impact on student engagement, satisfaction, and pass rates. Computers in Human Behavior, 703-714. https://doi.org/10.1016/j.chb.2017.03.028 (Accessed 13 January 2019). [ Links ]
Nguyen, Q., B. Rienties and L. Toetenel. 2017. Unravelling the dynamics of instructional practice: A longitudinal study on learning design and VLE activities. In Seventh International Learning Analytics and Knowledge Conference, Vancouver, British Columbia, Canada, ed. Marek Hatala, Alyssa Wis, Phil Winne, Grace Lynch, Xavier Ochoa, Inge Molenaar, Shane Dawson, Shady Shehata, Jennifer Pei-Ling Tan, 168-177. ACM, New York. [ Links ]
Norton, L. 2009. Action research in teaching and learning: A practical guide to conducting pedagogical research in universities. London: Routledge. [ Links ]
Open University UK. 2017. Ensuring consistent student workload on a module: Curriculum management guide. (Internal document). [ Links ]
Open University Centre for Outcomes Based Learning. 2005. Action research: A guide for associate lecturers. Open University internal document (Accessed 2 March 2018). [ Links ]
Rienties, B., L. Toetenel and A. Bryan. 2015. Scaling up learning design: Impact of learning design activities on LMS behavior and performance. In Proceedings of the Fifth International Conference on Learning Analytics and Knowledge 2015, 315-319. ACM, New York, NY, USA. [ Links ]
Rienties, B. and L. Toetenel. 2016. The impact of learning design on student behaviour, satisfaction and performance: A cross-institutional comparison across 151 modules. Computers in Human Behavior 60: 333-341. http://www.sciencedirect.com/science/article/pii/S0747563216301327 (Accessed 25 March 2018). [ Links ]
Rienties, B., Q. Nguyen, W. Holmes and K. Reedy. 2017. A review of ten years of implementation and research in aligning learning design with learning analytics at the Open University UK. Interaction Design and Architecture(s) Journal 2017 33: 134-154. http://www.mifav.uniroma2.it/inevent/events/idea2010/doc/33_7.pdf (Accessed 7 August 2018). [ Links ]
Rienties, B., T. Lewis, R. McFarlane, Q. Nguyen and L. Toetenel. 2018. Analytics in online and offline language learning environments: The role of learning design to understand student online engagement. Journal of Computer-Assisted Language Learning. Journal of Computer Assisted Learning 31(3): 273-293. [ Links ]
Subotzky, G. and P. Prinsloo. 2011. Turning the tide: A socio-critical model and framework for improving student success in open distance learning at the University of South Africa. Journal of Distance Education 32(2): 177-193. http://www.tandfonline.com/doi/abs/10.1080/01587919.2011.584846 (Accessed 26 June 2017). [ Links ]
Toetenel, L. and B. Rienties. 2016a. Analysing 157 learning designs using learning analytic approaches as a means to evaluate the impact of pedagogical decision making. British Journal of Educational Technology 47(5): 981-992. https://doi.org/10.1111/bjet.12423 (Accessed 26 June 2017). [ Links ]
Toetenel, L. and B. Rienties. 2016b. Learning design - creative design to visualise learning activities. Open Learning 31(3): 233-244. [ Links ]
Whitelock, D. M. Thorpe and R. Galley. 2015. Student workload: A case study of its significance, evaluation and management at the Open University. Distance Education 36(2): 161-176. https://doi.org/10.1080/01587919.2015.1055059 (Accessed 25 March 2018). [ Links ]

