


Services on Demand
Article
 English (pdf)
 Article in xml format
 Article references
Indicators

Related links
-
 Cited by Google
 -
 Similars in Google
Share

 Permalink
Acta Commercii
On-line version ISSN 1684-1999
Print version ISSN 2413-1903
Acta Commer. vol.23 n.1 Johannesburg 2023
http://dx.doi.org/10.4102/ac.v23i1.1135
ORIGINAL RESEARCH
The impact of United States macroeconomic news announcements on the Johannesburg Stock Exchange
Chad V. AlfonsoI; Ilse BothaI; Lydia PelcherII
ISchool of Accounting, College of Business and Economics, University of Johannesburg, Johannesburg, South Africa
IIDepartment of Commercial Accounting, College of Business and Economics, University of Johannesburg, Johannesburg, South Africa
ABSTRACT
ORIENTATION: Macroeconomic news announcement poses a risk to stock returns, especially that of United States (US) on emerging markets because of globalisation.
RESEARCH PURPOSE: The purpose was to investigate the impact that US macroeconomic news announcements have on the Johannesburg Stock Exchange (JSE).
Motivation for the study: Investment in financial markets is volatile. Globalisation means that greater economies' macroeconomic news announcements could impact emerging financial markets. Knowing which announcements have an influence could improve investment decisions.
RESEARCH DESIGN, APPROACH AND METHOD: This study is qualitative, following secondary data analysis. Analysis was carried out using volatility modelling, paired with an event study to add robustness.
MAIN FINDINGS: The generalised autoregressive conditional heteroskedastic (GARCH) models indicated that US macroeconomic news announcements made in relation to unemployment were statistically significant, with a negative impact on the JSE. This was supplemented by the event study in which interest rate announcements that were made in August 2008 (during the global financial crisis) were found to have a statistically significant impact on the JSE. The coronavirus disease 2019 (COVID-19) pandemic did not appear to have a statistically significant impact in the results obtained from the event study.
PRACTICAL/MANAGERIAL IMPLICATIONS: Investment industry professionals and policymakers should consider unemployment announcements from the US to enhance investment decisions while managing stock market volatility.
Contribution/value-add: The results make a novel contribution towards the findings during the initial COVID-19 period and generalisability of the method as well as the theoretical expansion of the theoretical application of globalisation on stock markets.
Keywords: volatility; asymmetric; GARCH; macroeconomic news announcements; Johannesburg Stock Exchange (JSE); South Africa; event study; COVID-19.
Introduction
The risk that macroeconomic news announcements pose to stock returns has been a focal point for financial economics over the years (Cakan 2012; Cakan & Gupta 2017; Chen, Roll & Ross 1986; Ederington & Lee 1993; Engle & Ng 1993; Nadler & Schmidt 2016). Macroeconomic news announcements are important risk factors for financial markets as they are an indication of the state of the economy of the country that is reporting the announcement (Cakan & Gupta 2017). These news announcements enable one to understand what drives movements in stock markets and the volatility within these stock markets (Gupta & Reid 2013). The stock markets affected are often not limited to the country making the news announcements but it also spills over to other countries' stock markets. Of even greater importance is the impact that United States (US) macroeconomic news announcements have on emerging markets as the US economy is one of the strongest economies in the world (Cakan, Doytch & Upadhyaya 2015).
Globalisation and economic integration have influenced the impact of macroeconomic announcements of major economies (e.g., US, Japan, European Union) on the financial markets of other economies (Cakan & Gupta 2017). There is an increase in interdependencies between nations because of globalisation (Salahuddin et al. 2019). Globalisation has decreased the effects of diversification on systematic risk (Sarwar 2019), which results from the effects that globalisation has on financial markets (Cakan & Gupta 2017). Furthermore, globalisation is viewed as the increased connectivity of countries (Bekaert & Hodrick 2014). Therefore, globalisation has increased the connectivity of the world and has decreased the impact of diversification. In addition to globalisation is the impact of contagion. Kao et al. (2019) refer to contagion as the cross-country transmission of shocks or the spillover effects. This implies that the impact of US macroeconomic announcements in the US can spill over into another country such as South Africa. Given this, it is important to understand the market volatility associated with these announcements. Consequently, it is important for policymakers and for those who determine portfolio asset allocation as it will thus enable them to make profitable investment decisions (Cakan & Gupta 2017; Gupta & Reid 2013).
With the use of generalised autoregressive conditional heteroskedastic (GARCH) modelling and an event study analysis, this study seeks to answer the following research question: What impact does US macroeconomic news announcements have on the returns earned on the Johannesburg Stock Exchange All Share Index (JSE ALSI)? The academic implication of answering this question is that more clarity can be provided on the contradictory results (obtained in prior studies) and an alternative means to investigate the impact of macroeconomic news announcements. The real-world implications being that investors, companies and risk managers can make better-informed decisions as they will be able to understand the implications of macroeconomic news announcements on the stock market, which in turn will have an impact on the decisions that they make. In addition to the aforementioned, investment industry professionals and policymakers from various countries can enhance their understanding of the impact that these US macroeconomic news announcements have on the JSE and ultimately improve their risk management skills and policymaking decisions.
Literature review
The impact of scheduled US macroeconomic (and other major economies) news announcements on financial markets have been the topical through the years (Cakan & Gupta 2017; Cakan et al. 2015; Christiansen & Ranaldo 2007; Joshi & Pandya 2012; Maserumule & Alagidede 2017; Nadler & Schmidt 2016; Smales, O'Grady & Yang 2015). However, the research on the impact of these announcements on emerging markets is somewhat scarce. Cakan and Gupta (2017) labelled globalisation as one of the main reasons major economies, such as the US and Europe, have such a big impact on their own economy and the markets of other countries. Belgacem et al. (2015) identified the US as the topic of multiple studies because of the central role that the US plays in determining the development of the global economy. Hence, the importance of understanding the impact that US macroeconomic announcements have on developing markets. It is suggested by Smales et al. (2015) that US macroeconomic news tends to have the greatest impact on the volatility of markets and stock returns in other countries, which is supported by Cakan and Gupta (2017). However, this point is contradicted by Gupta and Reid (2013), in which news on macroeconomic variables (e.g., consumer price index [CPI] and producer price index [PPI]) are found to have a very small impact on stock market returns in South Africa. Nonetheless, Cakan et al. (2015) identified the US as one of the countries that have the greatest impact on the economies of various developing countries and identified the integration (globalisation) of the global economic environment, as a major reason behind the impact that the US has on developing nations' respective economies.
Given the aforementioned impact that the US economy has on the volatility within markets, Cakan and Gupta (2017) claimed that stock market movements have been widely studied by researchers, who have identified macroeconomic news as one of the main drivers of stock returns and volatility within the market. Petralias and Dellaportas (2015) stated that scheduled macroeconomic news announcements were found to have a decisive impact on the volatility of stocks. Similarly, Cakan et al. (2015) identified that macroeconomic news announcements impact the volatility of stock markets and are one of the drivers of share price returns.
The study conducted by Cakan and Gupta (2017) sought to determine the impact of US macroeconomic news announcements, and whether it was unexpected, on the volatility within the JSE ALSI. They calculated the surprise-element when the announcement was different from the market's expectations. The macroeconomic news announcements were related to inflation and unemployment, similar to the study conducted by Cakan et al. (2015). A variant of the GARCH model was used to analyse these announcements, as the GARCH model eliminates any autoregressive conditional heteroskedastic (ARCH) effects and is in line with Cakan et al. (2015) in terms of eliminating the ARCH effects. The variant of the GARCH model used was the exponential GARCH (EGARCH) and the threshold GARCH (TGARCH) models. The reason why a variant was used was because of the fact that the GARCH model is not able to account for asymmetric effects of both positive ('good') and negative ('bad') news shocks. Both of the variants were tested, and it was thus determined that the most appropriate model was, in fact, the TGARCH model. 'Good' news and 'bad' news have different meanings for different announcements. In the context of this study, 'good' news on inflation indicates a decrease in inflation and 'bad' news shows an increase. An increase in unemployment results in 'bad' news and a decrease in unemployment is seen as 'good' news. It was found that there is an increase in volatility following 'good' news on inflation and 'bad' news on unemployment in the US. There is a decrease in volatility following 'good' news about unemployment in the US. A final conclusion made by Cakan and Gupta (2017) is that a positive movement, with regard to economic growth and unemployment, in the US enables a more stable and less volatile stock market within developed nations.
The impact of US macroeconomic announcements on US stock prices was investigated by Nadler and Schmidt (2016). Many news announcements were investigated, namely gross domestic product (GDP) figures, CPI, PPI, jobless claims, and the international trade balance. This study also investigated a buy-and-hold strategy against three different strategies. The three strategies considered were, Model One, where the returns were realised on the day of announcement, all variables were included. Model Two, where returns were realised on the day of announcement, limited to the variables with a 95% significance. Model three, where returns were realised on the day of announcement, limited to variables with a 97.5% significance. An autoregressive moving average-generalised autoregressive conditional heteroskedastic (ARMA-GARCH) framework was used to investigate these announcements. In the case of a buy-and-hold strategy for an investor, it was found that the mean returns per day were higher on the days in which the macroeconomic announcement was made. A factor that was identified with regard to returns was that of transaction costs. Transaction costs have the ability to affect the outcome of the trading strategies.
Smales et al. (2015) studied the impact that US macroeconomic news announcements have on the gold futures market. The news announcements investigated are on the CPI, GDP, personal income, PPI, and the unemployment rate. A visual comparison was conducted first and was subsequently followed by a formal approach. The visual comparison was conducted with regard to the market activity (relating to absolute returns, bid-ask spreads, realised volatility, and volume traded) following a major macroeconomic announcement. In order to provide robustness to the study, a vector autoregression-generalised autoregressive conditional heteroskedastic (VAR-GARCH) framework was utilised to investigate the impact of such announcements. It was found that major macroeconomic announcements made by the US have a significant influence on the market activity mentioned previously. More importantly, volatility appears to increase the bid-ask spreads that result in lower transaction volume.
Research methods and design
Data were gathered on the closing prices of the JSE ALSI and obtained from IRESS ViewPoint Plus. All data obtained are secondary in nature, collected from already published reports. The data ran over the period starting August 2004 and ending January 2021; it is important to notice that the financial crisis of 2008 and the coronavirus disease 2019 (COVID-19) pandemic were present in the sample and will potentially be able to provide interesting results on volatility within the market. The population from which the data was collected, consists out of the JSE ALSI and US macroeconomic announcements made during the sample period. The data obtained possessed a daily frequency. The days on which the US macroeconomic announcements were made were obtained from the Federal Reserve Economic Data (FRED) database.
In order to accurately work with the data, the data were transformed to present the returns on the JSE ALSI. The data obtained from the aforementioned sources were transformed into returns by taking the log difference of the closing prices. This approach is commonly used and can be attributed to multiple articles (Cakan & Gupta 2017; Cakan et al. 2015; Gupta & Reid 2013; Smales et al. 2015). The data were analysed using the GARCH models and an event study to ensure robustness.
The macroeconomic news announcements were in relation to GDP, inflation, interest rates and unemployment statistics. From a frequency of the announcement perspective, Table 1 presents the announcements considered in this study, the frequency by which these announcements are made and the expected outcome.
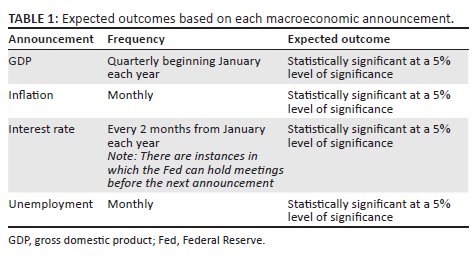
Regarding Table 1, the expected outcomes are based on the findings made in prior studies reviewed in the literature review section. The frequency of the days on which the macroeconomic announcements were made was not important to this study. However, the date on which the announcement took place was of great interest as this provided a point in time to measure volatility. Finally, the E-Views statistical software package was used to investigate the data obtained.
Volatility modelling
From a volatility modelling perspective, the following steps were followed, beginning with the unit root test, testing for ARCH effects, the build of the GARCH models and finally, the model evaluation. A volatility model is used to forecast volatility, especially on future returns in relation to a volatility shock, such as a news announcement from the US (Engle & Patton 2007). This will lead to volatility clustering, which should create expectations of similar future events. The variables from the volatility modelling were then subjected to the event study, ensuring robustness.
The data were first tested for stationarity using the Augmented Dickey-Fuller (ADF) and the Phillips-Perron (PP) tests. The null hypothesis tested (for both the ADF and PP tests) is that the transformed data have a unit root; alternatively, the transformed data will not have a unit root. The null hypothesis of the unit root is that the data is non-stationary. The null hypothesis is rejected when the t-statistic is less than the critical values - thus concluding that the data are stationary. When the t-statistic is greater than the critical values, the null hypothesis of a unit root is not rejected - thus concluding that the data are non-stationary.
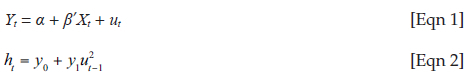
The next test was performed to test for the presence of the ARCH effect within the data. The ARCH effects will confirm which model will require the ARCH estimation method rather than the ordinary least squares (OLS) method. The test used to test for ARCH effects was the ARCH Lagrange Multiplier ARCH-LM test. The null hypothesis tested will be that there are no ARCH effects - meaning that the data is homoskedastic. Alternatively, there will be ARCH effects - meaning that the data are heteroskedastic. No ARCH effects being present within the data means that there is no volatility clustering and, therefore, no cointegration within the data. The opposite, the presence of ARCH effects (i.e., the alternative hypothesis) results in volatility clustering being present within the data and their cointegration. The null hypothesis will be evaluated at the 5% level of significance, that is if the p-value is less than 5%, the null hypothesis will be rejected. This test will enable one to determine, in a more appropriate manner, whether or not volatility is present within the data series. An ARCH (p) model will be subsequently fitted. The residuals of the model will thus be evaluated at the 5% level of significance to determine whether or not the residuals are statistically significant. Within the ARCH (I) model, the mean and the variance are modelled simultaneously with the following specification where Equation 1 is the mean equation and Equation 2 is the variance:
For each of the GARCH models (GARCH, TGARCH, EGARCH), the best model was selected through the evaluation of two information criteria, namely the Akaike Information Criterion (AIC), and the Schwarz Information Criterion (also SIC, SBC, SBIC). From the two criteria, the model with the lowest value was selected. However, given that the AIC information criterion is the most commonly used statistic to determine the best model, the model with the lowest AIC value was thus chosen as the best fit model.
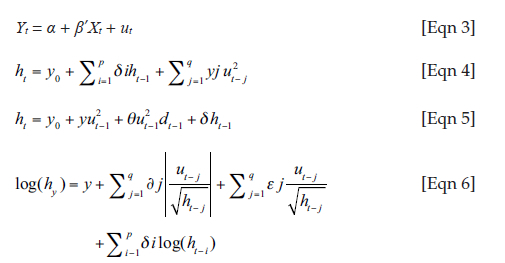
A GARCH (p, q) model was fitted following the ARCH model. This model also had its residuals evaluated at the 5% level of significance and can be viewed in Equation 3 (mean model) and Equation 4 (variance model). The TGARCH (p, q) model was subsequently constructed following the ARCH and GARCH models - and can be represented by Equation 5. The coefficients were evaluated and tested for statistical significance at the 5% level of significance. It is important to observe that asymmetry will be present within the data if the coefficients are positive and statistically significant. However, if the coefficients are negative, there will be no asymmetry present within the data. The EGARCH model was the final model fitted and is represented by Equation 6. Regarding Equation 6 (EGARCH model specification) - when the ԑj parameter is negative and statistically significant at a 5% level - bad news announcements generate larger effects on the underlying data than good news. Alternatively, when the ԑj parameter is equal to zero, the model is then said to be symmetric. To determine the impact of the specified US macroeconomic announcements, dummy explanatory variables were added to the variance equation in all three of the GARCH models used - the value 1 was used in the underlying data to highlight the day on which an announcement was made, and 0 was used to denote all of the other days in which an announcement was not made. These explanatory variables were then evaluated at a 5% level of significance to determine if there was an impact on the JSE:
Event study
The following steps were followed to conduct the event study on the relevant announcements:
1. The estimation period, the event day and the event period were determined.
2. The returns were calculated for the ALSI.
3. A market model was estimated in E-Views using the returns calculated in the previous step.
4. From the market model, the β, α and ԑ were determined and subsequently utilised.
5. The expected return was calculated.
6. The abnormal returns were calculated.
7. The t-value for each abnormal return was subsequently calculated.
8. Steps five, six and seven were evaluated and discussed to obtain results.
The estimation period is the period in which the market model coefficients are determined. It is the 250 periods before the event period. The event period is the period that occurs 10 days before the event and 10 days after the event. It is the period in which the expected returns, abnormal returns and t-value figures are calculated. Finally, the event day is the day on which the announcement occurred. From the perspective of selecting the event days to analyse, in the underlying data, there was a total of 520 event days - a sample of 16 event days were randomly selected and used for the evaluation (4 event days for each news announcement).
The returns were calculated through the use of a log difference using the following formula:

In which Rt denotes the return, log(Pt) denotes the current price and log(Pt-1) denotes the price one period back. This return calculation was applied to the JSE ALSI over the estimation period, event period and event day. Once the differenced data were obtained, the market model was subsequently estimated in which the β, α and ԑ terms were all determined first, followed by the expected return on the JSE ALSI calculation - it is important to notice that the Standard and Poor's 500, or simply the S&P 500 was used as the benchmark, which is in line with the study conducted by Dimpfl (2011), in which the impact of US news was investigated on the German stock market. The market model is estimated with the following formula:

Rit denotes the expected return calculated from the market model. The coefficients were extracted and subsequently utilised in Excel to calculate the abnormal return and the t-value of those abnormal returns. The expected return can be viewed as the return that is expected to be earned on any normal day. In contrast, the abnormal return is the return that is expected to be earned given a particular event. The abnormal return was calculated as the difference between the return earned on the JSE ALSI and the expected return on the JSE ALSI.
After the calculations of the expected returns and abnormal returns, the t-value was calculated as the abnormal return divided by the error term (ԑ). Through the use of the t-value, one is able to statistically evaluate the data with the decision criteria being: if the absolute value of the t-value is greater than two, then one would be in possession of a significant t-value and would thus be able to reject the null hypothesis; however, if the t-value is less than 2 then one would not reject the null hypothesis. The null hypothesis tested in this study is that the announcements had a significant impact on the returns on the JSE ALSI, and the alternative is that there was no effect on the returns.
Ethical considerations
This article does not contain any studies involving human participants performed by any of the authors.
Results
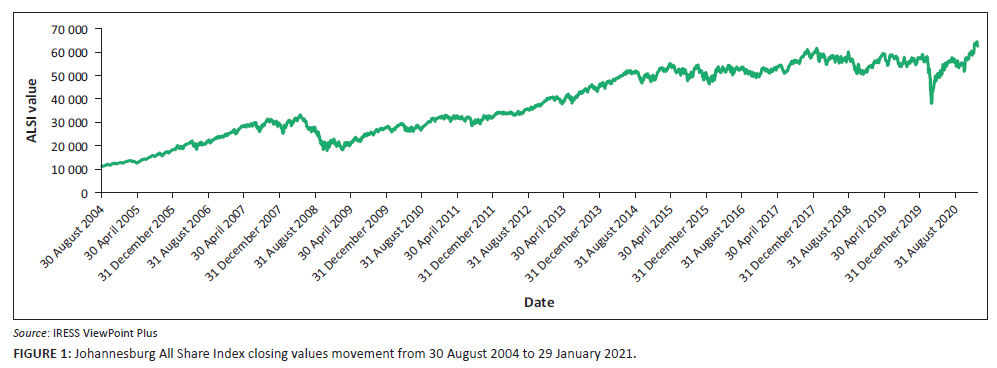
This section presents the results that were obtained from the volatility modelling and the event study. The section will begin with an evaluation of the data - testing for stationarity and evaluation of the descriptive statistics. The results obtained from the volatility models are presented and discussed. Following the volatility modelling, the results from the event study are presented and evaluated. Figure 1 presents the underlying data set, from 2004 to 2021, prior to the transformation of the data.
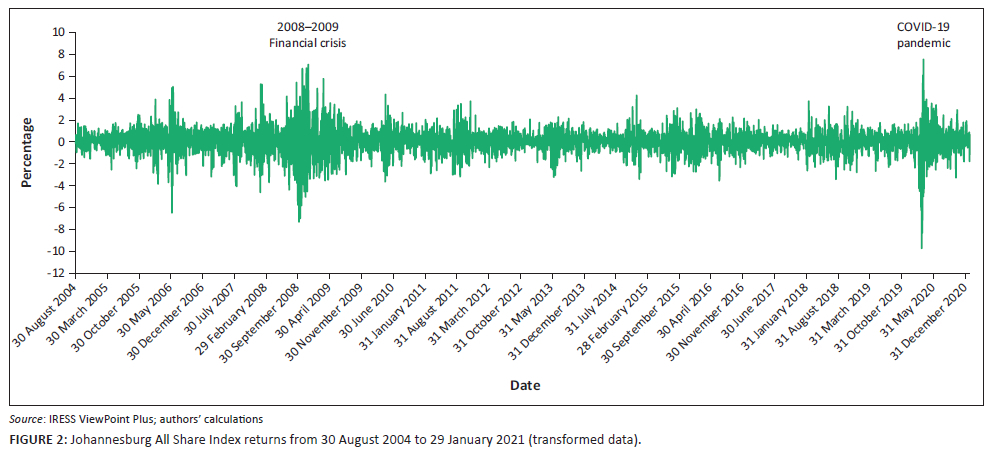
The JSE ALSI has grown substantially over this period - moving from 11 158 index points at the start of the data to 62 472 index points at the end. This represents a 460% increase in the index value over the period. Significant declines can be observed, specifically throughout the financial crisis of 2008-2009 and more recently at the beginning of the COVID-19 pandemic in South Africa during March-April 2020. Recoveries can be observed following these declines - a steady recovery following the financial crisis and a relatively immediate recovery during the pandemic. Figure 2 is a graphical representation of the transformed data.
The return data should be stationary in order to conduct the modelling. Figure 2 is different graphically from Figure 1. One can observe that in Figure 1, it was clear to see that there was an upward trend in the data. However, the transformed data represented in Figure 2 is no longer exhibiting an upward trend but rather what appears to be mean reversion (in essence stationarity) with volatility clusters. Furthermore, the same events highlighted by Figure 1 can be identified as these clusters in Figure 2, namely the 2008-2009 financial crisis and the effect of the COVID-19 pandemic. According to Figure 2, one can observe that the data is now stationary, however a more formal test is required to confirm such.
Transformation of the data into returns now ensures that the data can now be assessed more formally for stationarity. The results of the stationarity tests can be found in Table 2 for the ADF test and for the PP test.
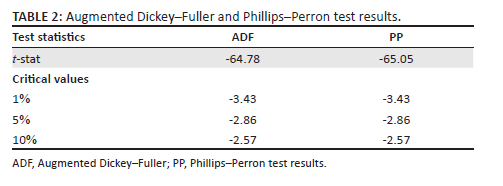
The results obtained from the ADF test are presented in Table 2. The results indicate that the ADF t-stat is -64.78. This t-stat is more negative than the critical values at 1% (-3.43), 5% (-2.86) and 10% (-2.57) levels of significance. Given these obtained results, the null hypothesis of the data having a unit root is rejected. It can be formally accepted that the data are indeed stationary. Following the ADF test, the PP test was conducted. The results obtained from the PP test are presented in Table 2. The results indicate that the PP t-stat is -65.05. This t-stat is more negative than the critical values at a 1% (-3.43), 5% (-2.86) and 10% (-2.57) levels of significance. Given these results, the null hypothesis of the data having a unit root is rejected. It can be formally accepted that the data are indeed stationary.
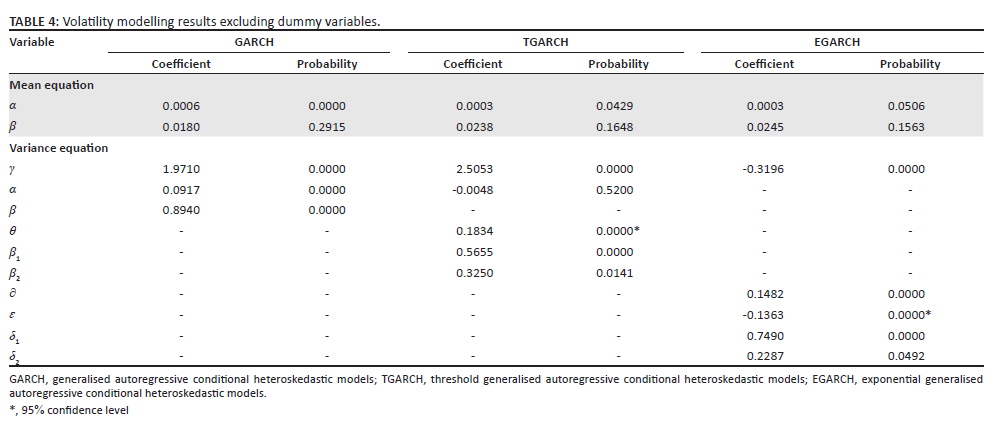
Table 3 presents the best fit models for the GARCH, TGARCH and EGARCH models, respectively. These models are highlighted in bold and are the most suitable models to be used. The best fit models are a GARCH (1, 1), TGARCH (1, 2) and an EGARCH (2, 1).
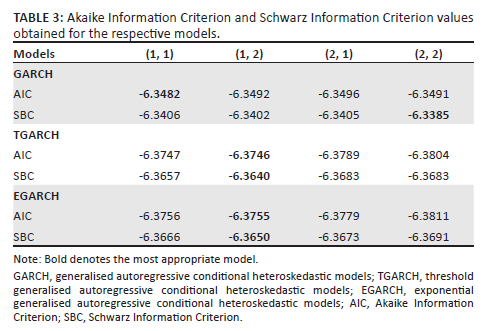
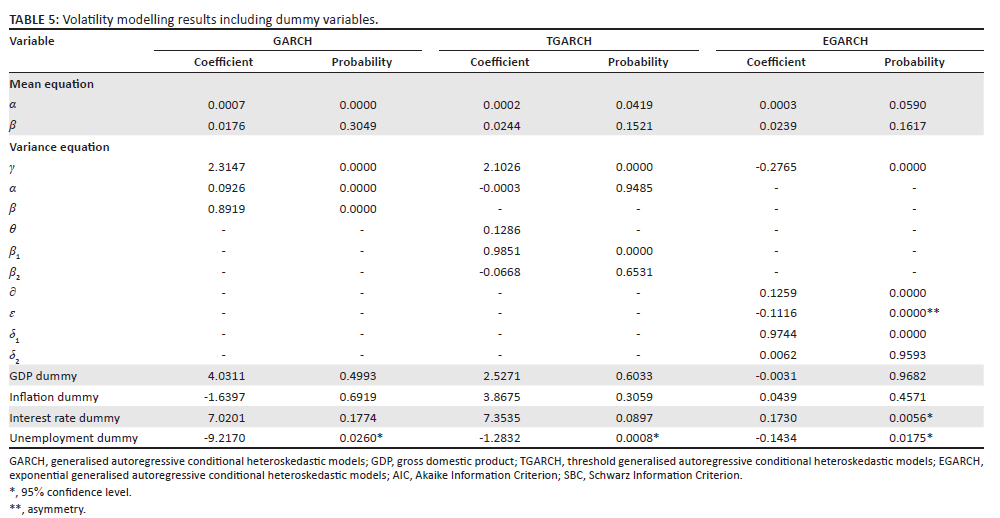
Table 3 presents the results obtained from the models. Table 4 excludes the dummy variables, whereas Table 5 includes these dummy variables.
Discussion
Generalised autoregressive conditional heteroskedastic model
The explanatory variables are presented in Table 5 (macroeconomic news announcements selected for this study). The only statistically significant variable (at a 5% level) is the unemployment variable - this study is consistent with the findings made by prior research (Cakan 2012; Cakan & Gupta 2017). This variable also contains a negative coefficient, meaning that the volatility created by the US unemployment news had a negative impact on the returns earned on the JSE. However, it is important to notice that good news and bad news were not differentiated in this study as it fell outside ofthe scope of this study - the statistically significant result obtained in Table 5 does not consider whether the announcement was good or bad news. The remaining variables have no impact given their statistical insignificance at a 5% level.
Threshold generalised autoregressive conditional heteroskedastic model
The explanatory variables in question are the macroeconomic news announcements selected for this study, namely GDP, inflation, interest rate and unemployment news announcements, presented in Table 5. The only statistically significant variable (at a 5% level) is the unemployment dummy variable. This variable also contains a negative coefficient, meaning that US unemployment news harmed the returns earned on the JSE. The remaining variables appear to have no impact given their statistical insignificance at a 5% level. The finding of unemployment having a statistically significant impact on the JSE aligns with research conducted by Cakan (2012) and Cakan and Gupta (2017). The significance of this is that there is a negative impact on the JSE when the US makes macroeconomic news announcements concerning unemployment numbers. From an investor perspective, these are days when the JSE was down and potential for exposure to the JSE to be purchased at a lower price. The findings regarding inflation having a statistically insignificant impact are contradictory to the results obtained by Cakan and Gupta (2017), in which inflation was found to have a statistically significant impact on the JSE. From a GDP perspective, the results of statistical insignificance confirm the results that were obtained by Gupta and Reid (2013). Finally, the interest rate announcement confirmed the results that were obtained by Hanousek and Kočenda (2011).
Exponential generalised autoregressive conditional heteroskedastic model
Similar to the EGARCH model excluding explanatory variables, the variable highlighted in Table 5 with the double asterisk (**) indicates that there are asymmetries present - bad news has a larger effect on the volatility than good news. The explanatory variables (dummy variables) in question are the macroeconomic news announcements selected for this study and are presented in Table 5. The news announcements that are statistically significant at a 5% level of significance are the interest rate and unemployment variables, respectively. The interest rate coefficient is 0.1730, and the p-value is 0.0000. The positive coefficient is indicative that the JSE reacted positively (market goes up) to interest rate news announcements - confirming the results that were found by Andritzky, Bannister and Tamirisa (2007). The unemployment variable has a coefficient of -0.1434 and a p-value of 0.0000 - this outcome is also in line with the TGARCH model. The negative coefficient is indicative that the JSE reacted negatively (market went down) to unemployment news announcements. Furthermore, the result of this study with regard to the unemployment announcement is in line with the results that were obtained in prior research (with statistically significant impact on the JSE), and is consistent with the research conducted by Cakan (2012) and Cakan and Gupta (2017). The finding made with regard to the interest rate announcement is also in line with the research conducted by Andritzky et al. (2007). Finally, the remaining variables (GDP and inflation) have no impact on the variance in the returns earned on the JSE, given their statistical insignificance. It is important to notice that the findings made with regard to the interest rate and unemployment are in line with the expected outcome of this study. The findings regarding GDP and inflation are insignificant to the returns of the JSE ALSI, which were not in line with the expected outcome - this could be because these announcements were already priced into the market, indicating an efficient market in that regard.
A total of four volatility models were constructed, namely ARCH (1), GARCH (1, 1), TGARCH (1, 2) and EGARCH (1, 2). Dummy variables were then applied to the variance equation of the various GARCH models to then determine the impact of the specified news announcements - these were subsequently evaluated. The dummy variables were in relation to GDP, inflation, interest rate and unemployment news announcements. In addition to the volatility modelling, an event study was conducted to determine the impact of the specified news announcement on the particular day on which the announcements were made.
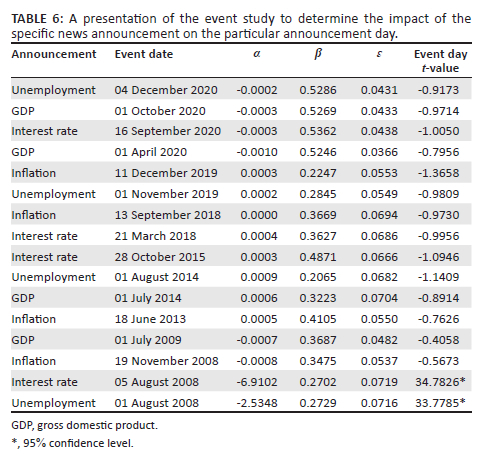
From a volatility modelling perspective, the announcements that had a statistically significant impact at a 5% level of significance were the unemployment announcements and the interest rate announcements - these findings are in line with the expected outcomes having a statistically significant impact. The remaining announcements (GDP and inflation) were found to not have a statistically significant impact on the JSE - these results do not confirm the expected outcomes. Asymmetries were also found to be present in the TGARCH and EGARCH models - meaning that bad news in relation to the announcements will have a larger impact on volatility than what good news will have. The event study presented in Table 6 determined that unemployment and interest rate announcements had a statistically significant impact on the JSE in August 2008 - this was during the global financial crisis, which is indicative of contagion because of the financial crisis. The remaining event days were not found to have a statistically significant impact on the JSE. Consequently, this is potentially indicative of an efficient market that already had this information priced into the market.
Conclusion
Even though macroeconomic news announcements are quite important to the country making the announcements, countries such as the US and its macroeconomic news announcements has a contagion effect because of globalisation. This spillover effect can be seen in emerging stock markets, such as the JSE of South Africa. This study sought to determine the impact that US macroeconomic news announcements have on the volatility of the JSE through the evaluation of various volatility models and an event study. This study contributes to the existing body of knowledge. Furthermore, the findings in terms of an emerging market will aid investment analysts and practitioners to take spillover effects of international news into account to make informed business decisions.
The results obtained from the volatility modelling established that the unemployment news from the US confirmed the contagion effect on the volatility of the JSE. Gross domestic product, inflation and interest rates were insignificant; therefore, no contagion effect could be established of those three news announcements. Apart from inflation, this study's results confirm the results from Cakan and Gupta (2017), contributing mostly towards generalisability of the study method. From an event study perspective, statistically significant results were obtained for unemployment and interest rate announcements made in August 2008. This fits the narrative of the financial crisis and the spillover effect during that time. The COVID-19 pandemic period did not show any significant proof of spillover effects from US macroeconomic news announcements. This was quite interesting, and it is possible that the global effect of the pandemic overshadowed the effect of the news announcements on the emerging market.
It is important to understand the benefit of these results to the investment professionals and policymakers. The results indicate that announcements made by the US concerning unemployment numbers had a statistically significant impact on volatility of the returns earned on the JSE. The results facilitate an understanding of the contagion effect, and indicated that US unemployment announcements is a factor that drives investment decisions in the JSE. These results should be used by investment industry professionals and policymakers to ensure that accurate volatility modelling is performed to enhance investment and policy decisions. Specifically, it has been determined that the JSE reacted negatively to announcements made in relation to unemployment and reacted positively to announcements made in relation to interest rates; it is of importance to investment industry professionals to calculate the volatility on the days in which these announcements are made. Volatility modelling is important to financial institutions from a financial risk management perspective following the financial crisis of 2008-2009 - understanding the impact of US unemployment and interest rate announcements on the JSE enables proper modelling of volatility and, therefore, stronger financial risk management.
The following list summarises recommendations for future research:
-
Evaluate news announcements from other nations on the JSE - an example would be that of China who has emerged as one of the largest economies in the world.
-
Investigate the impact of South African macroeconomic news announcements on the JSE.
-
In this article, asymmetries were present in the TGARCH and EGARCH models. However, this article did not differentiate between 'good' and 'bad' news. Differentiating between 'good' and 'bad' news events is a further enhancement that can be made to determine the impact of US macroeconomic news - that is, whether or not the announcement made was perceived to be 'good' or 'bad' news.
-
The immediate impact of these announcements on the JSE can be investigated with the use of tick data rather than an end-of-day closing values.
The significance of this study is the real-world implications for various investment industry professionals as well as policymakers by enhancing their knowledge on the impact that these US macroeconomic news announcements have on the volatility of the JSE and ultimately improve their risk management skills and policymaking decisions.
Acknowledgements
Competing interests
The authors declare that they have no financial or personal relationship(s) that may have inappropriately influenced them in writing this article.
Authors' contributions
The authors, C.A., I.B. and L.P. contributed to the development and writing of the article.
Funding information
This research received no specific grant from any funding agency in the public, commercial, or not-for-profit sectors.
Data availability
The data that support the findings of this study are available on request from the corresponding author, L.P., upon reasonable request.
Disclaimer
The views and opinions expressed in this article are those of the authors and do not necessarily reflect the official policy or position of any affiliated agency of the authors and the publisher.
References
Andritzky, J.R., Bannister, G.J. & Tamirisa, N.T., 2007, 'The impact of macroeconomic announcements on emerging market bonds', Emerging Markets Review 8(2007), 20-37. https://doi.org/10.1016/j.ememar.2006.05.001 [ Links ]
Bekaert, G.J. & Hodrick, R.J., 2014, International financial management, Pearson, Essex. [ Links ]
Belgacem, A., Creti, A., Guesmi, K. & Lahiani, A., 2015, 'Volatility spillovers and macroeconomic announcements: Evidence from crude oil markets', Applied Economics 47(28), 2974-2984. https://doi.org/10.1080/00036846.2015.1011316 [ Links ]
Cakan, E. & Gupta, R., 2017, 'Does the U.S. macroeconomic news make the South African stock market riskier?', The Journal of Developing Areas 51(4), 15-27. https://doi.org/10.1353/jda.2017.0085 [ Links ]
Cakan, E., 2012, 'The business cycle and impacts of economic news on financial markets', Journal of Business & Economics Research 10(6), 385-390. https://doi.org/10.19030/jber.v10i6.7029 [ Links ]
Cakan, E., Doytch, N. & Upadhyaya, K.P., 2015, 'Does U.S. macroeconomic news make emerging financial markets riskier?', Borsa Istanbul Review 5(1), 37-43. https://doi.org/10.1016/j.bir.2014.10.002 [ Links ]
Chen, N.F., Roll, R. & Ross, S., 1986, 'Economic forces and the stock market', The Journal of Business 59(3), 383-403. https://doi.org/10.1086/296344 [ Links ]
Christiansen, C. & Ranaldo, A., 2007, 'Realized bond - Stock correlation: Macroeconomic announcement effects', Journal of Futures Markets 27(5), 439-469. https://doi.org/10.2139/ssrn.746364 [ Links ]
Dimpfl, T., 2011, 'The Impact of US News on the German Stock Market - An event study analysis', The Quarterly Review of Economic and Finance 51(4), 389-398. https://doi.org/10.1016/j.qref.2011.07.005 [ Links ]
Ederington, L.H. & Lee, J.H., 1993, 'How markets process information: News releases and volatility', The Journal of Finance 48(4), 1161-1191. https://doi.org/10.2307/2329034 [ Links ]
Engle, R.F. & Ng, V.K., 1993, 'Measuring and testing the impact of news on volatility', The Journal of Finance 48(5), 1749-1778. https://doi.org/10.3386/w3681 [ Links ]
Engle, R.F., & Patton, A.J. 2001, 'What good is a volatility model?', Quantitative Finance 1, 237-245. https://doi.org/10.1088/1469-7688/1/2/305 [ Links ]
Gupta, R. & Reid, M., 2013, 'Macroeconomic surprises and stock returns in South Africa', Studies in Economics and Finance 30(3), 266-282. https://doi.org/10.1108/SEF-Apr-2012-0049 [ Links ]
Hanousek, J. & Kočenda, E., 2011, 'Foreign news and spillovers in emerging European Stock Markets', Review of International Economics 19(1), 170-188. https://doi.org/10.1111/j.1467-9396.2010.00939.x [ Links ]
Joshi, P. & Pandya, K., 2012, 'Volatility in Stock Markets of India and Canada', The IUP Journal of Applied Economics 11(4), 72-79. [ Links ]
Kao, Y.S., Zhao, K., Ku, Y.C. & Nieh, C.C., 2019, 'The asymmetric contagion effect from the U.S. stock market around the subprime crisis between 2007 and 2010', Economic Research-Ekonomska Istraživanja 32(1), 2422-2454. https://doi.org/10.1080/1331677X.2019.1645710 [ Links ]
Maserumule, T. & Alagidede, P., 2017, 'Impact of macroeconomic announcements on foreign exchange volatility: Evidence from South Africa', South African Journal of Economics 85(3), 405-429. https://doi.org/10.1111/saje.12160 [ Links ]
Nadler, D. & Schmidt, A.B., 2016, 'Impact of macroeconomic announcements on US equity prices: 2009-2013', Journal of Forecasting 35(1), 34-42. https://doi.org/10.1002/for.2359 [ Links ]
Petralias, A. & Dellaportas, P., 2015, 'Volatility prediction based on scheduled macroeconomic announcements', The Canadian Journal of Statistics 43(2), 199-223. https://doi.org/10.1002/cjs.11247 [ Links ]
Salahuddin, M., Vink, N., Ralph, N. & Gow, J., 2019, 'Globalisation, poverty and corruption: Retarding progress in South Africa', Development Southern Africa 37(1), 1-27. https://doi.org/10.1080/0376835X.2019.1678460 [ Links ]
Sarwar, G., 2019, 'Transmission of risk between US and emerging equity markets', Emerging Markets Finance and Trade 55(5), 1171-1183. https://doi.org/10.1080/1540496X.2018.1468248 [ Links ]
Smales, L.A., O'Grady, B. & Yang, Y., 2015, 'Examining the impact of macroeconomic announcements on gold futures in a VAR-GARCH framework', Applied Economics Letters 22(9), 710-716. https://doi.org/10.1080/13504851.2014.972538 [ Links ]
 Correspondence:
Lydia Pelcher
lpelcher@uj.ac.za
Received: 16 Mar. 2023
Accepted: 01 Aug. 2023
Published: 27 Sept. 2023

