


Services on Demand
Article
 English (pdf)
 Article in xml format
 Article references
Indicators

Related links
-
 Cited by Google
 -
 Similars in Google
Share

 Permalink
Acta Commercii
On-line version ISSN 1684-1999
Print version ISSN 2413-1903
Acta Commer. vol.21 n.1 Johannesburg 2021
http://dx.doi.org/10.4102/ac.v21i1.882
ORIGINAL RESEARCH
The trend and composition of payout methods over a period of tax reform: Evidence from JSE-listed companies
Rudie NelI; Nicolene WessonII
ISchool of Accountancy, Faculty of Economic Management Sciences, Stellenbosch University, Stellenbosch, South Africa
IIStellenbosch University Business School, Stellenbosch University, Stellenbosch, South Africa
ABSTRACT
ORIENTATION: This study investigated the trend and composition of total payout distributed by companies listed on the Johannesburg Stock Exchange (JSE) over a period of tax reform.
RESEARCH PURPOSE: The aim was to investigate whether the payout methods post-2012, after the introduction of dividends tax, differed from pre-2012.
Motivation for the study: Tax-related dividend literature predominantly explores the implications of differential taxes on dividends and of capital gains on dividends with a limited focus on total payout. The setting to investigate the total payout of JSE-listed companies is also unique as a result of South African tax reform.
RESEARCH DESIGN, APPROACH AND METHOD: Descriptive statistics and a mixed-model analysis of variance were employed to describe the payout methods (dividends, capital distributions, additional shares and share repurchases) in rand value and frequency of election. The population comprised of 116 JSE-listed companies for the financial reporting periods 2006-2018.
MAIN FINDINGS: Ordinary dividends increased post-2012 whilst other payout, except for additional shares, decreased post-2012. An increase in scrip dividends (additional shares with a cash alternative) post-2012 confers flexibility to shareholders to manage their own financial needs, including tax considerations.
PRACTICAL/MANAGERIAL IMPLICATIONS: The policy implication is that the increasing use of ordinary dividends as a payout method could inform future government initiatives to generate revenue or provide tax incentives for saving.
CONTRIBUTION/VALUE-ADD: Submitted as the first article to investigate total payout of JSE-listed companies over a period of tax reform to provide evidence that payout policies adjusted based on the differential tax on dividends and capital gains.
Keywords: dividends tax; capital gains tax; tax reform; payout method; dividend; capital distribution; additional shares; share repurchase.
Introduction
The introduction of dividends tax in South Africa during 2012 resulted in the possibility of tax arbitrage arising for the first time as exemption is only afforded to certain shareholders (Marcus & Toerien 2014:100). Diverse shareholding in companies could then result in conflicting tax preferences amongst different shareholders. Investigating how companies respond when faced with the conflicting tax preferences of shareholders can be of interest to researchers of taxation, researchers of corporate governance, investors, regulators and those charged with fiscal responsibility (Badenhorst 2017:103).
Global literature on the effect of taxes on payout policies predominates in the United States of America and lacks emphasis in other countries (Baker & Weigand 2015; Geiler & Renneboog 2015; Jacob & Jacob 2013). A gap in literature on the effect of taxes on payout policies in developing economies in sub-Saharan Africa is also evident (Arko et al. 2014). Tax reform by means of a change in tax regimes provides the opportunity to study the responses of companies and investors to such tax regime changes (Korkeamaki, Liljeblom & Pasternack 2010). Since 2011, tax reform in South Africa has offered a unique tax reform setting occasioned by the reform introduced by the Income Tax Act, No. 58 of 1962 (Republic of South Africa 1962), hereafter referred to as 'the Act'. South African tax reform includes a change in tax regime as a result of the introduction of dividends tax and increases in applicable tax rates that emphasises the conflicting tax preferences of different shareholders (Nel 2018). The differential rate between dividends tax and capital gains tax (CGT) could also motivate the tax preferences for different payout methods (Nel 2018). Investigating how the supply of dividends is affected by the differential taxation of dividends versus capital gains is submitted as a promising avenue for research (Farre-Mensa, Michaely & Schmalz 2014:103). A focus on companies listed on the Johannesburg Stock Exchange (JSE) contributes to the unique setting owing to tax reform during 2011 that resulted in general share repurchases by JSE-listed companies no longer being regarded as a 'dividend' for tax purposes. The setting in South Africa thus provides an opportunity to contribute to literature by investigating the trend and composition of payout methods over a period of tax reform.
Tax-related literature on dividends explores the implications of differential taxes on dividends and capital gains on the valuation of stocks and the propensity of companies to pay out cash dividends (Allen & Michaely 2003:358). Finance literature in general analyses the payout policy question, using only a narrow definition of dividend payout, with most studies not addressing the issue of total payout or the composition of the payout (Allen & Michaely 2003). Share repurchases could serve as a substitute payout method for cash dividends in order to maximise the after-tax return of the shareholders (Alzahrani & Lasfer 2012). Additional shares could also serve as a substitute for cash dividends in cash-strapped companies or financially constrained companies that wish to preserve cash (Feito-Ruiz, Renneboog & Vansteenkiste 2018; Lasfer 1997). South African literature has shown increases in dividends from 2012 to 2014 (Nyere & Wesson 2019), however, does not consider the effect of increased dividends in relation to other payout methods. Investigating whether the increased dividends are accompanied by a decrease in other payout methods could provide an insight into how companies have responded when faced with conflicting tax preferences since the introduction of dividends tax. Considering the trend and composition of total payout could also provide an insight into the possible substitution of payout methods. A dividend payout subject to dividends tax could be substituted by another payout method subject to CGT in order to minimise the taxes payable by a shareholder. Conversely, a payout method subject to CGT could be substituted by a dividend payout in order to afford an exemption from dividends tax to minimise the taxes payable by a shareholder. Consequently, this study considered dividends, capital distributions, additional shares and share repurchases as payout methods in a South African context.
The objective of this study was to investigate whether the trend and composition of payout before and after the introduction of dividends tax in 2012 differed. The focus was on two sub-periods surrounding 2012, namely the 6-year period from 2006 to 2011 (hereafter referred to as 'pre-2012') and the 6-year period from 2013 to 2018 (hereafter referred to as 'post-2012'). This study contributes to literature in three respects. Firstly, being the first study to investigate the trend and composition of the total payout in a South African context. Secondly, expanding on existing dividends and share repurchases databases in respect of which data are not readily available on any commercial database. Thirdly, compiling a database of the total payout of listed companies consisting of dividends, capital distributions, share repurchases and additional shares, which could serve as the basis for future research.
Literature review
Literature on payout methods (dividends, capital distributions, additional shares and share repurchases) in a South African setting is explored in order to provide an overview of the existing trend in the payout methods documented. The tax implications of payout methods are also scrutinised in order to formulate propositions in respect of the trend and composition of payout based on tax reform.
Dividends
Dividends have been noted to be on the increase from 2012 to 2014 in South African literature (Badenhorst 2017; Nyere & Wesson 2019). Based on the relationship between dividend payout ratios and subsequent growth of earnings from 1960 to 2014, the introduction of dividends tax largely coincided with a period of increased dividend payout ratios (Montgomery 2015). The offsetting of an secondary tax on companies (STC) credit, from the previous tax regime, under the dividends tax regime would have resulted in dividends not being subject to dividends tax in a particular year and consequently increase the dividends received by shareholders (Coetzee & De Wet 2014). Offsetting STC credits could have encouraged increased dividends during the 3 years after the introduction of dividends tax to benefit shareholders subject to dividends tax.
The introduction of dividends tax is also argued as beneficial in particular to corporate, foreign and fund shareholders. Corporate (company) shareholders have been found to have sufficient influence to align the dividend policies of their investees with their tax preferences for dividends (Badenhorst 2017). Foreign investors were also likely to benefit from dividends tax because of the possible application of relief in terms of the Double Tax Agreement (Venter 2014). Fund shareholders (institutional investors, as defined by the JSE [2016]) would have benefited from a dividends tax exemption not afforded previously, which could have served as further stimulus for retirement savings (Filen 2011). The dividends tax exemption afforded could have further encouraged the use of dividends as a payout method during the post-2012 period.
Owing to the different labelling of special dividends, shareholders might perceive special dividends as once-off payments and will not expect a similar payment during the next period (Andres et al. 2015:66). The flexibility hypothesis also suggests that ordinary dividends are used to disburse permanent earnings and that more flexible payout methods (special dividends and share repurchases) are used to disburse transitory earnings (Andres et al. 2015). The flexibility of special dividends could also extend to a tax context as the use of special dividends has been noted as a means of accelerating dividend declarations between different tax periods (Hanlon & Hoopes 2014). However, there could be commercial reasons for special dividends that are unrelated to tax such as large restructurings or divestments by companies (Bird 2013:95). Special dividends as a result of unbundling transactions could also qualify for s. 46 of the Act, which affords roll-over relief for taxpayers resulting in the deferral of normal tax consequences in respect of the disposal of assets and could result in no dividends tax being payable. Special dividends as result of unbundling transaction is thus excluded in this study as specific tax relief could apply. Special dividends not related to unbundling transactions would still afford a dividends tax exemption to corporate and institutional shareholders and could have further encouraged the use of such special dividends as a payout method during the post-2012 period.
The expectation was, therefore, that dividends (ordinary and special) post-2012 would be higher than dividends pre-2012 (proposition 1). Retention rates calculated as retained earnings divided by dividends would be influenced by dividends distributed. The expectation was that retention rates of companies post-2012 would be lower than pre-2012 as a result of expected increases in dividends post-2012 (proposition 2).
Capital distributions
Capital distributions represent a return of stated capital (share capital or share premium) to shareholders.
Shareholders, however, have no legal right to a return of capital invested in a company (Van der Linde 2008:8). Capital distributions are thus submitted as a payout method based on a return of capital invested, which is not guaranteed, and continued participation in future dividends if share capital is not reduced. A capital distribution would not be subject to dividends tax if nominated from contributed tax capital but subject to CGT if held with capital intent by the shareholder. Based on consecutive increases in applicable tax rates, the preference for a payout method not subject to dividends tax could be expected to decline (Nel 2018). Share premium distributions by JSE-listed companies were noted as decreasing from 2011 to 2014 and as nominal in relation to dividends distributed from profits over the period 1999-2014 (Nyere & Wesson 2019:9). The trend of decreasing capital distributions was expected to continue after 2014 because of increases in the effective rate of CGT and an exemption from dividends tax forfeited by corporate and fund shareholders. The expectation was that capital distributions post-2012 would be lower than capital distributions pre-2012 (proposition 3).
Additional shares
Additional shares as a payout method could occur in the case of a capitalisation issue or a scrip dividend. A capitalisation issue entails shareholders receiving additional shares, whereas a scrip dividend provides shareholders with the option to elect cash instead of additional shares. Allowing shareholders to choose between cash dividends and shares could be perceived more positively by shareholders than merely reducing dividends (David & Ginglinger 2016). As an incentive for shareholders to elect the shares, the value of the additional shares based on the share price would typically be higher than the cash offer (Oosthuizen 2009:3). Scrip dividends also empower shareholders to decide between a cash dividend (subject to dividends tax) or additional shares (subject to CGT if held with capital intent) to maximise their own after-tax receipts. The expectation was that the value of additional shares issued in terms of scrip dividends during the post-2012 period would be higher than the pre-2012 period (proposition 4).
Share repurchases
Wesson, Hamman and Bruwer (2015) submitted the first comprehensive study on the full extent of share repurchases in South Africa for the period 1999-2009 and reported that share repurchases by JSE-listed companies have become popular since 2005. Dividends were still noted as the preferred payout method but showed a lower growth rate than share repurchases over the target period of 1999-2009 (Wesson et al. 2015:52). The inherent payout flexibility of share repurchases over cash dividends has been observed (Wesson et al. 2018), and that share repurchases could serve both substitute and complementary roles where cash dividends are concerned (Munzhelele 2019:124).
A distinction between the two share repurchase types (i.e. general and specific) from a tax perspective is necessary because of different tax treatments as a result of tax reform during 2011 (Nel 2018). Since 2011, general repurchase (or open-market repurchase) of shares would not constitute a dividend resulting in no dividends tax exemption being available to corporate or fund shareholders (Nel 2018). As a result, the tax preference of corporate and fund shareholders for dividends could have discouraged the use of general repurchases as a payout method. The expectation was that general share repurchases post-2012 would be lower than general repurchases pre-2012 (proposition 5).
Specific share repurchases target specific shareholders compared with a general share repurchase on the open market (Nel 2018). Specific share repurchases would still constitute dividends to the extent that contributed tax capital is exceeded (Nel 2018). Specific share repurchases from subsidiaries (also referred to as the repurchase of treasury shares) are a type of share repurchase that provides a unique setting to study in South Africa (Wesson & Hamman 2012). The popularity of share repurchases conducted via subsidiaries (and the subsequent repurchase by the holding company from the subsidiaries) has resulted in general share repurchases not being the outright favourite share repurchase type in South Africa (Wesson et al. 2015:52). A treasury share structure can subsequently be unwound if the subsidiary (or share trust) disposes of or distributes the treasury shares previously acquired to the holding company. Tax reforms introduced during 2007 not only broadened the base of taxable dividends but also removed opportunities perceiving tax-avoidance relating to the unwinding of existing treasury share structures (Marcus & Gore 2008; South African Revenue Service 2008). Despite the tax reform introduced during 2007, specific share repurchases from subsidiaries for the period 1999-2009 were still found to be a method used extensively by JSE-listed companies (Wesson & Hamman 2012:35). As specific repurchases are included as dividends, a resident subsidiary could qualify for an exemption from dividends tax since 2012. Specific repurchases from subsidiaries could have been deferred until the introduction of dividends tax in order to utilise the dividends tax exemption being afforded. The expectation was, therefore, that specific share repurchases from subsidiaries post-2012 would be higher than such specific repurchases pre-2012 (proposition 6). Specific repurchases not from subsidiaries would also result in a dividends tax exemption being available to corporate and fund shareholders. The expectation was, therefore, that specific share repurchases not from subsidiaries post-2012 would also be higher than such specific repurchases pre-2012 (proposition 7).
Based on the tax reform, this study posits seven propositions in respect of the trend and composition of the total payout of JSE-listed companies:
-
Dividends (ordinary and special) post-2012 would be higher than pre-2012.
-
Retention rates post-2012 would be lower than pre-2012.
-
Capital distributions post-2012 would be lower than pre-2012.
-
Additional shares issued in terms of scrip dividends post-2012 would be higher than pre-2012.
-
General share repurchases post-2012 would be lower than pre-2012.
-
Specific share repurchases from subsidiaries post-2012 would be higher than pre-2012.
-
Specific share repurchases not from subsidiaries post-2012 would be higher than pre-2012.
Confounding factors in payout behaviour
The present study was descriptive in nature as the aim was to describe the movement in total payout of selected JSE-listed companies. Tax as an explanation for changes in the trend and composition of payout is then submitted based on propositions relating to tax reform. The study also included consideration of three confounding factors in payout behaviour, namely profitability, company size and macroeconomic conditions, which could explain payout behaviour. If these three confounding factors explain payout behaviour, a tax explanation for payout behaviour is submitted as less warranted.
Profitability
High accounting profit, measured by return on assets (ROAs), is submitted as a prerequisite for payout earnings by different payout channels (Geiler & Renneboog 2015). More profitable companies, based on ROA, have been found to consistently pay higher dividends (Badenhorst 2017:7; Nyere & Wesson 2019:13). In investigating the trend and composition of payout methods, higher profitability could explain higher payout. This study included ROA as a measure of profitability in investigating the trend and composition of total payout by JSE-listed companies.
Company size
It has been found that the size of a company is negatively correlated with payout flexibility and that larger South African companies distribute a lower fraction of payout as share repurchases than smaller companies (Munzhelele 2019). Share repurchases in South Africa during the period 1999-2009 were found to be dominated by smaller companies that repurchased shares more frequently, whilst a few large companies dominated the share repurchase value (Wesson et al. 2015:52). In investigating the trend and composition of total payout, company size could explain a change in payout from the pre-2012 to the post-2012 period. According to the JSE (2019) large companies have a market capitalisation exceeding R10 billion; medium-sized companies have a market capitalisation exceeding R1 bn but not more than R10 bn and small companies have a market capitalisation below R1 bn. This study acknowledged the implication of company size and controlled for company size by including companies from all three size categories based on the classification according to JSE (2019). The aim of the study was to describe the payout of companies of all size categories before and after 2012 and not to focus solely on companies from only one size category.
Macroeconomic conditions
Macroeconomic conditions could explain why payout behaviour during a particular period differs from other periods. This study included consideration of the macroeconomic conditions in South Africa during the two sub-periods before and after 2012. Macroeconomic conditions, such as a recession or a global financial crisis, during only one of the sub-periods could explain why payout behaviour during sub-periods differed unrelated to tax. The study did not include a detailed assessment of macroeconomic conditions during each sub-period, but rather investigated whether economic growth, the occurrence of a recession or a global financial crisis differed during each of the two sub-periods being compared.
Methodology and data description
Population
The population of this study comprised JSE-listed companies with reporting periods covering the years 2006-2018. Companies were selected based on the following criteria: (1) companies with listed ordinary and/or N-class shares, (2) companies with their primary listing on the JSE, (3) companies listed on the JSE main board and not in the resources and finance sectors and (4) companies listed during the full duration of the period 2009-2015. Companies listed in the resources and finance sectors were excluded owing to unique accounting policies regarding capital investments and financing (Graham 1999; Wesson et al. 2018). Only companies that were listed from 2009 to 2015 were included in order to provide data on companies listed at least 3 years before and after the introduction of dividends tax. Companies that delisted after 2015 were still included to eliminate potential survivorship bias (Mans-Kemp & Viviers 2015). In total, 116 companies were included in the population consisting of 33 large companies, 43 medium-sized companies and 40 small companies based on market capitalisation during 2012.
Method
This study followed an empirical research design in which secondary numerical financial data were analysed. This study was descriptive in nature as it was concerned with how the payout methods differed before and after the introduction of dividends tax. The trend of payout contemplated in this study referred to movement in each respective payout method over a period. The composition of payout contemplated referred to the contribution of each payout method to total payout. The trend and composition of payout were analysed in rand value, as well as in the frequency of electing payout methods as employed in previous studies (Geiler & Renneboog 2015:180; Lie & Lie 1999:540).
Data collection
Total payout in this study comprised dividends, capital distributions, additional shares and share repurchases. Total payout data were primarily compiled by the expansion and consolidation of an existing dividend database (Nyere & Wesson 2019) and share repurchase database (Steenkamp & Wesson 2020). Following the data collection method described in the previous studies, data were collected from disclosed annual financial statements and announcements via the Security Exchange News Service (SENS). The retention rates and ROA of companies were obtained from the IRESS database (product called Financial Ratios Search).
The dividend database of Nyere and Wesson (2019) was expanded in four respects: (1) capturing the data of selected companies for the 2015-2018 financial years, (2) including an adjustment to account for the actual final dividend during each year, (3) including additional shares issued as scrip dividends and (4) capturing the reasons for special dividends in order to exclude special dividends as result of unbundling transactions. Dividends disclosed in terms of IAS 10 Events after the reporting period (IASB 2018) would not include final dividends if declared after year-end. Dividends collected by Nyere and Wesson (2019) were thus adjusted to include the final dividend in respect of each year if declared after year-end. The present study applied the actual dividends relating to each year in investigating the trend and composition over different years. Additional shares issued by companies as scrip dividends or capitalisation shares were collected from financials and represented a decrease in retained earnings and a corresponding increase in the stated capital (share capital and share premium) in the statement of changes in equity. The reduction in retained earnings was classified as additional shares as payout method if described as scrip dividend, capitalisation shares, capitalisation issues or bonus issues in financials. If a portion of additional shares was funded from stated capital (and not retained earnings), this portion was not regarded as a payout method, as the shareholder's own equity capital is reclassified and no earnings are distributed. In order to corroborate additional shares, data collected from financials of companies and SENS announcements were also consulted as the JSE Listing Requirements prescribe mandated announcements in respect of scrip dividends and capitalisation shares (JSE 2017; Listing Requirements, para. 7.C.15). Based on the reasons for special dividends a total of 13 special dividends to the value of R112 bn were identified as relating to unbundling transactions and are excluded from the present study. The special dividends excluded consisted mainly of the largest special dividend of R93.3 bn noted in respect of one company (Bidvest Group Limited 2016:92).
Share repurchases data collection followed the method as described by Steenkamp and Wesson (2020). The method entailed the reconciliation of the number of shares in issue; scrutinising financials (the directors' report, statement of changes in equity, share capital note and shareholder spread); and searching SENS announcements. This study expanded on the existing share repurchase database of Steenkamp and Wesson (2020) by capturing the data of selected companies for the 2018 financial reporting periods.
Data analysis
Data analysis was performed by means of descriptive statistics and a mixed-model analysis of variances (ANOVA). Descriptive statistics were analysed based on the value of payout methods (in real terms), as well as the frequency of electing payout methods during the respective sub-periods. In the analyses, a zero value for a respective payout method during a year was dealt with as a zero value and not disregarded. As the objective of this study was to investigate the trend in total payout for the selected companies, a zero value in respect of a payout method had meaning as a company could possibly have elected any of the payout methods during a year. Payout values were represented in 2006 terms by applying the deflation factors calculated from the consumer price index published by Statistics South Africa (2017).
In respect of the trend in payout, a mixed-model ANOVA was employed to investigate whether the rand value of different payout methods post-2012 differed significantly from the rand value of different payout methods pre-2012. Box-Cox transformation was applied to all variables for the purposes of the mixed-model ANOVA. The Box-Cox transformation represents a potential best practice, where normalising data or equalising variance is desired and which incorporates, extends and improves on traditional normalising approaches (Osborne 2010:1). Normal probability plots for each variable were then inspected and it was found that only the retention rate variable needed adjustment for outliers. The retention rate variable (winsorised) was calculated on the basis of a robust method of calculating the standard deviation (namely, the median absolute deviation method) and the mean (by using the Huber method) and replacing each of the outliers with a value representing three times the calculated standard deviation plus the calculated mean. Fisher's least significant difference (LSD) post hoc test was then applied to determine whether the variables differed statistically significantly between the two sub-periods. Fisher's LSD test is considered suitable for comparing two means that refer to a pairwise comparison (Williams & Abdi 2010:1). The results of the LSD test were interpreted on the basis of the sign, representing the movement in the mean of each variable, and not in absolute terms.
The significance of the movement in each variable was evaluated using F-statistics and the calculated probability (p-value) for each variable by applying a 10% significance level (p <0.10 was regarded as significant).
Descriptive statistics
Total payout in respect of the different payout methods was R820 bn (in nominal terms) for the period 2006-2018 for the companies selected. The nominal values, real values (adjusted for inflation) and the percentage of each payout method (in real terms) are submitted in Table 1.
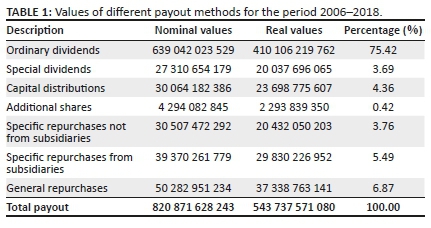
Ordinary dividends represented a three-quarter majority (in real terms) of total payout and payout methods other than ordinary dividends represented the remaining quarter of total payout during the period 2006-2018. Based on the total value of payout, ordinary dividends were identified as the most preferred payout method. When investigating whether the preference for payout methods changed during the period, the year-to-year trend and composition of payout over the period were considered. The annual values in real terms of ordinary dividends and payout methods other than ordinary dividends over the period 2006-2018 are presented in Figure 1.
From Figure 1, it is observed that the value of ordinary dividends exceeded the value of other payout methods since 2008. A notable increase in ordinary dividends from 2011 to 2014 is evident, compared with payout other than ordinary dividends, which did not show the same notable increase. The total annual payout of the selected companies peaked during 2014 at R55 bn, followed by 2015 (approximately R52 bn). The total annual payout was the lowest during 2010, which could possibly be attributed to a lagged effect because of the global financial crisis of 2008 (Nyere & Wesson 2019:9) and again notably decreased in 2016. The South African economy ground to an apparent halt during 2016, with the country's central bank expecting 0% growth (KPMG 2016). Furthermore, the highest unemployment rate in more than a decade, which registered at 26.7% during the first quarter of 2016, and high consumer price inflation resulted in the South African Reserve Bank increasing interest rates (KPMG 2016). The resulting low economic growth, high unemployment and a strained fiscus also evolved into a political crisis (Mthanti 2017). The political and economic uncertainty could explain the lower payout noted since 2016. Poor macroeconomic conditions evident in each of the sub-periods could explain lower payout during the respective years. However, the pre-2012 period had a mean change in annual gross domestic product of 3.15% compared with 1.35% in the post-2012 period (World Bank 2020). Despite lower real economic growth during the post-2012 period, higher payout still occurred compared with the pre-2012 period.
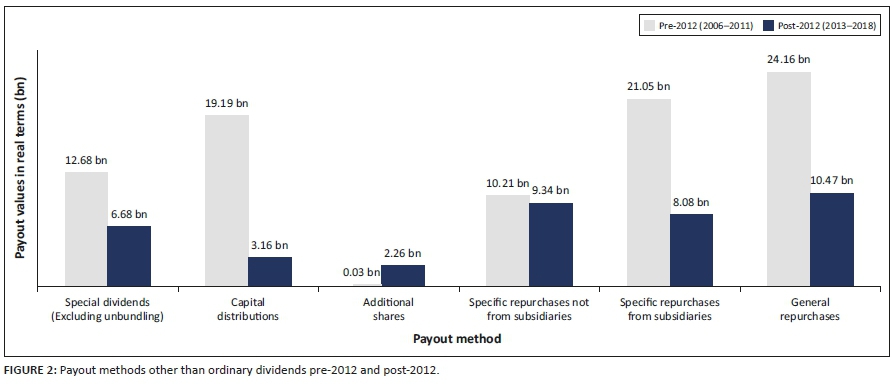
Based on annual payout values for the period 2006-2018, the trend in payout identified is that ordinary dividends increased, whereas payout methods other than ordinary dividends decreased over the period. The payout methods other than ordinary dividends consist of different payout methods and should be disaggregated in order to investigate the trend in the respective payout methods. The values (in real terms) of payout methods other than ordinary dividends are illustrated in Figure 2.
Most notable from Figure 2 is the fact that all payout methods, except for additional shares, decreased during the post-2012 period. Additional shares increased in value during the post-2012 period but represented the lowest value of all payout methods. The decrease in the value of capital distributions was (R16.02 bn) noted as the highest decrease followed by a decrease in general repurchases (R13.69 bn). The trend and composition of payout are observed to have changed during the post-2012 period in two respects. Firstly, all payout methods other than dividends, except for additional shares, decreased in the value whereas dividends during the post-2012 period increased. Secondly, there was an increase in the value of additional shares, although this value was noted as the lowest value of all payout methods.
In addition to the movement in values, the frequency of electing a payout method also allows for inference of the increased or decreased activity in respect of a payout method. An increase (decrease) in frequency of electing a payout method could be indicative of more (less) companies electing a payout method during a financial reporting period or individual companies electing a payout method in more (fewer) financial reporting periods. The movement from the pre-2012 period to the post-2012 period in the frequency and the value of payout methods is provided in Table 2. The movement in the value of ordinary dividends (68.8%) is supported by an increase in the frequency of electing ordinary dividends (3.9%) as a payout method during the post-2012 period. The increase in the value of ordinary dividends post-2012, which exceeds the increase in the frequency, suggests that companies that elected ordinary dividends during the pre-2012 period increased the value of their ordinary dividends post-2012. Contrary to the increase in the value of ordinary dividends, a decrease in the value of payout methods other than ordinary dividends (54.2%) during the post-2012 period is evident. The increase in total payout (21.3%) during the post-2012 period was, therefore, driven by ordinary dividends rather than other payout methods.
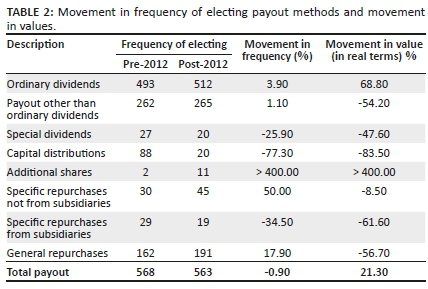
The movements in value and frequency of electing payout methods other than ordinary dividends during the post-2012 period also differed when based on individual consideration of each payout method. The decrease in the frequency of electing special dividends, capital distributions and specific repurchases from subsidiaries in the post-2012 period supports the observed decrease in the value of these payout methods post-2012. The frequency of electing additional shares as a payout method increased more than fourfold post-2012 and supports the increase in value of the payout method post-2012. Only one company, Mix Telematics Limited (2008:22), was noted to have issued capitalisation shares with no cash alternative funded from retained earnings, which represented less than 0.05% of total value of additional shares collected as payout method. Additional shares issued post-2012 were, based on value of additional shares, noted to have a cash alternative. An evident preference for issuing additional shares as a payout method using scrip dividends (i.e. with a cash alternative), as opposed to a capitalisation issue with no cash alternative, was therefore noted in the post-2012 period. The inclusion of a cash alternative affords shareholders the opportunity to elect either cash dividends (considered for dividends tax) or additional shares (considered for CGT if held with capital intent). This finding supports the flexibility of scrip dividends as a payout method and the increased use of this payout method post-2012. Despite the frequency of electing specific repurchases not from subsidiaries and general repurchases increasing during the post-2012 period, the value of these payout methods decreased during the post-2012 period.
The composition of total payout refers to the different payout methods that contributed to total payout. Investigating the frequency of payout methods selected - and whether companies elected one or more payout methods - would provide supporting evidence on payout behaviour of companies during the pre-2012 and post-2012 period. The frequency of electing only one payout method or more than one method is provided in Table 3. The frequency of electing only one payout method decreased for most of the payout methods during the post-2012 period and the election of more than one payout method increased.
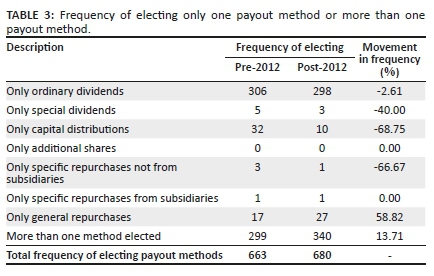
Electing only ordinary dividends was the single payout utilised most during both the pre-2012 and post-2012 periods. Payout methods during the post-2012 period was not focused on the use of only one payout method but focused more on the use of a combination of payout methods. On this premise, the composition of payout is submitted to have changed post-2012 on the basis of the frequency of electing only one payout method or more than one payout method.
The only increase in frequency of electing only one payout method was in respect of general repurchases. Despite the increase in electing only general repurchases of 58.8%, the value of general repurchases decreased by 56.7% (Table 2), which could suggest that although general repurchases were applied more frequently as the only payout method post-2012, the value of payout returned as general repurchases decreased. An increase in the frequency could be explained by the flexibility of share repurchases, which could entail companies rather repurchasing shares in smaller values instead of paying dividends in periods of low economic growth. The decrease in the value of general repurchases is, however, still submitted as indicative of the trend and composition of payout over the period, as it represents the value distributed to shareholders as a payout method.
Based on descriptive statistics, an increase in the value of ordinary dividends is evident for the post-2012 period, with no corresponding increase in the value of payout methods other than dividends (except for additional shares) noted for the same period. The statistical significance of the movement in values was considered by means of a mixed-model analysis of variance (ANOVA) described in the following section.
Analysis of variance
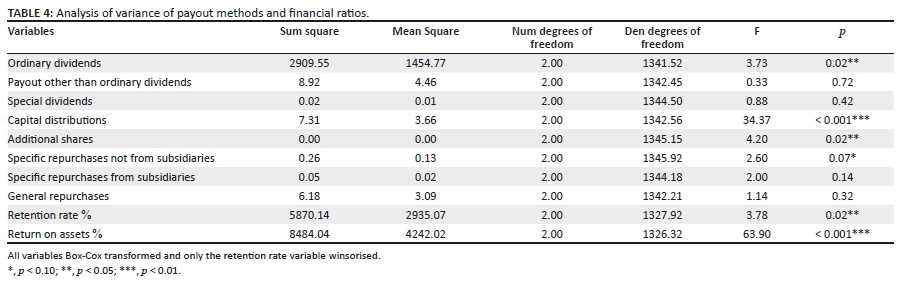
The statistical ANOVA was concerned with the means of the variables of the payout methods (values in real terms), retention rates and ROA of selected companies. The analysis was performed to investigate whether the means of each variable differed significantly during the target period of the study (2006-2018) and between the two sub-periods of pre-2012 and post-2012. Fisher's LSD post hoc test was employed to analyse whether the two sub-periods differed significantly by comparing the mean of each variable for each period. A precondition for Fisher's LSD test to be performed was that the ANOVA omnibus F-test should be significant (Williams & Abdi 2010:1). The ANOVA omnibus F-tests in respect of all periods considered in this study (2006-2018) are provided in Table 4.
The ANOVA confirmed a statistically significant movement in ordinary dividends over the period 2006-2018. When payout methods other than ordinary dividends were aggregated, no statistically significant movement over the period was noted. Based on the composition of payout, increases in ordinary dividends are submitted as statistically significant, whereas the aggregate of payout methods other than ordinary dividends had no statistically significant movement.
Payout methods other than ordinary dividends should, however, be disaggregated and the movement in the respective payout methods considered for purposes of the precondition of the LSD post hoc test. In respect of special dividends, specific repurchases from subsidiaries and general repurchases, the ANOVA indicated no statistically significant movement over the different periods, thus the precondition of the LSD post hoc test was not satisfied. The notable decrease in the value (in real terms) of specific repurchases from subsidiaries and general repurchases, observed in Figure 2, is not submitted as statistically significant based on the ANOVA. In respect of ordinary dividends, capital distributions, additional shares, specific repurchases not from subsidiaries, retentions rates, and ROA, the precondition of the LSD post hoc test was satisfied. An analysis of the movement between the pre-2012 and post-2012 period was possible, the results of which are provided in Table 5.
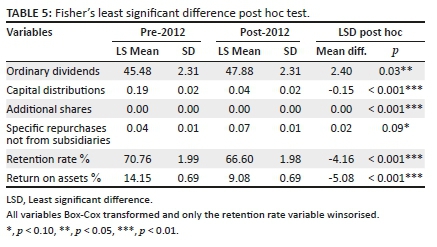
Based on the LSD post hoc test, the value of ordinary dividends, additional shares and specific repurchases not from subsidiaries was significantly higher during the post-2012 period, whereas the value of capital distributions was significantly lower during the post-2012 period. The retention rates and ROA of companies were also found to be significantly lower during the post-2012 period. The lower retention rates during the post-2012 period could have been expected owing to the higher ordinary dividends noted for the post-2012 period. Based on higher ordinary dividends during the post-2012 period, higher profitability was to be expected; however, based on ROA, lower profitability was noted during the post-2012 period. On this premise, profitability is not submitted as the main confounding factor for the increase in ordinary dividends during the post-2012 period, consequently providing an opportunity for the argument of a possible tax explanation for the increase in ordinary dividends.
Concluding on propositions based on tax reform
Proposition 1 in respect of ordinary dividends is supported as a statistically significant increase in value and an increase in the frequency of election was observed during the post-2012 period. Contrary to expectation, special dividends not linked to unbundling transactions were not found to have increased during the post-2012 period. A possible explanation could be that share repurchases could have been utilised as a more flexible option than special dividends during the post-2012 period to distribute transitory earnings. Higher ordinary dividends during the post-2012 period would suggest higher profitability; however, lower profitability was noted during the post-2012 period. Profitability is thus excluded as the main confounding factor for increased dividends during the post-2012 period.
Proposition 2 is also supported as retention rates were found to be statistically significantly lower during the post-2012 period in line with higher dividends during the post-2012 period.
Proposition 3 in respect of capital distribution is supported as a statistically significant decrease in value and a decrease in the frequency of electing capital distributions were observed during the post-2012 period. Capital distributions, indicated as a reduction contributed tax capital, would not constitute dividends resulting in CGT for the shareholder if shares were held with capital intent. Increases in the applicable tax rates adversely affect the tax preference for a payout method subjected to CGT since 2012 (Nel 2018). The decrease in capital distributions noted in this study is submitted as evidence of the payout policies of companies, which was adjusted as a result of the differential tax of dividends and capital gains.
Proposition 4 in respect of additional shares issued as scrip dividends is supported as a statistically significant increase in value and an increase in the frequency of election was observed during the post-2012 period. Despite the value of additional shares as a payout method being relatively low compared with other payout methods (Figure 2), the observed increase could provide potential insight in respect of a payout method, which empowers shareholders. The increased value and frequency of electing scrip dividends during the post-2012 could suggest an initiative by companies to empower shareholders with the choice since the introduction of dividends tax.
Proposition 5 in respect of general repurchases is not supported as no statistically significant decrease in value during the post-2012 period was observed. The decrease in the value of general repurchases post-2012 evident based on descriptive statistics (Figure 2) was not found to be statistically significant and the frequency of electing general repurchases increased post-2012. The increase in frequency of general repurchases post-2012 could also explain the decrease in frequency of electing special dividends to distribute transitory earnings during the post-2012 period.
Proposition 6 in respect of specific repurchases from subsidiaries is not supported as the value and frequency electing decreased during the post-2012 period, contrary to an expected increase. The findings of this study support the argument that specific repurchases from subsidiaries did not increase, despite the dividends tax exemption afforded, which could suggest motivations other than tax for entering into specific repurchases from subsidiaries. Wesson and Hamman (2012:35) also found that specific repurchases from subsidiaries occurred despite potential adverse tax consequences. One reason, other than tax, could be the flexibility afforded by treasury shares in the management of the capital structure of companies (Cassim 2010).
Proposition 7 in respect of specific repurchases not from subsidiaries is supported as a statistically significant increase in value and an increase in the frequency of election was observed during the post-2012 period.
Conclusion
The trend and composition of payout during the post-2012 period was expected to differ from the pre-2012 period based on seven propositions informed by tax reform. This study submits support for five propositions indicative that the trend and composition of total payout of selected JSE-listed companies differed during the post-2012 period. The increased frequency of electing more than one payout method during the post-2012 period suggests more diverse payout methods being utilised. The trend in value of payout methods, however, showed that total payout is dominated by ordinary dividends that increased during the post-2012 period, whereas payout methods other than ordinary dividends (except additional shares) did not show comparable increases.
Ordinary dividends and additional shares showed significant increases during the post-2012 period, whilst capital distributions showed significant decreases during the same period. Ordinary dividends (subject to dividends tax and affording an exemption for certain shareholders) were utilised more frequently as a payout method during the post-2012 period, whereas other payout methods (subject to CGT if shares were held with capital intent) were utilised to a lesser extent. An increase in the issue of additional shares (with a cash alternative) as scrip dividends was also noted during the post-2012 period, which empower shareholders to manage their own financial needs, including tax considerations.
The policy implication is that the increasing use of ordinary dividends as payout method and a decrease in the use of other payout methods could inform future tax reform initiatives to generate revenue or stimulate growth using tax incentives. In the light of the increasing use of ordinary dividends, any further increases in the rate of dividends tax would not be advisable because shareholders that do not qualify for dividends tax exemption could be discouraged from investing in South African companies.
The descriptive findings of this study emphasise the opportunity for further explanatory research into the effect of investor-level tax reform on payout policies. Further empirical research could include reference to the shareholding of companies and the extent to which the respective tax preferences of different shareholders affect the payout policies of companies. The fact that this study investigated the payout of companies over a period could have resulted in companies maturing over the period invoking inference in favour of the company life-cycle theory for an increase in dividends, which was not explored in the present study and could be explored in further research.
Acknowledgements
The authors would like to acknowledge Prof. Martin Kidd (Centre for Statistical Consultation, Stellenbosch University) for the statistical analyses performed in respect of this study.
Competing interests
The authors have declared that no competing interests exist.
Authors' contributions
R.N. was the primary researcher as part of his PhD study and N.W. supervised the research project in capacity as PhD supervisor.
Ethical consideration
The Departmental Ethics Screening Committee of the University of Stellenbosch Business School (USB DESC) confirmed that the research is exempt from ethical clearance.
Funding information
This research received no specific grant from any funding agency in the public, commercial or not-for-profit sectors.
Data availability statement
Data sharing is not applicable to this article as no new data were created or analysed in this study.
Disclaimer
The views and opinions expressed in this article are those of the authors and do not necessarily reflect the official policy or position of any affiliated agency of the authors.
References
Allen, F. & Michaely, R., 2003, 'Payout policy', in G.M. Constantinides, M. Harris & R.M. Stulz (eds.), Handbook of the economics of finance, vol. 1, pp. 337-429, Elsevier, Amsterdam. [ Links ]
Alzahrani, M. & Lasfer, M., 2012, 'Investor protection, taxation, and dividends', Journal of Corporate Finance 18(4), 745-762. https://doi.org/10.1016/j.jcorpfin.2012.06.003 [ Links ]
Andres, C., Doumet, M., Fernau, E. & Theissen, E., 2015, 'The Lintner model revisited: Dividends versus total payouts', Journal of Banking & Finance 55, 56-69. https://doi.org/10.1016/j.jbankfin.2015.01.005 [ Links ]
Arko, A.C., Abor, J., Adjasi, C.K.D. & Amidu, M., 2014, 'What influence dividend decisions of companies in Sub-Saharan African?', Journal of Accounting in Emerging Economies 4(1), 57-78. https://doi.org/10.1108/JAEE-12-2011-0053 [ Links ]
Badenhorst, W.M., 2017, 'Tax preferences, dividends and lobbying for maximum value', South African Journal of Economic and Management Sciences 20(1), 1-10. https://doi.org/10.4102/sajems.v20i1.1476 [ Links ]
Baker, H.K. & Weigand, R., 2015, 'Corporate dividend policy revisited', Managerial Finance 41(2), 126-144. https://doi.org/10.1108/MF-03-2014-0077 [ Links ]
Bidvest Group Limited, 2016, Integrated report for the year ended 30 June 2016, Bidvest Group Limited, Johannesburg. [ Links ]
Bird, A., 2013, Dividends and shareholder taxation: Evidence from Canada, unpublished paper, Tepper School of Business, Carnegie Mellon University, Pittsburgh. [ Links ]
Cassim, F.H., 2010, 'The challenge of treasury shares', Acta Juridica 2010(1), 151-164. [ Links ]
Coetzee, S. & De Wet, J., 2014, 'Dividend tax, dividend payments and share values: A South African perspective', Corporate Ownership and Control 11(3), 242-252. https://doi.org/10.22495/cocv11i3c2p3 [ Links ]
David, T. & Ginglinger, E., 2016, 'When cutting dividends is not bad news: The case of optional stock dividends', Journal of Corporate Finance 40, 174-191. https://doi.org/10.1016/j.jcorpfin.2016.07.008 [ Links ]
Farre-Mensa, J., Michaely, R. & Schmalz, M.C., 2014, 'Payout policy', Annual Review of Financial Economics 6, 75-134. https://doi.org/10.1146/annurev-financial-110613-034259 [ Links ]
Feito-Ruiz, I., Renneboog, L. & Vansteenkiste, C., 2018, Elective stock and scrip dividends, Finance Working Paper No. 574/2018, European Corporate Governance Institute, Brussels. [ Links ]
Filen, C., 2011, 'STC change to dividend withholding tax', Moneyweb, viewed 02 July 2019, from http://www.moneyweb.co.za/archive/stc-change-to-dividend-withholding-tax/. [ Links ]
Geiler, P. & Renneboog, L., 2015, 'Taxes, earnings payout, and payout channel choice', Journal of International Financial Markets, Institutions and Money 37, 178-203. https://doi.org/10.1016/j.intfin.2015.01.005 [ Links ]
Graham, M., 1999, 'The effect of STC on earnings retention', South African Journal of Accounting Research 13(1), 63-75. https://doi.org/10.1080/10291954.1999.11435085 [ Links ]
Hanlon, M. & Hoopes, J.L., 2014, 'What do companies do when dividend tax rates change? An examination of alternative payout responses', Journal of Financial Economics 114(1), 105-124. https://doi.org/10.1016/j.jfineco.2014.06.004 [ Links ]
IASB (International Accounting Standards Board), 2018, IAS 10 events after the reporting period, IASB, London. [ Links ]
Jacob, M. & Jacob, M., 2013, 'Taxation, dividends, and share repurchases: Taking evidence global', Journal of Financial and Quantitative Analysis 48(4), 1241-1269. https://doi.org/10.1017/S0022109013000367 [ Links ]
JSE (Johannesburg Stock Exchange), 2016, Glossary of investment and stock market terms - JSE, viewed 18 August 2018, from https://www.jse.co.za/investor-type/individual/glossary. [ Links ]
JSE (Johannesburg Stock Exchange), 2017, JSE listing requirements, Service issue no. 25, LexisNexis Butterworths, Johannesburg. [ Links ]
JSE (Johannesburg Stock Exchange), 2019, Small, medium and large caps - JSE, viewed 18 March 2019, from https://www.jse.co.za/grow-my-wealth/small-medium-and-large-caps. [ Links ]
Korkeamaki, T., Liljeblom, E. & Pasternack, D., 2010, 'Tax reform and payout policy: Do shareholder clienteles or payout policy adjust?', Journal of Corporate Finance 16(4), 572-587. https://doi.org/10.1016/j.jcorpfin.2009.12.003 [ Links ]
KPMG, 2016, South Africa's Economic Misery Index - Not as bad as during previous crises, viewed 17 December 2019, from https://home.kpmg/za/en/home/home/press-releases/2016/08/south-africa-economic-misery-index.html. [ Links ]
Lasfer, M.A., 1997, 'On the motivation for paying scrip dividends', Financial Management 26(1), 62-80. https://doi.org/10.2307/3666240 [ Links ]
Lie, E. & Lie, H.J., 1999, 'The effect of personal taxes in payout policy decisions: An empirical analysis of share repurchases and dividends', Journal of Financial and Quantitative Analysis 34(4), 533-552. https://doi.org/10.2307/2676233 [ Links ]
Mans-Kemp, N. & Viviers, S., 2015, 'The relationship between corporate governance and dividend payout ratios: A South African study', Management Dynamics: Journal of the Southern African Institute for Management Scientists 24(2), 20-35. [ Links ]
Marcus, M. & Gore, T., 2008, 'Crackdown on treasury share repurchases', Business Day, Business Law & Tax Review, May 2008, p. 6. [ Links ]
Marcus, M. & Toerien, F., 2014, 'The relative cost of internal vs. external equity in South Africa: The impact of capital gains and dividend taxes', South African Journal of Accounting Research 28(1), 97-116. [ Links ]
Mix Telematics Limited, 2008, Annual report for the year ended 31 March 2008, Mix Telematics Limited, Stellenbosch. [ Links ]
Montgomery, L.A., 2015, 'The relationship between the dividend payout ratio and the subsequent earnings growth', Master's thesis, University of Cape Town, Cape Town. [ Links ]
Mthanti, T., 2017, 'Political turmoil in 2016 can be traced back to the 2008 financial crisis', Mail & Guardian, viewed 17 December 2019, from https://mg.co.za/article/2017-01-02-political-turmoil-in-2016-can-be-traced-back-to-the-2008-financial-crisis. [ Links ]
Munzhelele, F., 2019, 'Distribution policy and creation of shareholders' wealth: A study of firms listed on the Johannesburg Stock Exchange', PhD thesis, University of Pretoria, Pretoria. [ Links ]
Nel, R., 2018, 'Investor tax-driven preferences for dividends and share repurchases of listed companies', South African Journal of Accounting Research 32(1), 71-87. https://doi.org/10.1080/10291954.2017.1414349 [ Links ]
Nyere, L. & Wesson, N., 2019, 'Factors influencing dividend payout decisions: Evidence from South Africa', South African Journal of Business Management 50(1), 1-16. https://doi.org/10.4102/sajbm.v50i1.1302 [ Links ]
Oosthuizen, G., 2009, 'Analysing cash retained by companies declaring scrip dividend on the Johannesburg Stock Exchange', Master's thesis, Stellenbosch University, Stellenbosch. [ Links ]
Osborne, J., 2010, 'Improving your data transformations: Applying the Box-Cox transformation', Practical Assessment, Research, and Evaluation 15(12), 1-9. [ Links ]
Republic of South Africa, 1962, Income Tax Act, No. 58 of 1962 (as amended), Government Printer, Pretoria. [ Links ]
South African Revenue Service, 2008, Legal & Policy Income Tax: Taxation Laws Amendment Act No. 3 of 2008, viewed 24 April 2017, from www.sars.gov.za. [ Links ]
Statistics South Africa, 2017, CPI history, viewed 18 August 2017, from http://www.statssa.gov.za/publications/P0141/CPIHistory.pdf? [ Links ]
Steenkamp, G. & Wesson, N., 2020, 'Post-recession share repurchase behaviour by JSE-listed companies: Transparent or not?', Journal of Accounting in Emerging Economies 10(3), 465-486. https://doi.org/10.1108/JAEE-02-2020-0040 [ Links ]
Van der Linde, K., 2008, 'Aspects of the regulation of share capital and distributions to shareholders', PhD thesis, University of South Africa, Pretoria. [ Links ]
Venter, S., 2014, 'The impact of the introduction of dividends tax in South Africa on foreign and local investors', Master's thesis, University of Pretoria, Pretoria. [ Links ]
Wesson, N. & Hamman, W.D., 2012, 'The repurchase by a holding company of treasury shares held by subsidiaries: A South African perspective', South African Journal of Business Management 43(4), 33-44. https://doi.org/10.4102/sajbm.v43i4.480 [ Links ]
Wesson, N., Hamman, W.D. & Bruwer, B.W., 2015, 'Share repurchase and dividend payout behaviour: The South African experience', South African Journal of Business Management 46(3), 43-54. https://doi.org/10.4102/sajbm.v46i3.100 [ Links ]
Wesson, N., Smit, E., Kidd, M. & Hamman, W.D., 2018, 'Determinants of the choice between share repurchases and dividend payments', Research in International Business and Finance 45, 180-196. https://doi.org/10.1016/j.ribaf.2017.07.150 [ Links ]
Williams, L.J. & Abdi, H., 2010, 'Fisher's least significant difference (LSD) test', in N. Salkind (ed.), Encyclopedia of research design, pp. 840-853, Sage, California. [ Links ]
World Bank, 2020, World Development Indicators - GDP growth (annual %), viewed 18 May 2020, from https://databank.worldbank.org/source/world-development-indicators. [ Links ]
 Correspondence:
Rudie Nel
rnel@sun.ac.za
Received: 08 June 2020
Accepted: 02 Dec. 2020
Published: 18 Feb. 2021

