


Services on Demand
Article
 English (pdf)
 Article in xml format
 Article references
Indicators

Related links
-
 Cited by Google
 -
 Similars in Google
Share

 Permalink
Acta Commercii
On-line version ISSN 1684-1999
Print version ISSN 2413-1903
Acta Commer. vol.19 n.1 Johannesburg 2019
http://dx.doi.org/10.4102/ac.v19i1.659
ORIGINAL RESEARCH
Assessing the resilience of Brazil, Russia, India, China and South Africa economies following the global financial crisis
Aurelio HessI; Celso CamposII; Tankiso MoloiIII
IDepartment of Business and Education, Faculdades Oswaldo Cruz, São Paulo, Brazil
IIDepartment of Economics, Pontifícia Universidade Católica, São Paulo, Brazil
IIIDepartment of Accountancy, University of Johannesburg, Johannesburg, South Africa
ABSTRACT
ORIENTATION: Productivity is known as a good predictor of living standards, able to indicate well-being of the population and efficiency of the economy.
RESEARCH PURPOSE: To examine how the global financial crisis affected the total factor productivity (TFP) of Brazil, Russia, India, China, and South Africa (BRICS) economies.
MOTIVATION FOR THE STUDY: Productivity of BRICS is far below the G-7 and EU-28 countries, even though the economies of Brazil, Russia, India, China, and South Africa together are very representative of both the world gross domestic product (GDP) and population.
RESEARCH DESIGN, APPROACH AND METHOD: Observational study of a cross country panel data of five countries throughout 14 years, including the period of the 2008 crisis. Based on the Penn World Table (PWT) 9.0 database, we compared BRICS countries, from 2001 to 2014, before and after the financial crisis. Descriptive statistics, tests with Fisher-Snedecor (F) distribution, and a one-way analysis of variance (ANOVA), may bring robust evidence to construct conclusions.
MAIN FINDINGS: Findings suggest that the TFP average growth was negatively affected. The special situation of 'B' and 'S' (Brazil and South Africa) deserves attention, with negative average growth before and after the financial crisis for Brazil, and a dramatic loss of average growth for South Africa. The global crisis seems to have separated BRICS into RIC-BS in the aftermath. Not all the TFP average growths were equal, either before or after the financial crisis
PRACTICAL/MANAGERIAL IMPLICATIONS: The TFP average growth, which is essential to economic development of the nation, is the result of managerial behaviour of companies and governments on a day to day basis. Decision makers and policymakers need to know how productivity was affected by the financial crisis.
CONTRIBUTION/VALUE-ADD: There is a gap in economic literature about the productivity of BRICS compared, restraining the assessment of the homogeneity of the BRICS economic development, especially as an aftermath of the crisis. The main contribution to the field of business and economics is giving evidence-based information to policymakers and decision makers of the BRICS about the extension of the 2008 financial crisis' impact, offering a new perception of the block's resilience both individually and combined.
Keywords: BRICS; TFP; financial crisis; ANOVA; growth rate.
Introduction
When focusing on a country's economic development and growth, some of the most important tasks are to observe and to grasp the productivity trends and behaviours and production factors. This is fundamental to any economy and still more important in developing countries, as clearly stated in seminal works such as Bohm-Bawerk (1907), Jorgenson and Griliches (1967), and Kaldor (1966), among others. These authors show that productivity plays a key role in the economic development. Therefore, there is a need to conduct further scientific work in this area.
From our review of related literature, it is evident that there is an inconsistent and incomplete understanding of how the global financial crisis affected developing countries' capacity to increase productivity, if at all it did. Therefore, the main objective of this study is to fill this gap in economic literature, with evidence from the effects and the resilience of Brazil, Russia, India, China and South Africa (BRICS) to the world financial crisis, both as a block and individually.
To contextualise this study, it was deemed necessary to outline certain definitions. Firstly, it is important to describe the concept of 'BRICS'. Investment firm Goldman Sachs's O'Neill (2001) issued a research report presenting the acronym BRIC to reflect the four large emerging economies of Brazil, Russia, India and China, a supposedly powerful group of countries. The BRIC grouping was subsequently created in 2006, and a few years later, South Africa was invited to join this group, not exactly from an economic power perspective, but rather for strategic and political reasons, and the acronym was changed to BRICS to reflect South Africa's inclusion.
Secondly, it is necessary to take an in-depth look at productivity as a key factor for the development, growth and prosperity of a country, observing a broad measure of productivity, called the total factor productivity (TFP) (also called multifactor productivity [MFP]). In this regard, the TFP is considered a long-term variable, and focus is placed on its time series for the BRICS countries.
Thirdly, this study is concentrated on the global financial crisis period that started in 2008; however, it is important to clarify that the period from 2001 to 2014 was studied in order to compare the 7 years before the financial crisis (BFC) and 7 years after the financial crisis (AFC).
Descriptive statistics were used, over the period of 14 years for the key variables TFP, labour, capital and unemployment, with their respective variations.
A judgement sample including the global crisis period was considered adequate for the purpose of our investigation. The comparison was made by a panel data method, considering the 2008 global financial crisis as a natural experiment. To encompass the effects along the time and to be able to compare the data before and after the crisis, we considered 14 years: 7 years before and 7 years after the crisis. Stationarity was not measured, as this was considered inexpressive to the study. A one-way analysis of variance (ANOVA) was applied to compare the TFP between countries and periods. Differences were checked if statistically significant at α = 5%, through an F probability distribution, to compare BRICS economies.
Other issues regarding the consequences faced by BRICS economies during the global financial crisis are discussed, such as variations in capital stock, fluctuations in the labour market, share of labour compensation and unemployment.
Fourthly, this study sometimes uses BRIC and sometimes uses BRICS because BRIC was the term prior to the inclusion of South Africa, and the acronym was changed to BRICS after South Africa's inclusion.
Finally, this study proposes that global models for world economic development are based on macroeconomic variables, such as the gross domestic product (GDP), TFP, demography, capital stock, and the labour force and its compositions, all of which play vital roles in the economy (Fontagné, Foure & Ramos 2012). Thus, considering the above-mentioned variables, it is necessary to take a closer look at the global financial crisis' effect on the BRICS countries' TFP average growth, observing and discussing - as much as data allow - other impacts and consequences. The main purpose is to assess how BRICS reacted to the global financial crisis, and some hypothesis testing is carried out in order to investigate whether or not BRICS countries performed well in terms of the TFP during the crisis.
Literature review
Since O'Neill (2001) first presented the term BRIC, many studies have been conducted in an attempt to explain whether and why BRICS is an important combination of economies. To assess these questions, the following aspects were studied: education, human capital, labour force, stock markets, governance, technology, bonds and so on. Some of the most important aspects are outlined in the following.
Some recent studies agree with O'Neill (2001), stating that even after the 2008 global financial crisis, the BRICS countries developed rapidly, and their economies combined could exceed the combined economies of the richest countries by 2050. For instance, Branco (2015) states that the group of countries remains important even if some consider the term passé, both politically and economically. He argues that in 2014, BRICS were responsible for 28% of the global GDP and 42% of the world's population and had high growth potential, and structural transformation was in progress.
Economists and philosophers have theorised about productivity throughout history, and the neo-classics even more after the marginal productivity theory (Georgescu-Roegen 1935; Stigler 1947). Other economists (Bliss & Bliss 1975; Ostroy 1984) showed which variables are considered drivers of productivity. Capital and labour are the main production factors, and all that is related to them that affects - somehow - the efficiency of production, are also called productivity.
We further examined a variety of other fundamental works in the area, such as 'The wage-productivity theory of underemployment: A refinement' (Yotopoulos 1965), 'Productivity and growth in manufacturing industry: A reply' (Kaldor 1968), 'A productivity theory of wage levels - An alternative to the Phillips curve' (Kuh 1967), 'Productivity and growth in manufacturing industry: Some reflections on Professor Kaldor's inaugural lecture' (Wolfe 1968), 'Wicksteed's recantation of the marginal productivity theory' (Dorfman 1964), 'International spill-overs of knowledge and sectoral productivity growth: Some evidence for Canada and the United States' (Brecher, Choudhri & Schembri 1996), 'Lawrence R. Klein Lecture 1997: Needed: A theory of total factor productivity' (Prescott 1998), 'The effects of openness, trade orientation, and human capital on total factor productivity' (Miller & Upadhyay 2000), 'Productivity Measures Manual' (OECD 2001), 'How important are capital and total factor productivity for economic growth?' (Baier, Dwyer & Tamura 2002), 'The power of productivity : Wealth, poverty, and the threat to global stability' (Lewis 2004), 'The dual labour market theory and the informal sector in South Africa' (Uys & Blaauw 2006), 'Economic reform and total factor productivity growth in Indian manufacturing industries' (Kim & Saravanakumar 2012), 'Evaluating the effectiveness of a gainsharing programme for labour productivity improvement' (Zondo 2017) and 'The global value chain dimension of FDI flows in the agro-industrial sector of South Africa' (Bezuidenhout, Grater & Kleynhans 2018), among others.
In a recently released paper, Ouyang (2016) performed a detailed analysis of the comprehensive human capital advantages in late-developing large countries, presenting the case of China, and findings provided enough evidence to propose policy changes. Furthermore, Mallick (2015) conducted an investigation examining the reallocation effect (or structural change) and the direct effect of globalisation on labour productivity growth in BRICS countries. Findings show that the contribution of structural change is significant in China and India, including international trade and inward foreign direct investments (FDI), and they have a significant impact on the upsurge of labour productivity growth in the BRICS countries.
Another study deemed important for this article is that of Bianconi, Yoshino and Machado de Sousa (2013). Accordingly, this work examined empirical evidence based on the behaviour of stocks and bonds from BRIC nations, by using daily data from January 2003 to July 2010. Bianconi et al.'s (2013) results reveal that in the long term and during the global financial crisis, BRIC bond markets deviated much more from the US financial stress measure than the BRIC bonds and stocks had deviated between themselves. These findings confirm the perspective that, financially, BRICS reacted quicker than the United States. However, does it imply that their TFP average increment by year performed better than the United States and other developed countries during and after global crisis period? Or was it at least preserved at the same growth rates?
Specifically observing the greater economy of China, whose approach to economic transition resulted in long-term high growth, Wilson and Purushothaman (2003) presented findings suggesting that reform measures frequently resulted in one-time level effects on the TFP, and that China needed to revise its reform programmes to sustain productivity increases.
Focusing on the role of technological capital, Zheng, Bigsten and Hu (2009) conducted an investigation computing measures of TFP growth for developing countries and contrasting them with technological capital indexes. Their investigation showed that TFP performance is strongly related to technological capital, which is needed for TFP increase and cost reduction.
Education plays an important role in the TFP average growth, according to a study conducted on BRICS economies by Chaudhary et al. (2012), who compared data on school inputs and outputs, which evidenced the importance of political decentralisation in education matters. Moreover, they identified other factors not previously mentioned, such as endowments dependence, colonialism, serfdom and, most importantly, the characteristics of the political and economic elite compromising the BRIC's performance. This study was entitled 'Big BRICS, weak foundations'.
To determine whether the BRIC's equity markets could be considered weak-form efficiency, Mobarek and Fiorante's (2014) study took into account the period from 1995 to 2010 (including the global financial crisis beginning in 2008), and they found evidence that supports the belief that BRIC markets may have been approaching a state of being fairly weak-form efficient. It is possible that these findings reflect the future of BRIC economies. Additionally, Zhong, Chang and Tzeng (2014) established that the US markets (for both the Dow Jones 30 and the S&P 500) are pairwise co-integrated with the stock markets of the BRIC countries during the period from July 1997 to March 2012. Thus, international investment diversification between these markets could not benefit investors in a longer term.
Theoretical framework
As expressed by the OECD (2001), the long-term TFP trend measure is useful in assessing an economy's underlying productive capacity (potential output), which is an important measure of the growth possibilities of economies and inflationary pressures. Productivity is commonly defined as the ratio of a volume measure of output to a volume measure of input use. While there is no disagreement on this general notion, a look at the productivity literature and its various applications quickly reveals that there is neither a unique purpose for nor a single measure of productivity (OECD 2001).
According to Comin (2006), economic theory proposes that TFP is the portion of output that is not explained by the number of inputs used in production. As such, its level is determined by how efficiently and intensely the inputs are utilised in production. An increase in TFP means that more outputs will be obtained with the same set of inputs, or fewer inputs will be needed for the same outputs. TFP's growth is created with the help of technological changes or more efficient use of inputs (Crafts 2008).
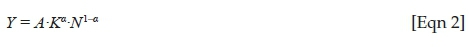
Abel, Bernanke and Croushore (2014) established a production function as a mathematical expression relating to the amount of output produced to quantities of capital and labour utilised:

Where Y = real output produced in a given period of time, A = a number measuring overall productivity, K = the capital input, N = the labour input, f = a function relating output Y to capital K and labour N.
This article refers to A as TFP; therefore, note that for any value of capital and labour, an increase in productivity (A) implies an equal increase in the amount of output that can be produced. In other words, an increase in A produces an equal increase in Y ceteris paribus, that is, Y has constant scale returns in relation to A. Thus, increases in productivity (A) correspond to improvements in any change in the economy that allows capital and labour to be utilised more effectively. Empirical studies show that the relationship between an economy's output and inputs is aptly described in the following production function:
This type of production function is called a Cobb-Douglas production function, which considers 0 < α < 1. For instance, for the US economy, the production function is the one presented, which, as taught by professors (Cobb & Douglas 1928), describes reasonably well the real output produced:

Output, capital and labour are measured directly, and productivity index, A, is measured indirectly by assigning to it the value necessary to satisfy Equation 3. Thus, A can be determined by formula (4), concerning the US example; otherwise, it can be obtained as an output of an econometric regression.

Productivity normally falls in recessions and rises in recoveries, but explanations for its behaviour are controversial. However, an increase in productivity growth is certainly a good outcome because it is closely related to the rate of improvement in living standards.
The production function of an economy does not usually remain fixed over time. The term 'supply shock' - sometimes called productivity shock - is used by economists to refer to a change in an economy's production function. A positive or beneficial supply shock raises the amount of output that can be produced for given quantities of capital and labour. A negative or adverse supply shock lowers the amount of output that can be produced for each capital-labour combination.
The two most important inputs in an economy are capital and labour. According to Abel et al. (2014), the capital stock changes over time, as a result of investment by firms and the scraping of worn-out or obsolete capital. However, capital stock is long-lived and is built up over many years; therefore, new investment and scraping of old capital have a slight and slow effect on the overall quantity of capital available. By contrast, the amount of labour employed in an economy can change fairly quickly. Thus, year-to-year changes in production can often be traced to changes in employment.
According to macroeconomic theory, and confirmed by the OECD's Productivity Manual (OECD 2001), the division of national income between labour and capital is called the functional distribution of income. Labour share is the part of national income allocated to labour compensation, as much as the capital share is the part of national income going to capital. Naturally, according to the OECD (2001), a falling labour share frequently suggests more rapid growth in labour productivity than in average labour compensation, and an increase in returns to capital relative to labour. And according to Naudé, Szirmai and Haraguchi (2016), when structures are transformed, this results in productivity increases and growth, which trigger further processes of agglomeration and technological advances.
This study and all its conclusions are based on data from PWT 9.0, and in the construction of TFP levels, PWT uses country-specific factor shares. Thus, all five BRICS countries are compared here at the same base. Nevertheless, when data were not available in PWT 9.0, we sourced data from the World Bank.
Description of the PWT 9.0 identification is presented below:
-
CTFP (TFP level at current PPPs [purchasing power parity-USA = 1]): TFP level, computed with CGDPo, CK, labour input data and LABSH (share of labour compensation in GDP at current national prices) at constant national prices for the United States
-
CGDPo: output-side real GDP, using prices for final goods, exports and imports that are constant across countries
-
CK: capital stock using prices for structures and equipment that are constant across countries
-
LABSH: the share of labour income of employees and self-employed workers in GDP.
Based on these statements in addition to the macroeconomic theory, we have compared the BRICS countries' reactions to the effects of the global financial crisis. A comparison of the TFP before and after 2008 can provide a perspective on how BRICS countries have performed, and how the global financial crisis affected the BRICS countries' capacity to evolve in terms of labour and capital uses regarding productivity. Additional consequences of the crisis were assessed for all the economies, and the results are reported here.
Methodology
Based mainly on PWT 9.0, the authors have defined an observational study of the BRICS countries. Data were selected from each country for 14 years - from 2001 to 2014 - considering the TFP level at current purchase power parity (PPP) (US = 1). Descriptive statistics (Hamburg 1977) were employed to synthesise the data of the complete period of 14 years for the following variables: (1) TFP, (2) share of labour compensation, (3) capital stock, (4) depreciation rate of capital stock and (5) unemployment. Average means and standard deviations were used to measure BRICS economies in different periods, as much as to compare and have some essential parameters to the comparisons. A judgement sample (Anderson, Sweeney & Williams 1998), which is not a randomly chosen sample, but a focused sample in the specific period needed - in this case, period of 7 years before and 7 years after the world financial crisis - was applied to illustrate the differences under investigation. The comparison was achieved via the panel data method, taking advantage of the 2008 global financial crisis, which permitted us to look at it as a natural experiment for an observational study, considering the TFP before crisis (2001-2007) and after the crisis (2008-2014). Stationarity was not measured, as the purpose of the research was to deepen the knowledge of the past rather than to forecast. A one-way ANOVA was applied to compare the TFP averages of BRICS economies BFC and AFC. ANOVA is used (Triplett 1999) to know whether two or more average productivities are equal and to test hypothesis of differences between them. Differences were checked if statistically significant at α = 5%, through an F distribution, to compare BRICS countries in three situations: (1) long-term, (2) BFC and (3) AFC (Anderson et al. 1998).
Several tests were performed. In Test 1, with the null hypothesis H0, we assumed that the TFP average could be expected to be the same for all BRICS countries in the long term, based on the study and perspectives offered by the Goldman Sachs Chairman for the BRICS (O'Neill 2001). Subsequently, we continued to look for similarities among BRICS countries and performed various groupings, which are described as follows.
Additionally, questions arose, which were answered not through hypothesis testing but through a simple analysis of the variables' behaviour along the time series (Hamburg 1977).
Ethical considerations
Secondary data were used in this study, which are publicly available. Therefore, no ethical consideration was required for the study.
Hypothesis testing and questionings
Test 1
H0: µB = µR = µI = µC = µS→ Average productivity is equal for all BRICS countries in the long term.
Ha: Average productivity is not equal for all BRICS countries in the long term.
Test 2
H0: µB = µR = µI = µC = µS→ Average productivity is equal for all BRICS countries BFC.
Ha: Average productivity is not equal for all BRICS countries BFC.
Test 3
H0: µB = µR = µI = µC = µS→ Average productivity is equal for all BRICS countries AFC.
Ha: Average productivity is not equal for all BRICS countries AFC.
Test 4
H0: µR = µI = µC→ Average productivity is equal for Russia, India and China (RIC) in the long term.
Ha: Average productivity is not equal for RIC in the long -term.
Test 5
H0: µR = µI = µC→ Average productivity is equal for RIC BFC.
Ha: Average productivity is not equal for RIC BFC.
Test 6
H0: µR = µI = µC→ Average productivity is equal for RIC AFC.
Ha: Average productivity is not equal for RIC AFC.
Test 7
H0: µB = µS→ Average productivity is equal for Brazil and South Africa (BS) in the long term.
Ha: Average productivity is not equal for BS in the long term.
Test 8
H0: µB = µS→ Average productivity is equal for BS BFC.
Ha: Average productivity is not equal for BS BFC.
Test 9
H0: µB = µS→ Average productivity is equal for BS AFC.
Ha: Average productivity is not equal for BS AFC.
In accordance with the objective stated before, which is to fill the gap in economic literature, with evidence from the effects and the resilience of BRICS to the world financial crisis - both as a block and individually - these hypothesis tests gave us robust evidence to answer the following questions:
-
Did BRICS perform better than the seven most industrialised and developed (G7) countries in terms of productivity AFC?
-
Did the share of labour compensation suffer a decrease after the crisis?
-
Did capital stock fall in BRICS countries when comparing data BFC and AFC?
-
Did unemployment grow AFC?
-
Did unemployment leave millions of unemployed AFC?
-
Were BRICS countries positively affected by the crisis in all the variables assessed?
After the hypothesis testing and answering these questions, an overall analysis of the results will be provided.
Results and discussion
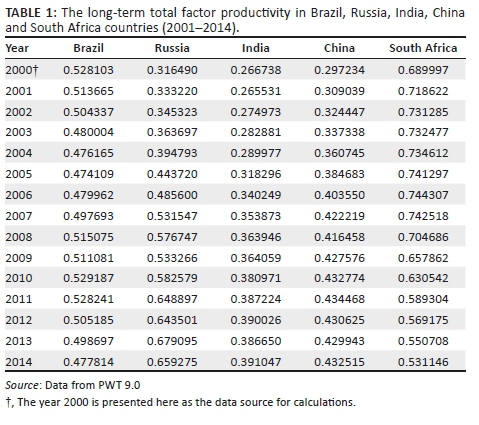
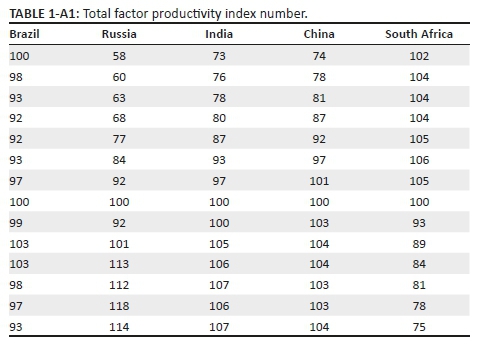
The study is observational, so causality cannot be stated. However, the findings suggest a strong interference on the annual TFP average growth in most BRICS countries AFC. Table 1 presents the TFP for all BRICS countries.
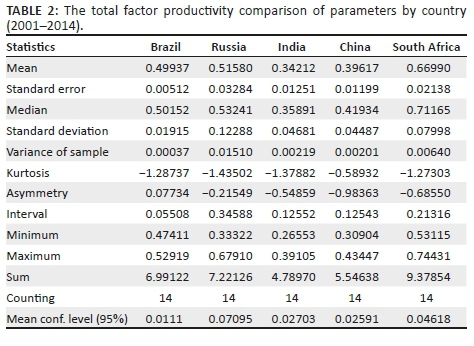
Descriptive statistics have shown significant differences in the TFP average, standard deviations and standard errors in a 14-year base for comparison, from 2001 to 2014, with a 95% level of confidence for the mean, as is evident in Table 2.
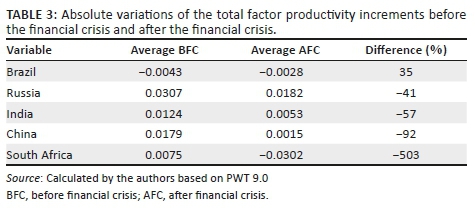
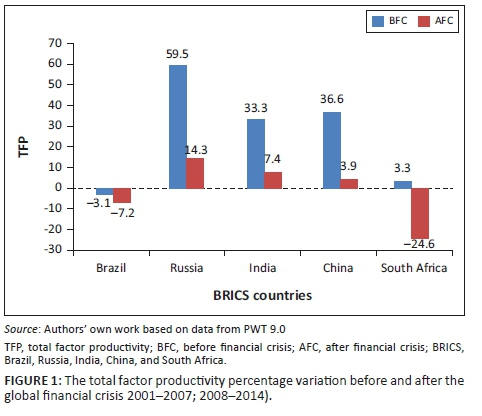
By looking at the numbers in Table 3, it is evident that BRICS countries were neither at the same TFP average growth level BFC or AFC, when the differences are significantly large. Data suggest that the global financial crisis profoundly affected the capacity of all BRICS countries to increase the TFP year-to-year, especially in the case of Brazil, which had a negative TFP growth BFC, and although it became less negative AFC, it was still negative, which meant a loss of productivity in the long term. In Table 3, the disparities between RIC and BS are presented. While RIC lost their capacity to increase productivity, they still remained positive. BS presented two different situations: (1) Brazil gained in productivity growth, but from negative to less negative; (2) South Africa, which had the best situation of all BRICS countries in the long term, with a productivity average of 0.6699, became the worst case in terms of losses of productivity AFC.
Another way to analyse the numbers is by observing the TFP effective growth BFC and AFC. Seven years after the crisis, four out of five BRICS countries' economies were poorer in TFP growth compared to 7 years earlier. Brazil and South Africa contrast before and after, evidencing the difference between the two groups regarding productivity. The first one was formed by RIC, with positive results and growth BFC and AFC. The second one was formed by BS with daunting losses of productivity in the long term for Brazil, and a dramatic loss of productivity after the crisis for South Africa (see Figure 1).
The one-way ANOVA (Table 4) provides strong evidence to reject H0 (p = 0.000) and accept the alternative hypothesis Ha, that not all TFP averages were at the same level over a long-term basis for the BRICS countries (test 1), as might be expected, based on Jim O'Neill's postulations.
Analysis of variance calculated for the periods BFC and AFC also provides evidence to reject H0 and to accept the alternative hypothesis Ha in tests 2 and 3, which state that countries were at the same level neither BFC nor AFC. In tests 4, 5, 7 and 8, the null hypothesis was accepted (or could not be rejected at 5% level of confidence). It means that RIC were at the same TFP level on a long-term basis, as were BS, statistically speaking. Therefore, test 8 reveals that RIC stayed at the same TFP level AFC, and test 7 reveals that BS were at the same TFP level BFC. Nevertheless, test 6 revealed that RIC were not at the same TFP level BFC, as was the case with BS AFC, in terms of test 9. Thus, despite the results of tests 6 and 9, the separation of the countries into two groups, BS and RIC, by crisis impact in terms of the TFP becomes clear. Table 4 summarises all assessments.
The differences between the two groups has been noted by Branco (2015), who points out that despite the similarities, the BRICS countries are very different, with China and India closer than others like Brazil, Russia and South Africa. The crisis seems to have put Russia into the other group.
From a more accurate observation, the TFP absolute average variation cannot be considered the same for four out of the five BRICS BFC nor AFC (see Figure 2).
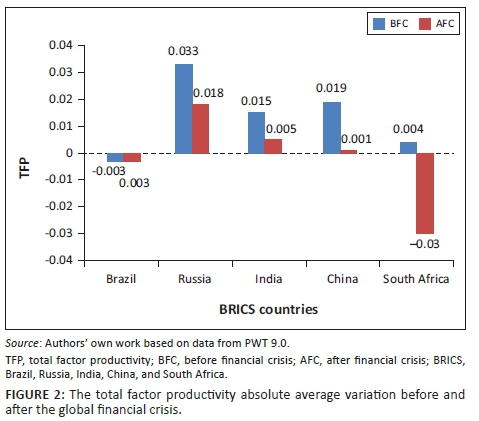
Nonetheless, BFC, RIC were experiencing good results for TFP growth, while BS were close to a null variation. After the financial crisis, an inversion can be seen in both subgroups' behaviour. Russia, India and China lost its growth power, but continued to present positive results, while BS went down, below zero. Thus, it is evident that RIC, despite their losses, preserved their capacity to increase productivity, but Brazil continued losing productivity, and South Africa suffered a major inversion with the greatest loss in capacity to increase productivity, even though it remains better than Brazil in terms of absolute productivity.
Thus, it can be stated that the BRICS countries' TPF average variations were constantly different, which would not be expected, considering O'Neill's (2001) proposition of the countries' trajectories. Additionally, the global financial crisis affected all BRICS countries in different ways. Structural transformation differed in these countries and, according to Naudé et al. (2016), boosted results in productivity and growth, and triggered technological advances. Thus, conversely, we can deduce that the same is true if structures are negatively transformed.
Subsequent to the global financial crisis, Brazil and South Africa continued to experience difficulties in terms of the TFP, that is, structurally. As stated by Kregel (2009), there are opportunities in Brazil even after the collapse of the financial markets that eliminated the positive impact of export-led growth. According to the author, Brazil has a strong possibility of building on domestic sources of demand, as some policies to support this alternative are in place. For South Africa, Noah and Ichoku (2015) observed competitiveness from 1999 to 2011 and stated that in the long term, South Africa lagged behind China and India, but was ahead of Brazil and Russia. The period studied covers the global financial crisis and suggests that South Africa has a good chance of recovery, based on their competitiveness.
However, although Figures 1 and 2 seem to place BS in a lower position, it is important to remark that China and India had the lowest TFP results in the beginning (2001) and remained in this position at the end (2014) of the time series, regardless of some improvements. Russia and South Africa changed positions, as SA was in the lead at the beginning (2001) but was surpassed by Russia at the end. In this upside movement, Russia also surpassed Brazil, which had the second highest TFP at the beginning and placed third at the end, as can be seen in Figure 3. Another outcome that emerged from Figure 3 is that at the end of the time series, the TFP results were more homogeneous than before. Perhaps the financial crisis potentialised this development.
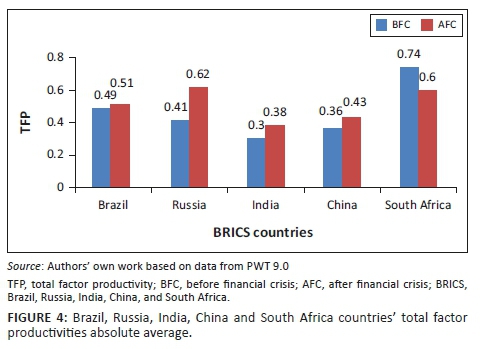
According to Becker (2013), it is conventional wisdom that the fast growth of BRICS countries' GDPs will - in the next few decades - follow and then surpass the western GDP levels; however, to achieve that, productivity will be a key factor. Naudé et al. (2016) studied structural economic transformation keenly and pointed out that the evolution from low productivity traditional activities to higher productivity modern activities is a basic requirement for development. These results confirm and are aligned with the authors' perception that the global financial crisis did not compromise the TFP results of BRICS countries, although the growth rate declined. An exception can be made for South Africa, but its TFP level remains high at the end of the time series, as already mentioned. Figure 4 shows the TFP absolute average BFC and AFC, and the absolute growth for four out of five countries is evident, as only South Africa experienced a loss.
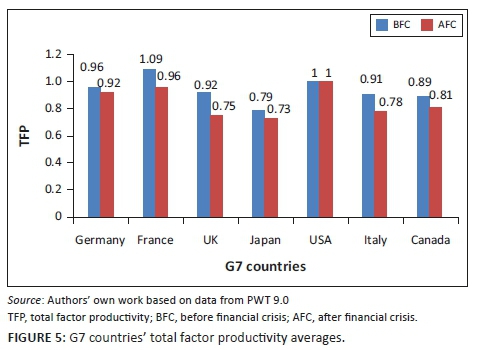
Despite the fact that South Africa experienced a loss, most of BRICS countries performed a higher TFP AFC. Financially speaking, BRICS have recovered before G7 countries (including the United States where the crisis began) right AFC. Because the authors questioned whether BRICS countries performed better than G7 countries in terms of productivity growth AFC, they are inclined to accept this idea, based on the results shown in Figure 6. Although most of the BRICS countries have lost their capacity to increase productivity, their TFPs showed better results AFC than BFC. In the case of G7 countries, almost all of them have experienced lower productivity averages AFC, as is evident in Figure 5.
Although BRICS countries have performed better regarding TFP averages AFC, the absolute productivity remains below that of the G7 countries. It confirms Almeida's (2009) findings, which confirm a below well-being and productivity indicators for BRICS countries, even after O'Neill's (2001) predictions for 2050.
Calculating a TFP index number, with the base placed in 2008, the authors of this article examined trends along the time series. They perceived an uptrend for RIC BFC - with a special remark to Russia - while South Africa was pretty stable at a good level - indeed better than any other, and Brazil showed little variation, as is evident in Figure 6. After the global financial crisis, only Russia, after the initial impact, continued to grow significantly. Special remark goes to South Africa's losses, followed by those experienced in Brazil.
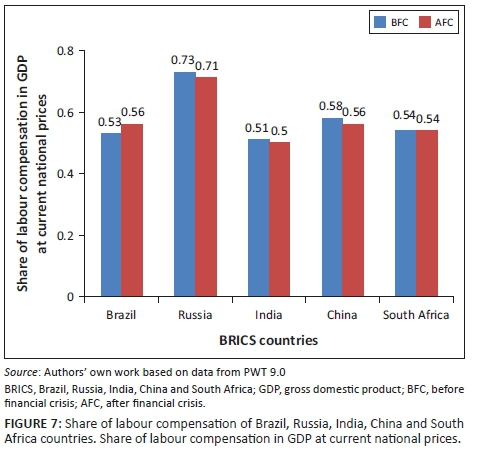
As previously stated, based on economic theory, the two most important inputs in an economy are capital and labour. The capital stock changes over time and is long-lived; therefore, new investments and scraping off old capital only have a significant effect in the longer term. In contrast, the amount of labour employed in an economy can change fairly quickly, and thus quick changes in production can be traced to changes in employment. The authors posed the following question: did the share of labour compensation suffer a decrease after the crisis? Figure 7 reveals that there are no relevant differences BFC and AFC, that is, BRICS countries have not experienced a relevant decrease in labour compensation. Naturally, a falling labour share frequently suggests more rapid growth in labour productivity than in average labour compensation, and an increase in returns to capital relative to labour.
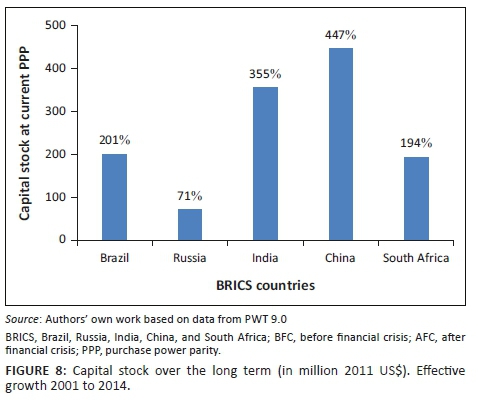
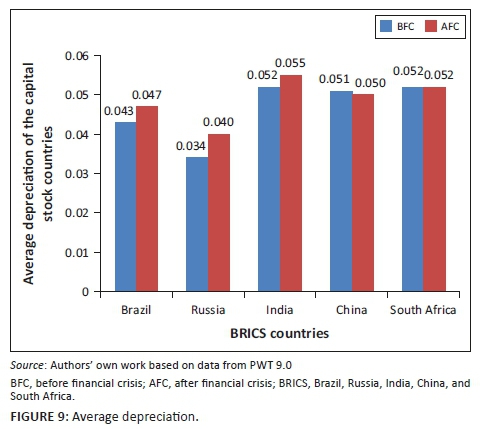
Because BRICS economies were susceptible to the global financial crisis, the authors believed that companies would stop renewing their leases as industrial parks and depreciation would grow. Thus, they posed the following question: has the capital stock fallen in BRICS countries? Based on Figures 8 and 9, it can be concluded that capital stock has grown in all BRICS economies, and average depreciation in these countries has not changed significantly.
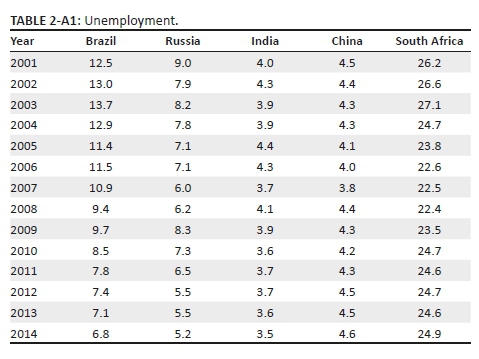
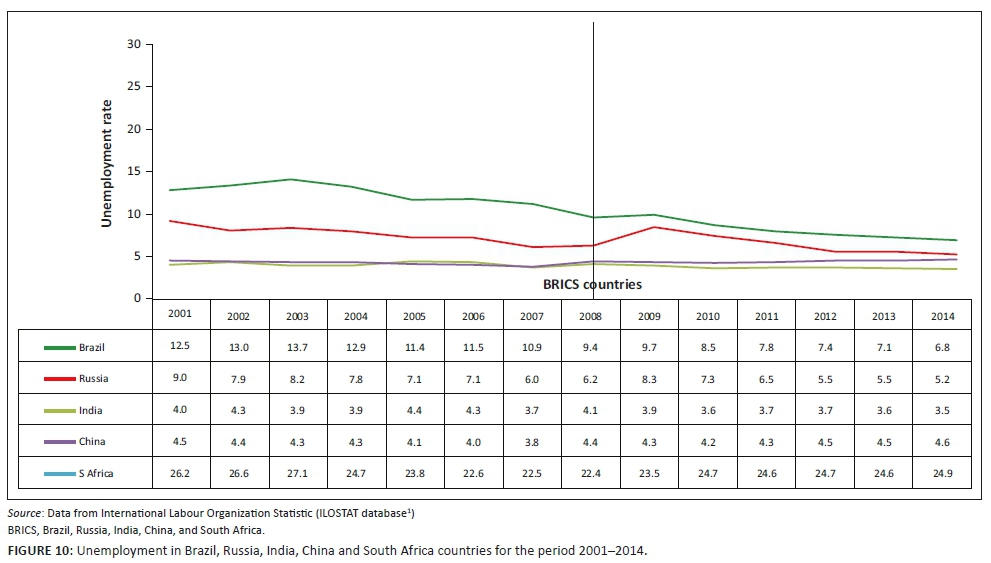
Expecting the worst, as is likely in any global crisis, the authors posed the following question: did unemployment grow after the financial crisis? Considering that unemployment refers to the share of the labour force that is without work but available for and seeking employment, Figure 9 provides an answer.
As can be seen, there was no significant growth AFC, but it is evident that Brazil and India experienced a downtrend, while China and South Africa showed a little growth. Russia, in the long term, also showed a downtrend.
As BRICS countries are the topic of focus, there was another particularity that deserved investigation. Unemployment had not been achieved in these countries where the population is very large (in the hundreds of millions); however, social collapses have not also arisen. The authors posed the following question: did unemployment create millions of impoverished and unemployed people? The answer is no, as is evident in Figures 10 and 11.
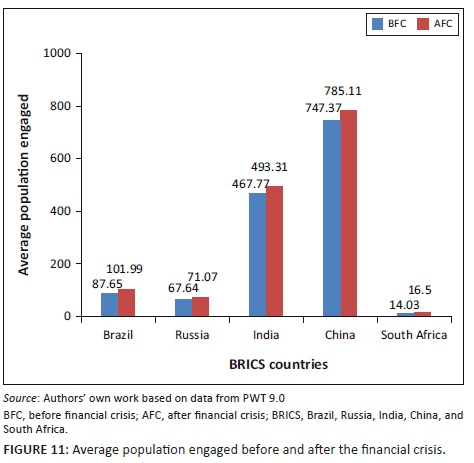
In all BRICS economies, the average population engaged AFC were larger than BFC.
Summary, conclusion, recommendations and implications
The importance of this research lies in the in-depth study of productivity and other indicators of BRICS economies precisely at the 2008 global financial crisis. Comparing the situations BFC and AFC can provide a better perspective. Afterwards, it can show us what happens to economies when they are faced with crises. From what has been examined, it seems that BRICS countries are not homogeneous and that BS are special cases.
The findings suggest that, indeed, the capacity to increase productivity was strongly affected, but not in the same way for all of the BRICS countries. The global financial crisis was better managed in BRICS countries than the authors had hypothesised. Productivity average growths were not equal, nor bigger, AFC for the BRICS countries; however, they performed better in comparison to G7 countries in terms of TFP growths in the longer term. The share of labour compensation did not decrease and unemployment did not grow after the crisis. Instead, BRICS countries have not lost the capacity to increase productivity, although it grew slower AFC, except for BS.
Finally, to answer the final question: were BRICS countries positively affected by the crisis in all the variables assessed? Based on the results of the data, it can be deduced that the effects of the crisis on the BRICS countries were positive, despite the TFP's growth capacity, which experienced a decrease. Nevertheless, the BRICS countries' performances were not homogeneous, at least in terms of the TFP, as South Africa experienced a huge decrease while Russia experienced a great advance. With this fact in mind, the authors consider it better to state that the BRICS countries' performance prior to the studied variables was mainly good, with some exceptions occurring, such as the ones cited herein.
This work is not exhaustive concerning the productivity of BRICS countries and, indeed, encourages new research opportunities. Brazil deserves investigation to deepen the knowledge of that economy because this study was written in 2018 when data were limited prior to that government's corruption disclosure that was estimated at billions of dollars - which may have affected the numbers more than what can be seen in this article. South Africa deserves to be observed in many ways, and themes need to be clarified. Many studies have shown that South Africa was observing productivity difficulties and opportunities long before the financial crisis, as shown in Maritz (2002), Du Preez (2002) and Uys and Blaauw (2006), among others. Policymakers can use the evidence provided in this article to amplify economic policies and to reorganise productivity drivers in BRICS countries.1
Other limitations of this study are the short period studied, which does not permit us to make definite conclusions. Longer periods must be studied, and other key variables that affect directly or indirectly productivity should be investigated to broaden this research work. The homogeneity of the BRICS - as pledged by O'Neill (2001) - should also be examined, especially because it was not possible to delve into this, for the purpose of our objectives.
Acknowledgements
The authors would like to thank the peer reviewers for their time to review this article.
Competing interests
The authors declare that they have no have no financial or personal relationships that may have inappropriately influenced them in writing this article.
Authors' contributions
A.H. was responsible for data analysis, data interpretation and manuscript compilation. T.M. performed literature review and manuscript review. C.C. performed data interpretation and manuscript review.
Funding
This research received no specific grant from any funding agency in the public, commercial or not-for-profit sectors.
Data availability statement
Data sharing is not applicable to this article as no new data were created or analysed in this study.
Disclaimer
The views and opinions expressed in this article are those of the authors and do not necessarily reflect the official policy or position of any affiliated agency of the authors.
References
Abel, A.B., Bernanke, B. & Croushore, D.D., 2014, Macroeconomics, 8th edn., J. Holcomb (ed.), Pearson, New York. [ Links ]
Almeida, P.R., 2009, 'The BRICS' role in the global economy', Trade and International Negotiations for Journalists 146-154, viewed 15 January 2018, from http://www.brics.unipr.it/paper/deAlmeida_2009.pdf. [ Links ]
Anderson, D.R., Sweeney, D.J. & Williams, T.A., 1998, Statistics for business and economics, 7th edn., D.L. Shaut, C.E. McCormack & A.C. Denny (eds.), 7th edn., Southwestern College, Washington, DC. [ Links ]
Baier, S.L., Dwyer, G.P. & Tamura, R., 2002, Correlation between TFP and alpha: How important are capital and total factor productivity for economic growth?, Federal Reserve Bank of Atlanta, Atlanta, viewed 15 January 2018, from https://www.frbatlanta.org/-/media/documents/filelegacydocs/wp0202a.pdf. [ Links ]
Becker, S.O., 2013, Reversals of fortune? A long-term perspective on global economic prospects, Centre for Competitive Advantage in the Global Economy, University of Warwick, Coventry. [ Links ]
Bezuidenhout, H., Grater, S. & Kleynhans, E.P.J., 2018, 'The global value chain dimension of foreign direct investment flows in the agro-industrial sector of South Africa, 2003-2014', Acta Commercii 18(1), 13. https://doi.org/10.4102/ac.v18i1.560 [ Links ]
Bianconi, M., Yoshino, J.A. & Machado de Sousa, M.O., 2013, 'BRIC and the U.S. financial crisis: An empirical investigation of stock and bond markets', Emerging Markets Review 14(1), 76-109. https://doi.org/10.1016/j.ememar.2012.11.002 [ Links ]
Bliss, C.J. & Bliss, C.J., 1975, 'Marginal products and capital', Capital Theory and the Distribution of Income 35(2), 93-118. https://doi.org/10.1016/B978-0-7204-3604-4.50011-5 [ Links ]
Bohm-Bawerk, E., 1907, 'Capital and interest once more: II. A relapse to the productivity theory', The Quarterly Journal of Economics 21(2), 247. https://doi.org/10.2307/1883433 [ Links ]
Branco, R.C., 2015, The BRICS: Some historical experiences, growth challenges and opportunities, Center for Growth and Economic Development, Fundação Getulio Vargas, São Paulo, viewed 15 January 2018, from https://www.google.com.br/url?sa=t&rct=j&q=&esrc=s&source=web&cd=1&cad=rja&uact=8 &ved=0ahUKEwihtJW2ytrYAhUCk5AKHd7cCH4QFggoMAA& url=http%3A%2F%2Fbibliotecadigital.fgv.br%2Fdspace%2Fhandle%2 F10438%2F14079&usg=AOvVaw00itrBlxe_BZe9wfpVkQzP. [ Links ]
Brecher, R.A., Choudhri, E.U. & Schembri, L.L., 1996, 'International spillovers of knowledge and sectoral productivity growth: some evidence for Canada and the United States', Journal of International Economics 40(3-4), 299-321. https://doi.org/10.1016/0022-1996(95)01406-3 [ Links ]
Chaudhary, L., Musacchio, A, Nafziger, S. & Yan, S., 2012, 'Big BRICs, weak foundations: The beginning of public elementary education in Brazil, Russia, India, and China, 1880-1930', Explorations in Economic History 49(2), 221-240. https://doi.org/10.3386/w17852 [ Links ]
Comin, D., 2006, 'Total factor productivity', in S.N. Durlauf & L.E. Blume (eds.), The new Palgrave dictionary of economics, viewed 15 January 2018, from www.people.hbs.edu/dcomin/def.pdf. [ Links ]
Cobb, C.W. & Douglas, P.H., 1928, 'A theory of production', The American Economic Review 18(1), 139-165. [ Links ]
Crafts, N., 2008, What creates multi-factor productivity? The Conference Board, Frankfurt, viewed 15 January 2018, from https://warwick.ac.uk/fac/soc/economics/staff/…/mfp.pdfLinks ] Arial, Helvetica, sans-serif" size="2">.
Dorfman, J., 1964, 'Wicksteed's recantation of the marginal productivity theory', Economica 31(123), 294. https://doi.org/10.2307/2550625 [ Links ]
Du Preez, J., 2002, 'The depletion of the human resources pool in South Africa', Acta Commercii 2(1), 80-84. https://doi.org/10.4102/ac.v2i1.32 [ Links ]
Fontagné, L., Foure, J. & Ramos, M.P., 2012, 'A general equilibrium long-term path of the world economy', 15th Annual Conference on Global Economic, GTAP, Geneva, viewed 15 January 2018, from https://www.gtap.agecon.purdue.edu/resources/…/6027.pdfLinks ] Arial, Helvetica, sans-serif" size="2">.
Georgescu-Roegen, N., 1935, 'Fixed coefficients of production and the marginal productivity theory', The Review of Economic Studies 3(1), 40. https://doi.org/10.2307/2967570 [ Links ]
Hamburg, M., 1977, Statistical analysis for decision making, 4th edn., H.B. Jovanovich (ed.), Harcourt Brace, New York. [ Links ]
Jorgenson, D.W. & Griliches, Z., 1967, 'The explanation of productivity change', The Review of Economic Studies 34(3), 249. https://doi.org/10.2307/2296675 [ Links ]
Kaldor, N., 1966, 'Marginal productivity and the macro-economic theories of distribution: Comment on Samuelson and Modigliani', The Review of Economic Studies 33(4), 309. https://doi.org/10.2307/2974428 [ Links ]
Kaldor, N., 1968, 'Productivity and growth in manufacturing industry: A reply', Economica 35(140), 385. https://doi.org/10.2307/2552347 [ Links ]
Kim, S. & Saravanakumar, M., 2012, 'Economic reform and total factor productivity growth in Indian manufacturing industries', Review of Development Economics 16(1), 152-166. https://doi.org/10.1111/j.1467-9361.2011.00652.x [ Links ]
Kregel, J., 2009, The global crisis and the implications for developing countries and the BRICs: Is the B really justified?, Public Policy Brief No. 102, The Levy Economics Institute, viewed 15 January 2018, from www.levy.org/pubs/ppb_102.pdf. [ Links ]
Kuh, E., 1967, 'A productivity theory of wage levels-An alternative to the Phillips curve', The Review of Economic Studies 34(4), 333. https://doi.org/10.2307/2296554 [ Links ]
Lewis, W.W., 2004, 'The power of productivity: Wealth, poverty, and the threat to global stability', Foreign Affairs 83(3), 139. https://doi.org/10.2307/20033990 [ Links ]
Mallick, J., 2015, Globalisation, structural change and labour productivity growth in BRICS economy, FIW Working Paper No. 141, 1, 145, viewed 15 January 2018, from https://www.econstor.eu/handle /10419/121142. [ Links ]
Maritz, G., 2002, 'The most critical issues facing managers in South Africa today', Acta Commercii 2(1), 35-40. https://doi.org/10.4102/ac.v2i1.14 [ Links ]
Miller, S.M. & Upadhyay, M.P., 2000, 'The effects of openness, trade orientation, and human capital on total factor productivity', Journal of Development Economics 63(2), 399-423. https://doi.org/10.1016/S0304-3878(00)00112-7 [ Links ]
Mobarek, A. & Fiorante, A., 2014, 'The prospects of BRIC countries: Testing weak-form market efficiency', Research in International Business and Finance 30(1), 217-232. https://doi.org/10.1016/j.ribaf.2013.06.004 [ Links ]
Naudé, W., Szirmai, A. & Haraguchi, N., 2016, 'Structural transformation in Brazil, Russia, India, China and South Africa (BRICS)', Working Paper Series (16), Maastricht University, Maastricht, The Netherlands, viewed 15 January 2018, from https://www.merit.unu.edu/publications/working-papers/abstract/?id=5998. [ Links ]
Noah, A. & Ichoku, H.E., 2015, 'Total factor productivity dynamics in sub-Saharan Africa: Malmquist index approach', International Business and Management 10(3), 54-73. www.cscanada.net/index.php/ibm/article/viewFile/…/pdf_157 [ Links ]
OECD, 2001, 'Overview of productivity measures', in Measuring Productivity - OECD Manual, Number 2, pp. 11-21, viewed 15 January 2018, from https://doi.org/10.1787/9789264194519-en [ Links ]
O'Neill, J., 2001, Building better global economic BRICs, Global Economics Paper, London, November, vol. 66, pp. 1-16, viewed 15 January 2018, from https://www.gs.com [ Links ]
Ostroy, J.M., 1984, 'A reformulation of the marginal productivity theory of distribution', Econometrica 52(3), 599. https://doi.org/10.2307/1913467 [ Links ]
Ouyang, Y., 2016, 'Case: Human capital advantages of late-developing large countries', in Springer Singapore (ed.), The development of BRIC and the large country advantage, 2nd edn., pp. 127-148, Springer, Singapore. [ Links ]
Prescott, E.C., 1998, 'Lawrence R. Klein Lecture 1997: Needed: A theory of total factor productivity', International Economic Review 39(3), 525. https://doi.org/10.2307/2527389 [ Links ]
Stigler, G.J., 1947, 'Stuart wood and the marginal productivity theory', The Quarterly Journal of Economics 61(4), 640. https://doi.org/10.2307/1885053 [ Links ]
Triplett, J.E., 1999, 'Economy statistics, the new economy, and the productivity slowdown', Business Economics 34(2), 13-17. [ Links ]
Uys, M.D. & Blaauw, P.F., 2006, 'The dual labour market theory and the informal sector in South Africa', Acta Commercii 6(1), 122. https://doi.org/10.4102/ac.v6i1.122 [ Links ]
Wilson, D. & Purushothaman, R., 2003, Dreaming with BRICs: The path to 2050, Goldman Sachs Economic Research Group, Global Economics Paper, 99, viewed 15 January 2018, from https://www.google.com.br/url?sa=t&rct=j&q=&esrc=s&source=web&cd=2&ved=0ahUKE wjw87KGzdrYAhUEF5AKHZLiBPMQFgg0MAE &url=http%3A%2F%2Favikdgreat.tripod.com%2 FInterestingReads%2FBRIC_GoldmanSachs.pdf&usg=AOvVaw20y0x0JlqJa1snaBBsNcuX. [ Links ]
Wolfe, J.N., 1968, 'Productivity and growth in manufacturing industry: Some reflections on professor Kaldor's inaugural lecture', Economica 35(138), 117. https://doi.org/10.2307/2552125 [ Links ]
Yotopoulos, P.A., 1965, 'The "Wage-Productivity" theory of underemployment: A refinement', The Review of Economic Studies 32(1), 59. https://doi.org/10.2307/2296332 [ Links ]
Zheng, J., Bigsten, A. & Hu, A., 2009, 'Can China's growth be sustained? A productivity perspective', World Development 34(4), 874-888. https://doi.org/10.1016/j.worlddev.2008.07.008 [ Links ]
Zhong, M., Chang, T. & Tzeng, H.W., 2014, 'International equity diversification between the United States and BRICS countries', Romanian Journal of Economic Forecasting XVII(1), 123-138. https://www.google.com.br/url?sa=t&rct=j&q=&esrc=s&source=web&cd=1&ved=0ahUKEwj-7eaR3NrYAhWKkpAKHXtwBtoQFggoMAA&url=http%3A%2F%2Fwwwipe.ro%2Frjef%2Fr jef1_14%2Frjef1_2014p123-138.pdf&usg=AOvVaw02J-4PDuIUoywcYHvHNvm. [ Links ]
Zondo, R.W.D., 2017, 'Evaluating the effectiveness of a gainsharing programme for labour productivity improvement', Acta Commercii 17(1), 10. https://doi.org/10.4102/ac.v17i1.498 [ Links ]
 Correspondence:
Tankiso Moloi
smoloi@uj.ac.za
Received: 04 May 2018
Accepted: 13 Feb. 2019
Published: 19 Aug. 2019
1 . Available at https://data.worldbank.org/indicator/SL.UEM.TOTL.ZS?end=2017&locations=BR-CN-IN-RU-ZA&start=2000. See Appendix 1, Table 2-A1.

