


Serviços Personalizados
Artigo
 Inglês (pdf)
 Artigo em XML
 Referências do artigo
Indicadores

Links relacionados
-
 Citado por Google
 -
 Similares em Google
Compartilhar

 Permalink
Acta Commercii
versão On-line ISSN 1684-1999
versão impressa ISSN 2413-1903
Acta Commer. vol.18 no.1 Johannesburg 2018
http://dx.doi.org/10.4102/ac.v18i1.471
ORIGINAL RESEARCH
Customer experiences and return patronage in airport hotels: Evidence from OR Tambo International Airport, South Africa
Oswald Mhlanga
School of Hospitality and Tourism Management, University of Mpumalanga, South Africa
ABSTRACT
ORIENTATION: Although OR Tambo International Airport is the busiest airport in Africa, hotel occupancies and revenue per available room at or near the airport have been lower than the industry average.
RESEARCH PURPOSE: The aim of this research was to gain an improved understanding of customer experiences and return intentions in hotels at or near OR Tambo International Airport.
MOTIVATION FOR THE STUDY: The research was pursued to determine hotel attributes that are important for customer experiences and return intentions in hotels at or near OR Tambo International Airport. To determine the difference in domestic visitors' experiences and return intentions in hotels and to determine a difference in customers' experiences and return intentions in the respective hotels.
RESEARCH DESIGN, APPROACH AND METHOD: This study was mainly quantitative with some qualitative elements. A meeting was held with five hoteliers and airport management (qualitative), and 400 return guests of hotels at or near OR Tambo International Airport successfully completed questionnaires (quantitative).
MAIN FINDINGS: The findings showed that 'reliability', 'empathy' and 'assurance' are important attributes contributing to customers' experiences in hotels at or near airports. Reliability and overall hotel experience were regarded as important attributes for hotel customers' decision to return to hotels in airports.
PRACTICAL/MANAGERIAL IMPLICATIONS: To improve customer experiences, hoteliers should emphasise more the following attributes: 'reliability', 'empathy' and 'assurance'.
CONTRIBUTION/VALUE-ADD: To the best of the researchers' knowledge, this study is a first attempt to determine customer experiences and return patronage in hotels at or near airports in South Africa. The results could help airport hotels to gain a competitive advantage over other hotel categories.
Introduction
As airports compete for travellers, they are shifting focus from their core activity of passenger and goods transportation to a more commercial approach (Fogarty 2015). Under the commercial approach, airports have diversified into various non-aeronautical activities, which were initially considered secondary to their service portfolio (Skift 2013). The purpose is to reduce their dependency on airlines and to differentiate themselves from other airports (Martin 2015). Consequently, it has become common practice for airports to add hotels into their service portfolio (Zenglein & Müller 2007) and OR Tambo International Airport (in Johannesburg, South Africa) is no exception.
Although OR Tambo International Airport is the biggest and the busiest airport in Africa (Statistics South Africa 2016), hotel occupancies at or near the airport have been low (Forster 2017), with hotels realising below-industry-average revenue per available room (RevPAR) (Price Waterhouse & Coopers [PWC] 2016a). Forster (2017) claims that the low hotel occupancies do not match the growth in domestic travellers at the airport. According to PWC (2016a), identifying customer experiences and return patronage could improve customer loyalty and significantly unlock a hotel's potential for future financial sustainability.
Research confirms the strategic importance of customer experiences to hotels. Positive experiences have a direct impact on hotels' financial performance (Hooper, Coughlan & Mullen 2013; Luo & Qu 2016; Marković & Janković 2013; Stefano et al. 2015), long-term survival (Karunaratne & Jayawardena 2010; Khattab & Aldehayyat 2011; Saghie 2015) and positive word-of-mouth communications (Atasie 2010; Holjevac, Marković & Raspor 2009; Kumar 2015; Schall, 2003). In the extant literature, various scholars (see works by Choi & Chu 2001; Enemuo, Ejikeme & Edward 2016; Forones 2013; Martin 2015) posit that a positive hotel experience is crucial for customer retention.
Although an overwhelming number of scholars (Forones 2013; Jowaheer & Ross 2003; Namasivayam & Denizci 2006; Tsang & Qu 2000) have investigated customer experience and return patronage, there has been no consensus on the link between the two variables with scholars reporting contradicting findings on the number and nature of the dimensions influencing the two variables. Although research has been conducted on customer experiences and return patronage in hotels, there is a paucity of research on this topic in South Africa. The analysis of customer experiences and return patronage in hotels is restricted to research papers in developed countries in Europe and the United States. Studies in developed countries might not be applicable to a developing context as Prayag (2017) claims that studies on hotel customer experiences in developed countries should not be generalised to developing countries because of the different demographic characteristics of guests which have an influence on customer experiences.
As far as can be ascertained, there is no research on customer experiences and return patronage in hotels at or near airports in a developing world context. In light of changing airport economics and the importance of hotels to the tourism industry, research within this context is necessary. The theoretical contribution relates to critically articulating customer experiences and return patronage from a developing context, where such findings could mirror similarities and differences and inform hoteliers of strategic implications that could be useful for marketing and management endeavours. In this study, the terms 'return intention' and 'return patronage' are used interchangeably to mean the same, while the term 'hotel' is used to refer to 'airport hotels'.
Study context
Over the last couple of decades, tourism has been recognised as playing a significant role in global and national economies (Moolman 2011). According to the World Travel and Tourism Council (WTTC 2017), the travel and tourism industry generated 108 741 000 jobs directly in 2016 (3.6% of total employment) and supported 6 million net additional jobs. In total, travel and tourism generated US$7.6 trillion (10.2% of global gross domestic product [GDP]) and 292 million jobs in 2016, equivalent to 1 in 10 jobs in the global economy. Tourism is predicted as supporting over 380 million jobs by 2027 (WTTC 2017).
According to Lombard (2016), data from Statistics South Africa reports that the tourism industry in South Africa recorded a growth of 6.6% between 2013 and 2014, exceeding the average global growth in the sector, whereas the direct GDP from tourism rose from ZAR 93.5 billion in 2012 to ZAR 103.6 billion in 2013. The industry contributed 9% to South Africa's GDP in 2015, exceeding the global average growth in the sector, whereas in 2016, the tourism industry directly contributed ZAR 127 billion to South Africa's GDP, an increase of 7% from the previous year (Lombard 2016). Furthermore, the Culture, Arts, Tourism, Hospitality and Sport Sector Education and Training Authority (CATHSSETA 2016) asserts that tourism directly employs more people than do the mining, communication services, automotive manufacturing and chemicals manufacturing sectors. To illustrate the point, of the total number employed in South Africa, including in both the formal and informal sectors, 1 in 25 individuals works in the tourism sector (Lombard 2016). To be precise, 4.5% of the total workforce was directly employed in the sector during 2014, being an increase from the 3.8% recorded for 2015 (Lombard 2016).
Hotels are classified under the tourism industry in Western economies and are regarded as one of the largest sectors of the Western economies (Gupta & Srivastava 2011). For instance, hotels represent the second largest subsector in the Belgian hospitality sector on a turnover basis, accounting for 14% of the sector's turnover in 2010 (National Hotel Association 2015). In Croatia, hotels represent an important part of the economy, with a direct turnover of €2.3 billion and direct employment of over 90 000 individuals in 2013 (HOTREC 2013). In the Czech Republic, hotels support a total of 306 000 jobs, representing over 6% of the total workforce, and contributed 3.1% to the Czech GDP in 2009. In Switzerland, hotels generated over one-third of the revenue in the hospitality sector in 2009 (HOTREC 2013).
In South Africa, hotels are classified under the hospitality subsector which is part of the tourism industry (CATHSSETA 2016). Hotels are therefore a critical cornerstone of the hospitality subsector, which is a pillar of the tourism industry (RSA NDT 2011). The hospitality subsector has grown increasingly quickly over the last decade (from 2006 to 2016) and is one of the fastest growing sectors in the economy of South Africa (Lombard 2016). The Tourism Satellite Account for 2010 (SSA 2010) estimated that in 2009 the subsector generated ZAR 179 billion of economic activity and a total of 1 011 000 jobs, representing 7.6% of total employment. The hospitality subsector therefore plays a significant role as a modern day engine of economic growth (Moolman 2011).
According to PWC (2016b), hotels provided for 45 000 jobs through direct employment and generated ZAR 17.3 billion in 2013 accounting for 71% of total accommodation revenue in South Africa. Price Waterhouse & Coopers (2016b) further estimates that by 2018 there will be about 63 600 hotel rooms available, up from 60 900 in 2013 with total room revenue expected to reach ZAR 28.7 billion in 2018 up from ZAR 17.3 billion in 2013. Growing domestic visitors fuelled by the depreciation of the rand and an increase in low cost carriers (LCCs) have positively impacted on the hotel industry in South Africa (PWC 2016b).
Furthermore, the growing income of the black middle class people in South Africa has increased the demand for air travel (Maqutu 2013) and positively impacted on hotels (PWC 2016b). However, despite an increase in domestic travellers (Lombard 2016), hotel occupancies at or near OR Tambo International Airport have been low with hotels realising below-industry-average RevPAR (PWC 2016b). Forster (2017) claims that the low occupancies are because of the hotel's inability to identify hotel attributes that improve customer experiences and increase customer loyalty.
Furthermore, some research endeavours (Marković & Janković 2013; Namasivayam & Denizci 2006; Tsang & Qu 2000) argue that it has become increasingly difficult to satisfy hotel customers, with many progressively demanding a more memorable experience than before. Customers have become savvier in terms of their choices and demands. They are no longer looking for white-linen service and bellboys to carry their luggage up to their room or a concierge (Mhlanga & Tichaawa 2016). When guests check into a hotel, they want to feel completely at home, connected and to be in a hotel setting where they can be part of an experience (Forster 2017). Therefore, the changing nature of guests is prompting hotels to change their strategies (Stefano et al. 2015).
Theoretical background
Parasuraman, Zeithaml and Berry (1985) developed a service quality model, the SERVQUAL approach, after realising the significance of service quality for the survival and success of service companies and the need for a generic instrument which would be used to measure service quality across a broad range of service categories. The model proposed a five-dimensional construct of perceived service quality - tangibles, reliability, responsiveness, assurance and empathy, with items reflecting both expectations and perceived performance - and comprised a 22-item scale for measuring customers' expectations and perceptions.
According to Parasuraman et al. (1985:42), tangibles refer to 'the degree to which physical facilities, equipment, and appearance of personnel are adequate', while reliability refers to 'the degree to which a promised service is performed dependably and accurately'. Responsiveness refers to 'the degree to which service providers are willing to help customers and provide prompt service', while assurance refers to 'the extent to which service providers are knowledgeable, courteous, and able to inspire trust and confidence'. Empathy refers to 'the degree to which the customers are offered caring and individualised attention'.
However, Cronin and Taylor (1994) suggested that the measurement of service quality could be accomplished by using only the perception of customer experience rather than measuring the gap between expectation and actual experience of the service by customers. Cronin and Taylor (1994) later modified the SERVQUAL and named it SERVPERF which is only used to assess perceived service performance using a seven-point scale. The SERVPERF model resulted in a reduction of the items on the questionnaire as there were only 22 items, leaving out the 22 questions on customers' expectations (Ali et al. 2017).
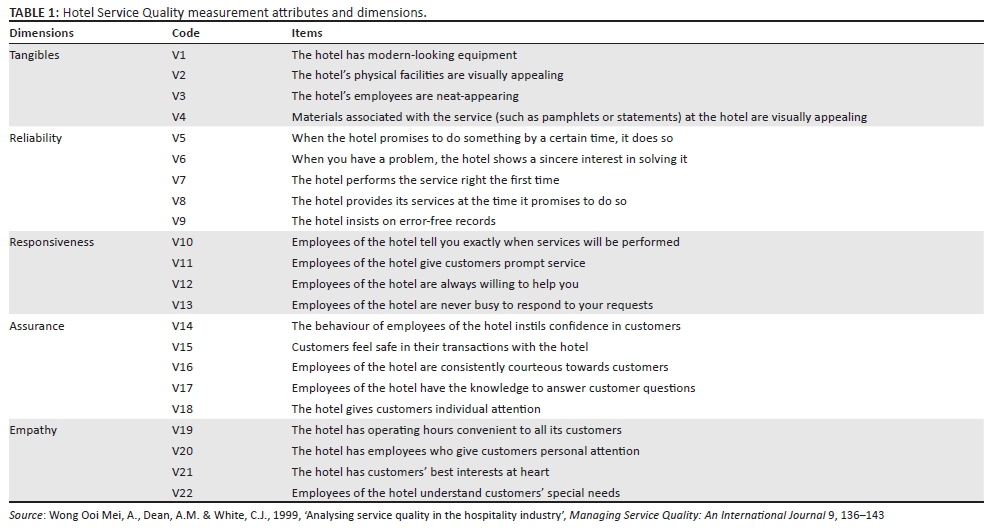
In 1995, Stevens, Knutson and Patton (1995) developed a modified version of SERVQUAL, named LODGSERV, which measures the expectations of hotel guests in terms of service quality using a 26-item index developed on the five dimensions of SERVQUAL. Subsequently, Stevens et al. (1995) created a different version of SERVQUAL to measure the quality of service in restaurants, which was named DINESERV. It was later refined by Wong Ooi Mei, Dean and White (1999) to suit the hotel industry and given a different name, HOLSERV. It comprised a 22-item scale with the following five dimensions, namely tangibles, reliability, responsiveness, assurance and empathy (Table 1).
However, an alternate scale (HOTSPERF) was developed, which is a modification of the SERVQUAL and SERVPERF, comprising 25 attributes to accommodate the developmental level of hotel services and using only five-point Likert scales to simplify the range of choices posed to the customers who respond to the various questions on the questionnaire (Bernhardt, Donthu & Kennett 2000). In the HOTSPERF, three more attributes were added, rewording the SERVQUAL attributes to read positively, using a five-point Likert scale, with only two measurement dimensions (Jensen & Hansen 2007).
Literature review
Researchers have been reporting contradictory findings on customer experiences and return patronage in hotels. In 2001, Choi and Chu (2001) found that staff quality, room quality and value for money were the top three hotel factors impacting on customers' experiences, while in 2003, Ekinci, Prokopaki and Cobanoglu (2003) discovered that tangible and intangible dimensions are the two separate dimensions impacting on customer experiences of hotels. In 2006, Akbaba (2006) studied customer experiences of business hotel customers and concluded that five customer experience dimensions, namely tangibles, adequacy in service, quality, assurance, understanding and caring and convenience, were the important determinants of customer experiences in hotels. In 2010, Marković and Raspor (2010) found that the main dimensions influencing customer experiences in hotels, in order of importance, were 'reliability', 'empathy and competence of staff', 'accessibility', and 'tangibles'.
Mohammad and Alhamadani (2011) identified five hotel dimensions that had a significant influence on customer experiences, namely empathy, tangibles, reliability, responsiveness and assurance. Fah and Kandasamy (2011) conducted a study in Malaysian hotels and found that empathy and competence of staff, and reliability were the two most important determinants of guests' experiences. In 2013, Marković and Janković (2013) explored the relationship between service quality and customer experiences in Croatian hotels and found reliability, accessibility and tangibles dimensions as the most important determinants of guests' experiences.
Torres et al. (2013) studied guests' experiences in upscale hotels in the United States and found 'empathy and competence of staff' as the most important determinants of guests' experiences. Mhlanga and Tichaawa (2016) investigated guests' expectations and experiences in hotels in Nelspruit, South Africa, and found that guests' experiences were significantly impacted by reliability, accessibility and tangibles dimensions. Nonetheless, none of the studies researched hotel experiences and return intentions in hotels at or near airports.
The link between hotel experiences and return patronage is unclear. Previous research studies (Jowaheer & Ross 2003; Marković & Janković 2013; Mhlanga & Tichaawa 2016; Tsang & Qu 2000; Williams & Buswell 2003) noted that overall hotel experience significantly influences customers' return patronage. Nonetheless, Saleh and Ryan (1992) and Mei et al. (1999) noted that reliability was a significant contributor to customers' return patronage, while assurance was found not to be a significant contributor to customers' return intention.
Research objectives
The research was pursued with the following objectives in mind:
To determine hotel dimensions that are important for customer experiences and return intentions in hotels. To determine the difference in domestic visitors' experiences and return intentions based on their demographic characteristics. To determine the difference in customers' experiences and return intentions in the respective hotels.
Research methodology
OR Tambo International Airport houses leading retail outlets, a chain of restaurants, car rental companies, a train station (Gautrain), banks, money markets, airline offices and hotels (CATHSSETA 2016). There are two hotels in the premises of the airport, while 14 are in close proximity. The hotels were chosen based on their location. Only hotels situated at or near OR Tambo International Airport were targeted.
These hotels had to comply with the criteria set by Tourism Grading Council of South Africa (TGCSA 2017) for classification as a hotel, namely:
an establishment that provides formal accommodation with full or limited service to the travelling public. A hotel must have a reception area and also offer a dining facility. It must also have a minimum of 6 rooms but more likely exceeds 20 rooms. (p. 3)
A mixed-methods research design (McMillan & Schumacher 2010) was followed. To incorporate content validity, a tentative meeting (qualitative) was scheduled by the researcher with hoteliers at or near the airport and the airport management. Content validity connotes the extent to which a measurement instrument is a representative sample of the content area being measured (Leedy & Ormrod 2013). After the meeting, a research questionnaire (quantitative) was designed and distributed to hotel customers for data collection.
Two suggestions were made by hoteliers. These suggestions guided the research design of the study. Initially, hoteliers suggested that to measure return patronage only guests that had previously stayed at least twice in hotels at or near the airport in the past 6 months should be targeted. Secondly, hoteliers cautioned that the research should not inconvenience guests during check out. Consequently, it was suggested that the research questionnaire should be less than three pages and easy to comprehend.
A self-administered questionnaire based on the HOLSERV model developed by Wong Ooi Mei et al. (1999) was customised to address the objectives and setting of the study. As in the HOLSERV model, the questionnaire contained 22 items for measuring customer experiences and return patronage. These attributes represented five dimensions (tangibles, reliability, responsiveness, assurance and empathy). Some research endeavours (Marković & Janković 2013; Mhlanga & Tichaawa 2016; Tsang & Qu 2000) identify these five dimensions as the most important that measure customer experiences and return patronage; hence, they were adopted for this study.
The questionnaire consisted of two parts. The first part had a screening question to identify the target sample of domestic visitors who had previously stayed in a hotel at or near OR Tambo International Airport in the past 6 months, and respondents' demographic characteristics, which included gender, age, education, home language and monthly income. The second part measured customers' experiences and return intention. Customers' experiences were measured using a modified SERVQUAL model and intent to return to the hotel (return patronage) was assessed using a repurchase intentions scale (Johnson & Christensen 2004). As in the SERVPERF model by Cronin and Taylor (1994), customer experiences were measured on a seven-point Likert-type scale, consisting of very low (1), low (2), somewhat low (3), indifferent (4), somewhat high (5), high (6) and very high (7). The response alternatives for customers' return intention to the hotel were most definitely not (1), definitely not (2), probably not (3), unsure (4), probably (5), definitely (6) and most definitely (7). As in the HOTSPERF model, all the statements in the questionnaire were positively worded.
The population of the study comprised all the hotel customers of the airport. In order to measure customers' return intention, only domestic visitors who had previously stayed in a hotel at or near OR Tambo International Airport in the past 6 months were targeted. The questionnaire items were phrased in English, not only because the majority of hotel guests were expected to be quite conversant in English but also because it is one of the main languages spoken in Johannesburg, South Africa, apart from IsiXhosa, IsiZulu and Afrikaans. Therefore, all respondents were able to respond in English. Johnson and Christensen (2004) point out that a questionnaire should be phrased in the language that the respondents will easily understand and should be precise to maintain interest and to ensure reliability of the responses.
In order to guarantee equal representation of each of the hotels, proportional stratified random sampling was used to find the sample size for a particular hotel taking into account the hotel's occupancy. The sample size per hotel in this study was calculated at 25% of each hotel's occupancy. This sampling method is comparable to the technique used by Marković and Janković (2013). These researchers calculated the sample size per hotel at 25% of each hotel's occupancy per day and used the following formula:
Sample Size = (Z-score)2 × Std Dev × (1-Std Dev) / (margin of error)
Consequently, with a proportional sample of 25% of each hotel's occupancy per day, a confidence level of 95%, margin of error at 6.5% and standard deviation being 0.5, it was ensured that the sample would be large enough and this resulted in a sample size of at least 397 respondents.
Systematic sampling, which is a probability sampling method, was then used to select respondents by systematically moving through the sample frame and selecting every kth element (Leedy & Ormrod 2013). This method is useful in situations where the population members arrive at a certain location over time (Marković & Raspor 2010). As such, respondents were selected by systematically targeting every fourth guest who checked out of the hotel until the sample size for a particular hotel was reached.
A decision to target every fourth guest was made in order to be discreet and avoid annoying other guests who were not participating in the survey, as advised by Mhlanga and Tichaawa (2016). The hotel manager from each participating hotel was approached for permission to conduct the study. Data were collected in August 2016 from Fridays to Mondays, during check out as recommended by various researchers (Marković & Janković 2013; Marković & Raspor 2010; Mhlanga & Tichaawa 2016). This is done to maximise chances of eliciting information from guests of different lifestyles, occupation, income, age and gender (Tsang & Qu 2000).
The following procedures were used to collect data. The researcher systematically approached every fourth guest who was checking out of the hotel at the reception after they had settled the bill or as they were leaving the reception. The researcher explained the aim of the study to the guests and asked them to participate. It was emphasised that the researcher would treat the information provided as confidential and anonymous.
Hotel guests who were willing to participate in the study received a questionnaire. Completed questionnaires were collected, checked and discussed with the respondents in case of any queries. Out of the 416 returned questionnaires, 16 were not included in the analysis because of incompleteness. Data were analysed using the Statistical Package for Social Sciences (SPSS) software version 23, which enabled the generation of descriptive and bivariate statistics for the interpretation of the results. The Cronbach's α coefficient index for the total index was high (0.8766), while high reliability coefficients were calculated for tangibles (0.8619), reliability (0.8518), responsiveness (0.8522), assurance (0.8572), empathy (0.8652), overall customer experiences (0.8399) and return patronage (0.8807).
Findings
Results and discussion
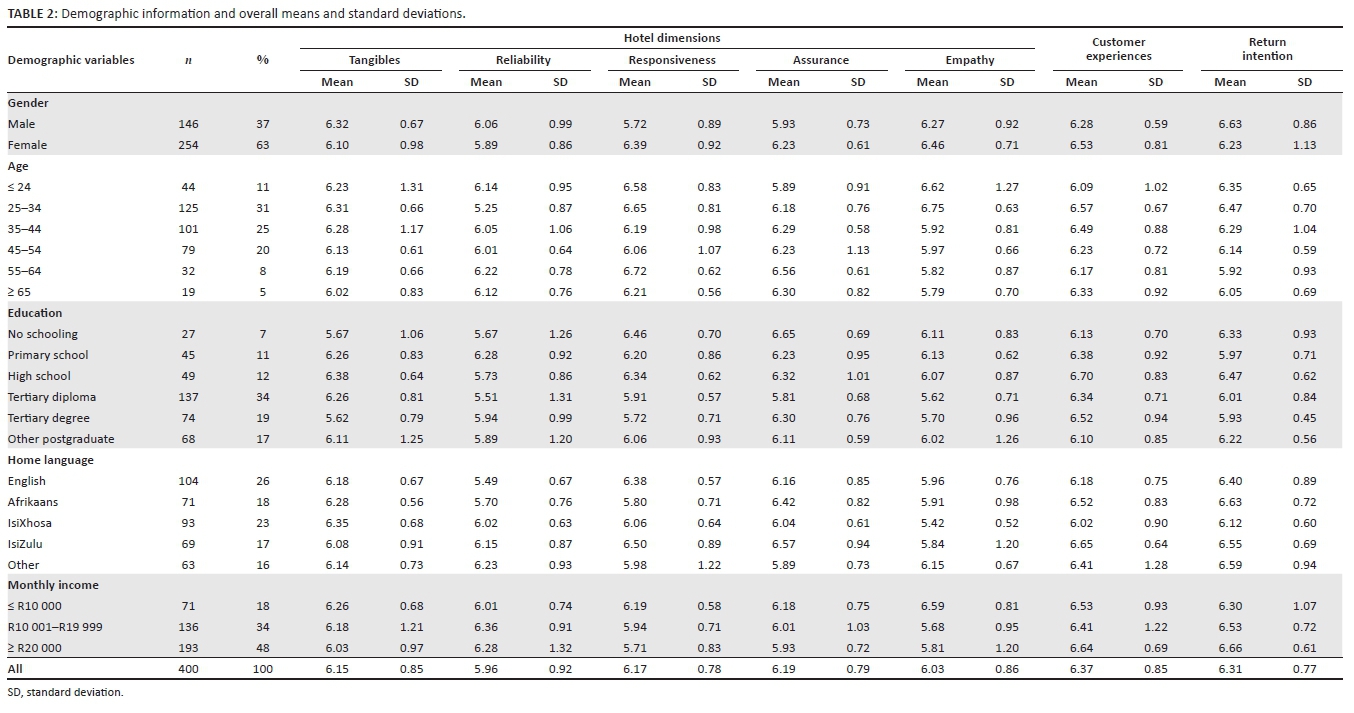
Overall, 400 valid questionnaires were completed, which corresponded with the targeted sample size in each hotel. The respondents' demographic characteristics are shown in Table 2 of which 37% (n = 146) were male. The median age of the respondents was 34 years (inter-quartile range: 23-44 years) and 31% (n = 125) of the respondents were in the age group of 25 to 34 years, while 26% (n = 104) of the respondents used English as their home language.
Table 2 reveals that respondents' experience scores ranged from 5.96 (reliability) to 6.19 (assurance), with seven being the highest possible score. Hotel customers reported a high to a very high score with the overall hotel experience (6.37) and reported a high score with return patronage (6.31). Standard deviations ranged from 0.77 (return intention) to 0.92 (reliability).
Table 2 further reveals that customers with different demographic characteristics rated their experience with the five hotel dimensions (tangibles, reliability, responsiveness, assurance and empathy) in the range of somewhat high experience score (5.25) to very high experience score (6.75) and reported a high to very high total experience score (6.02 to 6.70). Customers in the 25-34 year age group reported the highest total experience score (6.57) and the highest return patronage (6.47). Customers in the 25-34 year age group reported the lowest experience score for reliability dimension (5.25). Customers with a monthly income above R20 000 reported the highest overall experience score (6.64) and the highest return patronage score (6.66).
Correlation coefficient and regression analysis were used to investigate the relationship between customer experiences (dependent variable) and the five hotel dimensions (independent variables) and the relationship of return intention (dependent variable) with the five hotel dimensions and customer experiences (independent variables). Table 3 presents the correlation results of customer experiences and return intention.
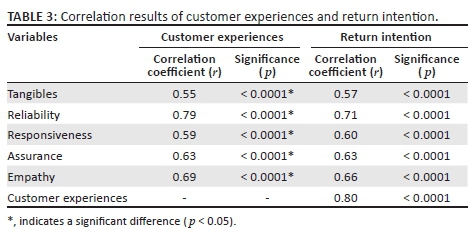
Table 3 shows the importance of hotel attributes to customers and that all five hotel dimensions showed a moderate to strong positive correlation (r > 0.5) with customer experiences. All five hotel dimensions had a significant correlation (p < 0.05) with customer experiences. The strongest correlation with customer experience was reliability (r = 0.79).
A similar examination of the relationship between the six independent variables and customers' return intention showed that all the variables had a weak to moderate (r ≤ 0.5) positive correlation with customer return intention. The weakest correlations with customer return intention were calculated for the tangibles and responsiveness (r = 0.32) dimensions. All six independent variables had a significant positive correlation (p < 0.05) with customers' return intention. Customer experience had the strongest correlation with customers' return intention (r = 0.50), followed by reliability (r = 0.40).
Full regression models were run for each of the two dependent variables. The first full model regressed the five hotel dimensions against customer experiences, while the second full model regressed the five hotel dimensions and customer experience against customer return intention. Table 4 depicts both full regression models.
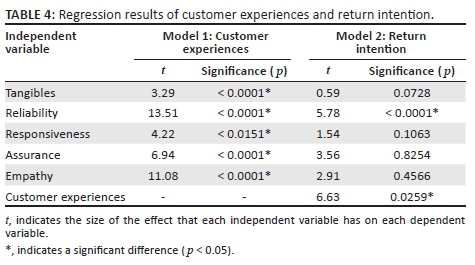
The first full regression model showed that all five hotel variables were significantly related (p < 0.05) to customer experiences. The t-values in Table 4 indicate the relative impact of each dimension in influencing customer experiences. Reliability (t = 13.51) was rated by respondents as the most important variable influencing customer experiences, followed by empathy (t = 11.08), assurance (t = 6.94), responsiveness (t = 4.22) and tangibles (t = 3.29).
The results are corroborated by Marković and Raspor (2010) and Mhlanga and Tichaawa (2016) who found that reliability ranked highest among the factors that impact on hotel customer experiences. However, the results deviate from the findings by Mohammad and Alhamadani (2011) who found that empathy, tangibles, reliability, responsiveness and assurance had a significant influence on customer experiences. Fah and Kandasamy (2011) also found that in Malaysian hotels, 'empathy and competence of staff' and 'reliability' were the two most vital dimensions of customer experiences, while Torres et al. (2013) found 'empathy and competency of staff' as the most important determinants of customer experiences in upscale hotels in the United States.
Ekinci et al. (2003) noted the tangible and intangible dimensions as the most significant dimensions of customer experiences of hotels, while Akbaba (2006) found that tangibles, adequacy in service, quality, assurance, understanding and caring and convenience are the most important determinants of customer experiences. The differences in findings to the study might be attributed to the different types of hotel guests targeted. For instance, Torres et al. (2013) reported only on guests of upscale US hotels, while this study reports on different types of hotels. The other reason might be the different modifications of the HOLSERV instrument used.
The model F-value was calculated at 29.46 (p < 0.0001). The five hotel dimensions had a coefficient determination (R2) of 0.6781 and thus explained more than 67% of the variability in customer experiences. This explanation of the variability in customer experiences is high when compared with other studies. For example, the regression results of a study performed by Marković and Raspor (2010), identified 'reliability', 'empathy and competence of staff', 'accessibility' and 'tangibles' order as significant predictors (p < 0.05) of hotel customer experiences, which explained only 55% of hotel customer experiences.
The second full regression model depicted in Table 4 showed that only reliability (p < 0.0001) and customer experience (p = 0.0259) were significantly related (p < 0.05) to customers' return intention. The t-values of the second model indicated that respondents rated customer experiences (t = 6.63) as the most important variable influencing their decision to return to a hotel, followed by reliability (t = 5.78). Previous research studies confirmed the important role of hotel customer experience (Jowaheer & Ross 2003; Marković & Janković 2013; Mhlanga & Tichaawa 2016; Tsang & Qu 2000; Williams & Buswell 2003) in hotel customers' return intention. While it is strange that assurance was found not to be a significant contributor to customers' return intention, comparable studies by Saleh and Ryan (1992) and Mei et al. (1999) confirmed that assurance is not a significant contributor to customers' return intention.
The model F-value was calculated at 31.78 (p < 0.0001). The five hotel dimensions and customer experiences had an R2 of 0.2690% and thus explained just more than 26% of the variability in hotel customers' return intention. The study results deviate from the regression results of studies performed by Saleh and Ryan (1992) and Mei et al. (1999) that only identified reliability as a significant predictor (p < 0.05) of hotel customers' return intention, which explained only 23% of customers' return intention.
The impact of each hotel dimension in influencing customer experiences should not be overlooked. Marković and Janković (2013), however, state that hotel customers usually evaluate the components of a hotel experience (e.g. tangibles, reliability, responsiveness, assurance and empathy) in isolation. This is demonstrated when hotel guests give the following feedback on their hotel experience: 'the hotel was beautiful, but the service was terrible'.
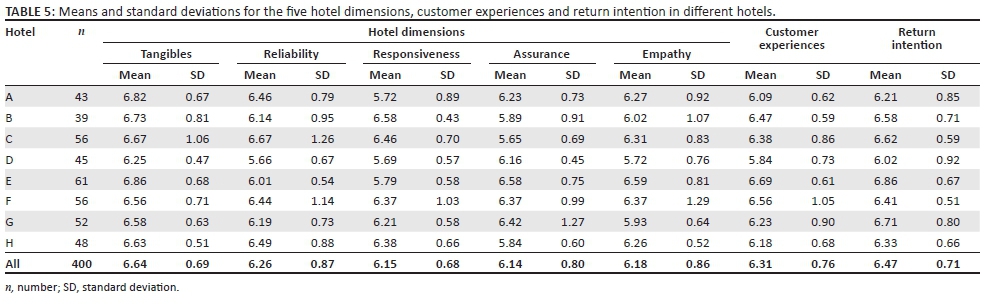
An evaluation of hotel customers' experiences and return intention levels in different hotels is shown in Table 5. The table portrays the variable mean scores and standard deviations calculated for the five hotel dimensions, customer experience and return intention in different hotels. To determine a difference in customers' experiences and return intentions in the respective hotels, means and standard deviations for the different hotels were calculated.
Table 5 shows that customers in different categories of hotels had different levels of experiences with different attributes. For instance, Hotel E obtained the highest scores for overall experiences (6.69) and return patronage (6.86), while Hotel A obtained the highest customer experience scores for its tangibles (6.86), assurance (6.58), empathy (6.59), overall hotel experience (6.69) and return patronage (6.86). Hotel D obtained the lowest customer experience scores for tangibles (6.25), reliability (5.66), responsiveness (5.69) and empathy (5.72). Hotel D also obtained the lowest mean scores for overall hotel experience (5.84) and return patronage (6.02).
The two hotels (Hotels A and E) that recorded the highest experience scores were 5-star rated, while the hotel that recorded the lowest scores (Hotel D) was 2-star rated. The results show that customers in different categories of hotels had different levels of satisfaction and confirm the assertion by the Tourism Grading Council of South Africa (TGCSA 2017) that the perceived service expectancy would be better at a 5-star hotel than at a 2-star hotel. This implies that perceived service quality has a direct effect on customer experiences in hotels. Consequently, star grading significantly influences customer experiences in hotels (Mhlanga & Tichaawa 2016).
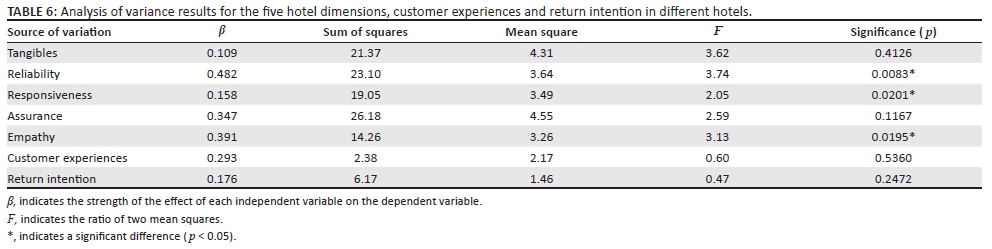
To determine whether there were any significant differences among the means of the eight hotels, Analysis of Variance (ANOVA) was performed for the five hotel dimensions, hotel experience and return intention in individual hotels (Table 6).
Table 6 shows that there were significant differences (p < 0.05) among the means for the following hotel dimensions: reliability (p = 0.0083), responsiveness (p = 0.0201) and empathy (p = 0.0195). This indicates that customer experiences in hotels were significantly influenced by reliability, assurance and staff empathy.
Conclusions
The purpose of this research endeavour was to determine customer experiences and return intention in hotels at or near OR Tambo International Airport. The study clearly indicates that all hotel attributes are not equally important to hotel customers. It was found that 'reliability', 'empathy' and 'assurance' are the most important dimensions influencing customer experiences. The results of this study suggest that delivering promised service dependably and accurately (reliability), offering caring and individualised customer attention (empathy) and having service providers that are knowledgeable, courteous and able to inspire trust and confidence (assurance) are the key attributes for hotels at or near airports in South Africa.
However, among these three dimensions, 'reliability' has emerged as the best predictor of customer experiences. Although customers may welcome the convenience of staying in a hotel near an airport, if the 'reliability' dimension is not met, customers will have low experiences. However, to increase return intentions, hoteliers should focus on the attributes significantly related to customers' return patronage, namely overall hotel experience and reliability.
The study provides hotel management with an improved understanding of the attributes that impact on customer experiences. Management needs to be aware that to improve customer experiences, they should provide a higher level of 'reliability', 'empathy' and 'assurance' to create favourable impressions of the hotel. However, the experience of the respondents in this study differed significantly between different hotels with different star grading. Therefore, star grading significantly influences customer experiences.
The impact of hotels on airport economies is clearly an important question for public policymakers wishing to develop a robust tourism policy. The findings can help hotels at or near airports further explore ways to amplify relational value to establish sustainable relationships with their customers. The understanding of experience attributes can be helpful to managers in crafting and executing strategies that have the most positive effect on customer behaviour. Consequently, this will allow hotels to manage customer experience properly that ultimately results in customer satisfaction, loyalty and positive word-of-mouth.
The results could help airport hotels to gain a competitive advantage over other hotel categories. The research supports the strategic objectives of the National Tourism Sector Strategy (RSA NDT 2011) to deliver a world-class experience to consumers in the tourism industry.
Limitations
Despite the importance of this study, it is not free of limitations. Firstly, only the most important attributes that could impact on hotel customers' experience and return patronage levels were investigated. Limited emphasis was also placed on the dimensions which could be reflective of the identified attributes. Secondly, the first regression model failed to explain 33% of the variation in customer satisfaction, and the second regression model could only explain 77% of the variation in return patronage. Thirdly, the research was based on customer experiences in hotels situated near a specific South African airport. Caution is therefore required when generalising the findings of this study to other segments of the hotel industry or airport hotels in other geographic areas, as a replication of this study in other types of hotels or other geographic areas might reveal varying levels of importance. Lastly, the measurement of hotel customers' experiences was limited to 21 hotel attributes. Even though these attributes were included in other studies as well, there could be other relevant hotel attributes that are likely to influence hotel customers' experiences and return patronage.
Future research
Five areas for future research can be identified. Firstly, the coefficient of determinations of the regression models suggests that additional hotel attributes (such as 'accessibility', 'room qualities', 'cleanliness', 'security', 'value for money', 'room cleanliness and comfort', 'convenience of location' and 'prompt service, safety and security') could be considered to explain overall customer experience and return patronage in hotels at or near airports. Secondly, future studies could compare the important hotel attributes for customer experience and return patronage in South African hotels and other types of accommodation (such as lodges and BnBs).
Thirdly, further research is required to explore the impact of economic and social rewards on hotel customers' return patronage. Fourthly, the research could be expanded to airports situated in other cities, although it is not expected that the findings would be significantly different. Lastly, triangulation requirements could be considered by applying multiple methods (e.g. surveys, individual interviews and focus group discussions) and multiple data and data sources (e.g. data obtained from mystery customers, front office receptionists and hotel management) in order to enhance the reliability and validity of the research.
Acknowledgements
The author wishes to thank hotel and airport management at OR Tambo International Airport for allowing the study to be conducted and the results to be published.
Competing interests
The author declares that he has no financial or personal relationships that may have inappropriately influenced him in writing this article.
References
Akbaba, A., 2006, 'Measuring service quality in the hotel industry: A study in a business hotel in Turkey', Hospitality Management 25(2), 170-192. https://doi.org/10.1016/j.ijhm.2005.08.006 [ Links ]
Ali, F., Hussain, K., Konar, R. & Jeon, H., 2017, 'The effect of technical and functional quality on guests' perceived hotel service quality and satisfaction: A SEM-PLS analysis', Journal of Quality Assurance in Hospitality and Tourism 18(3), 354-378. https://doi.org/10.1080/1528008X.2016.1230037 [ Links ]
Atasie, A.Q., 2010, A research work on customer satisfaction in the hospitality industry among hotels in Aba, published in Umuahia, 3rd edn., Juta, London. [ Links ]
Bernhardt, H.L., Donthu, N. & Kennett, P.A., 2000, 'A longitudinal analysis of satisfaction and probability', Journal of Business Research 47(2), 161-171. https://doi.org/10.1016/S0148-2963(98)00042-3 [ Links ]
Culture, Arts, Tourism, Hospitality and Sports Sector Education and Training Authority (CATHSSETA), 2016, Tourism and sport skills audit, Sandton, Tourism, Hospitality and Sport Education and Training Authority, Johannesburg, South Africa. [ Links ]
Choi, T.Y. & Chu, R., 2001, 'Determinants of hotel guests' satisfaction and repeat patronage in the Hong Kong hotel industry', International Journal of Hospitality Management 20(6), 277-297. https://doi.org/10.1016/S0278-4319(01)00006-8 [ Links ]
Cronin, J.J. & Taylor, S.A., 1994, 'SERVPERF versus SERVQUAL; reconciling performance-based and perceptions-minus-expectations measurement of service quality', Journal of Marketing 58, 125-131. https://doi.org/10.2307/1252256 [ Links ]
Ekinci, Y., Prokopaki, P. & Cobanoglu, C., 2003, 'Service quality in Cretan accommodations: Marketing strategies for the UK holiday market', International Journal of Hospitality Management 22(1), 47-66. https://doi.org/10.1016/S0278-4319(02)00072-5 [ Links ]
Enemuo, O.B., Ejikeme, J.N.U. & Edward, C., 2016, 'The role of customer satisfaction and maintenance culture in the sustainability of hospitality industries in Umuahia North and South Local Government Areas of Abia State', Journal of Hospitality and Management Tourism 7(1), 1-10. https://doi.org/10.5897/JHMT2015.0164 [ Links ]
Fah, L.K. & Kandasamy, S., 2011, 'An investigation of service quality and customer satisfaction among hotels in Langkawi', Proceedings of International conference on management (ICM 2011), Penang, Malaysia, 4-7 May, pp. 731-749. [ Links ]
Fogarty, A., 2015, Airports hotels: Laying the foundation for a synergistic relationship in airports, business travel, design, hotels, real estate, Spring 2015, trends, Boston Hospitality Review, USA. [ Links ]
Forones, R.C., 2013, Customer care and customer satisfaction in hotels, viewed 05 January 2017, from https://prezi.com/customer-care-and-customer-satisfaction-in-hotels [ Links ]
Forster, N., 2017, Further growth expected in Africa's hospitality sector in the next five years, according to PwC report, viewed 20 March 2017, from http://www.pwc.co.za/en/press-room/hotel-tourism.html [ Links ]
Gupta, P. & Srivastava, R.K., 2011, 'Analysis of customer satisfaction in hotel service quality using Analytical Hierarchy Process (AHP)', International Journal of Industrial Engineering Research and Development 2(1), 59-68. [ Links ]
Holjevac, I.A., Marković, S. & Raspor, S., 2009, Customer satisfaction measurement in hotel industry: Content analysis study, viewed 06 January 2017, from https://bib.irb.hr/datoteka [ Links ]
Hooper, D., Coughlan, J. & Mullen, M.R., 2013, 'The services cape as an antecedent to service quality and behavioural intentions', Journal of Service Marketing 27(4), 271-280. https://doi.org/10.1108/08876041311330753 [ Links ]
HOTREC, 2013, The hospitality sector in Europe. An assessment of the economic contribution of the hospitality sector across 31 countries, report by Ernst & Young commissioned by The Brewers of Europe with support from HOTREC, Hospitality Europe Business Newsletter, London, England. [ Links ]
Jensen, Ø. & Hansen, K.V., 2007, 'Consumer values among restaurant customers', Hospitality Management 26(3), 603-622. https://doi.org/10.1016/j.ijhm.2006.05.004 [ Links ]
Johnson, B. & Christensen, L.B., 2004, Educational research: Quantitative, qualitative, and mixed approaches, 2nd edn., Pearson Education Inc., Boston, MA. [ Links ]
Jowaheer, T.D. & Ross, D.L., 2003, 'A study of hotel guest perceptions in Mauritius', International Journal of Contemporary Hospitality Management 15(2), 105-115. https://doi.org/10.1108/09596110310462959 [ Links ]
Karunaratne, W.M.K.K. & Jayawardena, L.N.A.C., 2010, 'Assessment of customer satisfaction in a five-star hotel - A case study', Tropical Agricultural Research 21(3), 258-265. https://doi.org/10.4038/tar.v21i3.3299 [ Links ]
Khattab, S.A.A. & Aldehayyat, J.S., 2011, 'Perceptions of service quality in Jordanian hotels', International Journal of Business and Management 6(7), 226-233. https://doi.org/10.5539/ijbm.v6n7p226 [ Links ]
Kumar, K., 2015, 'Growth drivers and challenges in Indian hotel industry', World Wide Journal of Multidisciplinary Research and Development 1(6), 12-16. [ Links ]
Leedy, P.D. & Ormrod, J.E., 2013, Practical research: Planning and design, 10th edn., Pearson Education Inc., Upper Saddle River, NJ. [ Links ]
Lombard, L., 2016, Overview: SA tourism growth over the last decade, viewed 13 January 2017, from http://traveller24.news24.com/overview-sa-tourism-growth-over-the-last-decade [ Links ]
Luo, Z. & Qu, H., 2016, 'Guest-defined hotel service quality and its impacts on guest loyalty', Journal of Quality Assurance Hospitality Tourism 17(3), 311-332. https://doi.org/10.1080/1528008X.2015.1077185 [ Links ]
Maqutu, A., 2013, SA hotels anticipate boost from weaker rand, viewed 05 January 2017, from http://www.financialmail.co.za/features/sa-hotels-anticipate-boost-from-weaker-rand [ Links ]
Marković, S. & Janković, S.R., 2013, 'Exploring the relationship between service quality and customer satisfaction in Croatian hotel industry', Tourism and Hospitality Management 19(2), 149-164. [ Links ]
Marković, S. & Raspor, S., 2010, 'Measuring perceived service quality using SERVQUAL: A case study of the Croatian hotel industry', Management 5(3), 195-209. [ Links ]
Martin, J., 2015, Airport hotels are taking off, viewed 10 January 2017, from http://www.jllrealviews.com/industries/airport-hotels-are-taking-off [ Links ]
McMillan, J.H. & Schumacher, S., 2010, Research in education, 7th edn., Pearson, New York. [ Links ]
Mhlanga, O. & Tichaawa, T.M., 2016, 'Guest expectations and experiences within selected hotels in Nelspruit, Mpumalanga Province of South Africa', African Journal for Physical Activity and Health Sciences 22(4:1), 1185-1197. [ Links ]
Mohammad, A.A.S. & Alhamadani, S.Y.M., 2011, 'Service quality perspectives and customer satisfaction in commercial banks working in Jordan', Middle Eastern Finance and Economics 14(6), 17-41. [ Links ]
Moolman, H.J., 2011, 'Restaurant customer satisfaction and return patronage in a Bloemfontein shopping mall', Acta Commercii 6(8), 129-146. https://doi.org/10.4102/ac.v11i1.157 [ Links ]
Namasivayam, K. & Denizci, B., 2006, 'Human capital in service organisations: Identifying value drivers', Journal of Intellectual Capital 7(3), 381-393. https://doi.org/10.1108/14691930610681465 [ Links ]
National Hotel Association (NHA), 2015, Hotel industry facts sheet, viewed 08 January 2017, from http://www.hotel.org [ Links ]
Parasuraman, A., Zeithaml, V.A. & Berry, L.L., 1985, 'A conceptual model of service quality and its implications for future research', Journal of Marketing 49(1), 41-50. https://doi.org/10.2307/1251430 [ Links ]
Prayag, G., 2017, International visitors' perceptions of service interactions with hotel employees: A cross cultural perspective, viewed 02 March 2017, from http://www.lincoln.ac.nz [ Links ]
Price Waterhouse and Coopers (PWC), 2016a, Rooms with an African view. Hotels outlook: 2016-2020, viewed 06 January 2017, from http://www.pwc.co.za/hospitality-and-leisure [ Links ]
Price Waterhouse and Coopers (PWC), 2016b, South Africa's hotel and tourism sector set for steady growth as visitor numbers continue to grow: PWC Outlook, viewed 13 January 2017, from http://www.hospitalitynet.org/news [ Links ]
Republic of South Africa National Department of Tourism (RSA NDT), 2011, National tourism sector strategy, Department of Tourism, Pretoria. [ Links ]
Saghie, N.M.E., 2015, 'Managing service quality: Dimensions of service quality: A study in Egypt', International Journal of African and Asian Studies 9(6), 56-63. [ Links ]
Saleh, F. & Ryan, C., 1992, 'Analysing service quality in the hospitality industry using the SERVQUAL model', The Service Industries Journal 11(3), 324-343. https://doi.org/10.1080/02642069100000049 [ Links ]
Schall, M., 2003, 'Best practices in the assessment of hotel-guest attitudes', The Cornell Hotel and Restaurant Administration Quarterly April, 51-65. https://doi.org/10.1016/S0010-8804(03)90018-8 [ Links ]
Skift, D.S., 2013, Airports are making more money than ever on non-aeronautical revenue, viewed 14 January 2017, from http://skift.com/airports-are-making-more-money-than-ever-on-non-aeronautical-revenue [ Links ]
Statistics South Africa (SSA), 2010, Food and beverages, September 2010, Statistics South Africa, Pretoria. [ Links ]
Stefano, N.M., Casarotto Filho, N., Barichello, R. & Sohn, A.P., 2015, 'A fuzzy SERVQUAL based method for evaluated of service quality in the hotel industry', Proc CIRP 30(4), 433-438. https://doi.org/10.1016/j.procir.2015.02.140 [ Links ]
Stevens, P., Knutson, B. & Patton, M., 1995, 'DINESERV: A tool for measuring service quality in restaurants', The Cornell Hotel and Restaurant Administration Quarterly 36, 5-60. https://doi.org/10.1016/0010-8804(95)93844-K [ Links ]
Torres, E.N., Adler, H., Lehto, X., Behnke, C. & Miao, L., 2013, 'One experience and multiple reviews: The case of upscale US hotels', Tourism Review 68(3), 3-20. https://doi.org/10.1108/TR-03-2013-0012 [ Links ]
Tourism Grading Council of South Africa (TGCSA), 2017, Tourism Grading Council of South Africa, viewed 20 March 2017, from http://www.tourismgrading.co.za [ Links ]
Tsang, N. & Qu, H., 2000, 'Service quality in China's hotel industry: A perspective from tourists and hotel managers', International Journal of Contemporary Hospitality Management 12(5), 316-326. https://doi.org/10.1108/09596110010339706 [ Links ]
Williams, C. & Buswell, J., 2003, Service quality in leisure and tourism, 2nd edn., Cabi Publishing, Cambridge. [ Links ]
Wong Ooi Mei, A., Dean, A.M. & White, C.J., 1999, 'Analysing service quality in the hospitality industry', Managing Service Quality: An International Journal 9, 136-143. [ Links ]
World Travel and Tourism Council (WTTC), 2017, Travel and tourism economic impact summary, viewed 11 July 2017, from http://www.wttc.org/bin/pdf/tempo/exec-summary-final.htm [ Links ]
Zenglein, M.J. & Müller, J., 2007, Non-aviation revenue in the airport business - Evaluating performance measurement for a changing value proposition, GAP Discussion Paper 02, Berlin School of Economics, Berlin, Germany. [ Links ]
 Correspondence:
Oswald Mhlanga
osward.mhlanga@ump.ac.za
Received: 02 Feb. 2017
Accepted: 15 Jan. 2018
Published: 08 May 2018

