


Serviços Personalizados
Artigo
 Inglês (pdf)
 Artigo em XML
 Referências do artigo
Indicadores

Links relacionados
-
 Citado por Google
 -
 Similares em Google
Compartilhar

 Permalink
Acta Commercii
versão On-line ISSN 1684-1999
versão impressa ISSN 2413-1903
Acta Commer. vol.17 no.1 Johannesburg 2017
http://dx.doi.org/10.4102/ac.v17i1.513
ORIGINAL RESEARCH
A university in a small city: Discovering which sectors benefit
David Dyason; Ewert P.J. Kleynhans
School of Economics, Potchefstroom Campus, North-West University, South Africa
ABSTRACT
ORIENTATION: A university, and equally so a university campus, has the ability to influence the economy through its sectoral links. This raises the question as to what sectors benefit as a result of expenditure made by a university campus that is situated within a small city in South Africa.
RESEARCH PURPOSE: This paper identified the university-sector links by applying a bill-of-goods approach to identify which sectors benefit as a result of an operational university campus.
MOTIVATION FOR THE STUDY: The findings of this study will be used in refining provincial or local social accounting matrix (SAM) models to improve the measurement of an economic impact assessment for the university campus, especially as SAM models are not readily available on such a micro-level within South Africa.
RESEARCH DESIGN, APPROACH AND METHOD: The bill-of-goods is a detailed representation of the purchases of goods and services for the campus. The goods and services are grouped into the corresponding sector according to the Standard Industrial Classification to identify and quantify university-sector linkages.
MAIN FINDINGS: The results indicated a significant benefit for tertiary sectors of the economy, which receive approximately 85% of university expenditure. On a sectoral level, there is an increased benefit to the utility, retail and personal services sectors, whereas manufacturing and construction turn out to be less significant. Growth prospects for sectors within the tertiary sectors are higher compared to sectors in the primary and secondary sectors.
PRACTICAL AND MANAGERIAL IMPLICATIONS: Understanding this link enables strategic spatial planning on the part of local government and will enable proactive land-use planning, based on the strength and growth prospects of each individual sector that benefits from university expenditure.
CONTRIBUTION OR VALUE-ADD: This approach provided exceptional value in identifying the sectors that benefit and provide important trend analyses that will be combined with input-output models to improve the accuracy of measuring university impact assessment on a local level.
Introduction
The benefits of universities are regularly valued on a national level by placing an emphasis on their role in improving the level of education for the national economy. Universities are institutions of higher education in which human capital improvement takes place, typically through the process of teaching, learning and innovation. This consequently benefits the economy. The improvement in human capital, through tertiary education, is an instrument that supports economic growth (Neeliah & Seetanah 2016), which encourages governments to invest in tertiary education (Stevens & Weale 2004:176). As an example, the South African government has as recently as 2013/2014 developed two new public universities with the aim of improving availability and accessibility to these institutions.
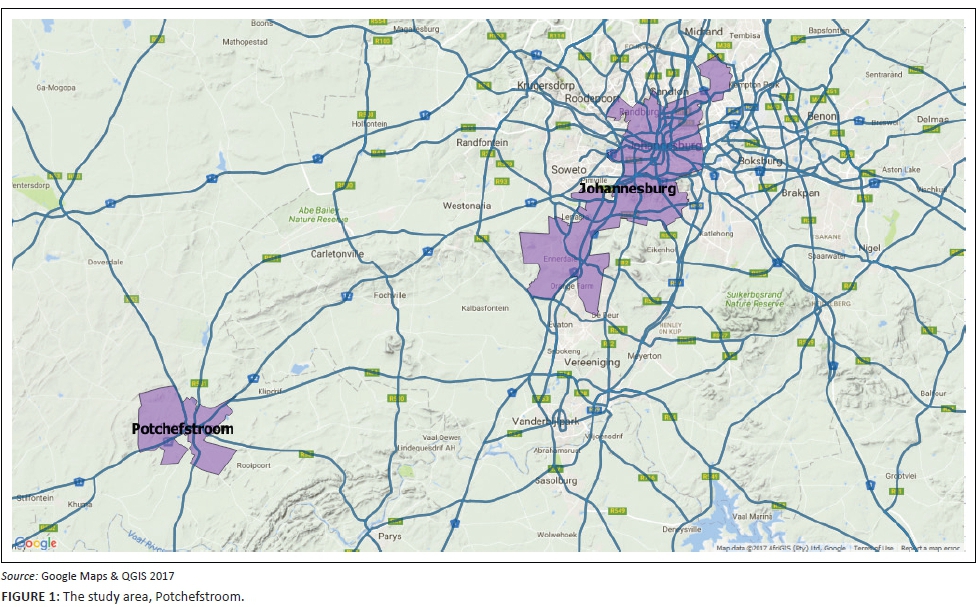
Universities represent institutions that are not only important for national economic growth, but also to the benefit of the local economy, especially when considering that universities are considered relatively resilient to business cycle fluctuations (Steinacker 2005:1161). Furthermore, a university has the ability to create employment and generate economic activity within the local economy by utilising local resources (Duke 2014). The benefit for the economy is often apparent through a changing physical landscape, where sectors benefit as a result of linkages with the university. A case in point is Potchefstroom, a small city approximately 120 km from Johannesburg in South Africa, with a population of 162 763 (StatsSA 2011), which hosts a campus of the North-West University (NWU). The location of Potchefstroom is illustrated in Figure 1.
Potchefstroom Campus is the largest campus of the NWU and had 21 501 full-time contact and 34 050 distance students enrolled in 2015 (NWU, 2015). Potchefstroom falls within the Tlokwe municipal area in North West Province. The economic growth of the local economy is largely driven by an ever-increasing tertiary sector. The sectoral gross value-added (GVA) contribution and the contribution of the sectors that form part of the tertiary sector, such as trade, transport, finance, community and government, are highlighted and illustrated in Figure 2.
Figure 2 illustrates the change in GVA contribution from each of the sectors for the local economy. The contribution from the tertiary sectors, illustrated by the red box, was significantly higher in 2015 compared to 1997. These sectors were also the drivers of growth for the economy as annual economic growth between 1997 and 2015 averaged 2.5%. The implication of the continued growth is that the Tlokwe economy is constantly increasing its contribution to the district and provincial economy as shown in Figure 3.
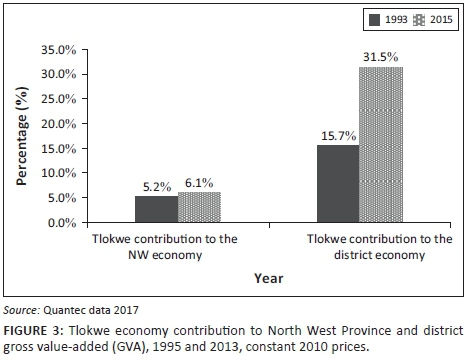
Figure 3 shows the GVA contribution for 1993 and 2015 of Tlokwe to the district and provincial economy. The contribution of the Tlokwe economy to the North West provincial economy has increased from 1993 (5.2%) to 2015 (6.1%). Similarly, the contribution to the Dr Kenneth Kaunda District economy is also higher from 15.7% in 1993 to 31.5% in 2015.
From the trend analysis, it can be inferred that Tlokwe is a local economy that is strengthening within the district and province. The influence of the university on the local economy should not be taken for granted, considering the possible links that exist between university expenditure and the local sectors that have experienced the growth. Understanding the effect of such an institution on the local economy and the linkages it shares with the local sectors would assist in identifying the long-term development potential of the local economy. Not only will this be beneficial to economies where universities are already present but also it will assist economic planning in regions intended for the development of new tertiary education institutions.
These economic impacts are frequently assessed with an input-output model and its extension, the social accounting matrix model (Polo & Valle 2012:337). Within the South African context, however, the lowest levels of aggregation of these models are at the provincial level. Measuring the economic impact on a local, university campus-level would require either a large number of assumptions or an alternative approach altogether. Understanding the university-sectoral link that results from university expenditure provides a starting point in measuring the impact of a campus on the economy. For this reason, the aim of this study is to identify the sectors that benefit from expenditure made by a university campus, by means of a bill-of-goods approach. This approach utilises the expenditure value per activity as recorded in the accounting statements from the campus for analysis. The analysis enables the identification of sectors that benefit, coupled with determining growth prospects in the long run.
The following section provides an overview of the literature particularly discussing the change in method for universities' economic impact assessment studies. The 'Methodology' section describes the applied method for this study, and is followed by the 'Empirical analysis' to identify the sectors that benefit from university expenditure. The final section provides an interpretation of the results, in particular describing the growth prospects of the beneficial sectors and the conclusion.
Literature
A university is an institution where production, diffusion and transmission of knowledge occur (Özsoy 2008). For these activities to take place, investment in technology, physical infrastructure, human capital and land is required. These investments render the intuition operational and lead to additional capital and operational expenditure, resulting in economic benefits. Assessing the economic impact of these expenditures is done through economic impact assessment methods, which are well documented in the literature (Armstrong, Darrall & Grove-White 1997; Bonner 1968; Booth & Jarrett 1976; Caffrey & Isaacs 1972; Smith & Bissonnette 1989; Stewart et al. 1989).
There has been a significant growth in the number of economic impact studies for universities from the 1960s and onwards (Brown & Heaney 1997:229). This increase in assessing the economic impact resulted in a study by Caffrey and Isaacs (1972), where they published findings on how to assist researchers in standardising the assessment method for university impact studies. The majority of the studies that were conducted made use of an input-output model to illustrate economy-wide impacts. Findings generally illustrate an economic impact value in local currency, often reaching millions, while simultaneously indicating the number of jobs created as a result of an operational university in the local economy (Siegfried, Sanders & McHenry 2007:547).
The impact of universities on the economy changed as economies evolved driven by globalisation in commerce, and a shift of increasing knowledge-intensive production and services (Drucker & Goldstein 2007:20). As a result, recent studies (since the 1990s) have measured the economic impact of a university by considering specific university functions and consequently applied different approaches in measuring the economic impact (Drucker & Goldstein 2007:24). This change in approach is to overcome the relative inflexible nature of the input-output model (Ambargis, McComb & Robbins 2011) in understanding the economic impact of a university.
Drucker and Goldstein (2007) illustrate various alternative approaches that are utilised in measuring the economic impact of a university. These include the use of surveys, to obtain direct expenditure by staff and students, as an assessment tool (see Elliott, Levin & Meisel 1988); the use of production functions to measure the importance of knowledge and innovation (see Bano & Taylor 2015; Martin 1998); individual data sets that measure the economic effect of a university through activities such as the number of spin-off firms generated as a result of research and development from a university (see Acs, Audretsch & Feldman 1994; Goldstein & Drucker 2006); and patents and licensing agreements that have developed (see Friedman & Silberman 2003) from innovation and knowledge obtained by universities. As the impact assessment approach for universities has evolved and expanded, the significant linkages that exist between the institution and the economy have been highlighted, albeit often in isolation.
One such an example is the development of innovation hubs. Parrillo and De Socio (2014) comment that for innovation hubs to develop, the university will most likely have a strong focus on research and innovation. Innovation hubs are, however, not a feature of every university, as Siemiatycki (2013) points out - it differs from university to university. The implication is that a university, through its linkages with the economy, is in a position to affect the spatial characteristics of the surrounding area where the university is located.
The interaction between a university and its surrounding environment has already been highlighted by Caffrey and Isaacs (1972), where the economy is distinguished between primary activities and secondary services. The primary activities of a university are indicative of activities such as research, innovation and development, teaching and learning of students and community development through social programmes. These primary activities result in the establishment of secondary services, for example, research and innovation leads to new product development and patent rights that can be used in improving production, a secondary service. Another example is the process of teaching and learning, which entails that students attend the university and this, subsequently, gives rise to secondary services through demand for residential and retail products. This interaction between the university and the economy creates opportunities where the personnel and the students take part in social and economic activities in the surrounding area, resulting in local development. The scale of the development would depend on the social structure and development state of the environment where the university is located (Antikainen 1981).
The existing university impact literature indicates that these institutions represent a benefit to the economy, both on a national level and a local level. Identifying and quantifying these benefits happens in the form of university-sector linkages which are often measured individually or in most cases the existing studies identify one of these linkages and report on the specific impact. In regions where local input-output models are available, these linkages form part of the model that estimates the economic impact, but mostly are not reported on. As a result, the university-sector linkages that take place as a result of university expenditure on capital and operational activity are rarely discussed as an impact aspect alone. The importance of quantifying the university-sector linkages is key to quantify the economic impact of a university. Furthermore, understanding this link would also enable strategic spatial planning on the part of local government. Gathering information about the sectors that will benefit as a result of an operational university would enable proactive land-use planning, based on the strength and growth prospects of each individual sector that benefits from university expenditure.
The bill-of-goods approach is used to identify the sectors that benefit as a result of university expenditure. This approach highlights the university-sectoral linkages, enabling long- term trend analysis in expenditure and, when combined with input-output models, the accuracy of the impact assessment can be improved (Ambargis et al. 2011:1). Identifying the university-sectoral linkages as a result of university expenditure is an important first step in quantifying the economic significance of a university campus.
Methodology
To identify and measure the sectoral linkages of Potchefstroom Campus, the expenditure value of each activity, referred to as the bill-of-goods, is grouped into the corresponding sector according to the Standard Industrial Classification (SIC) system of South Africa. The SIC is a classification system where activities within the economy are divided into sectors.
Identifying the sectoral linkages resulting from university expenditure through the bill-of-goods approach could improve economic impact assessment results when later combined with the input-output and social accounting matrix (SAM) approaches. It considers the specific investment or expenditure value made by a university, which is a more detailed analysis than the off-the-shelf input-output analysis (Ambargis et al. 2011). This approach captures the economic impact of a university in more detail than, for example, the input-output and SAM approaches, when assessing sectoral linkages.
The bill-of-goods is a detailed representation of the university's purchases of goods and services from the campus accounting statements. The value of purchases is expressed in nominal values for a specific year of operation for the campus and grouped into purchases of specific activities or consumables. To analyse the expenditure trends, the values are converted to real values to remove the effect of inflation.
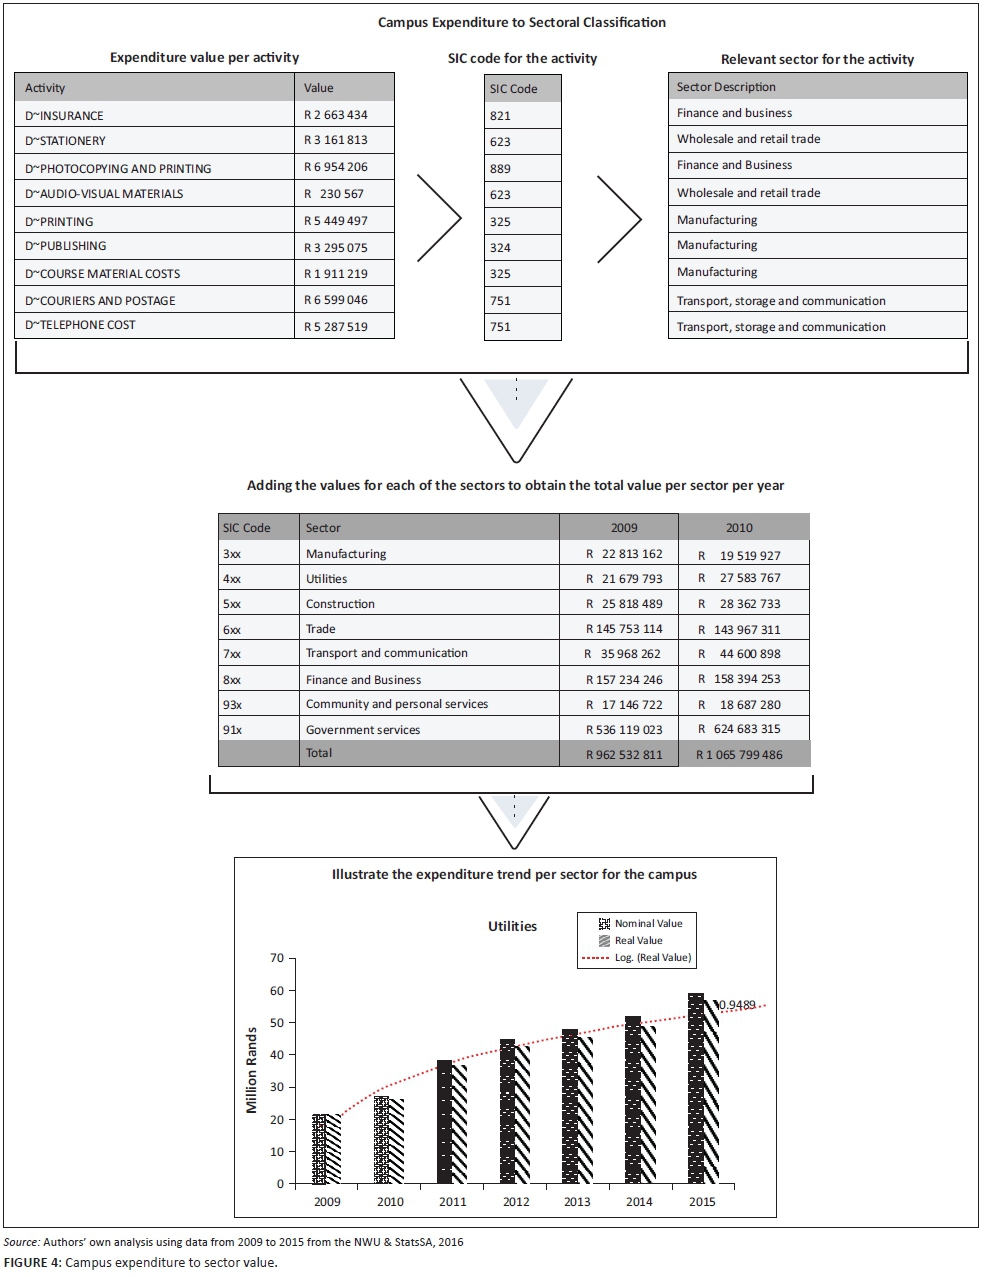
Figure 4 illustrates the process involved to classify the expenditure made by Potchefstroom Campus into sectors according to the SIC system.
Figure 4 shows the process that is required to identify the sectors that benefit from the expenditure of the university campus. Expenditure data for the period 2009-2015 were sourced for Potchefstroom Campus. The expenditure type is linked to the relevant activity type as provided in the SIC version 5, which enabled the expenditure to be divided into sectors. The value of expenditure for each sector is added for any given year to illustrate the annual total expenditure per sector.
The value of total expenditure for Potchefstroom Campus from 2009 to 2015 is illustrated in Figure 5.
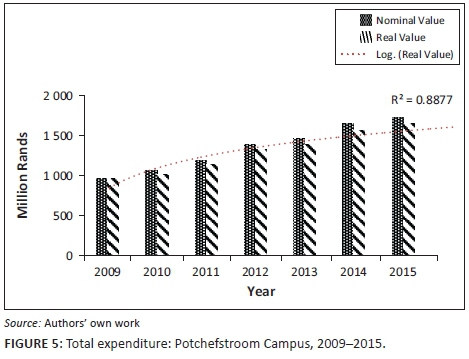
The value of expenditure has increased over the past seven years in nominal and real values. The increase in expenditure is indicative of a period of expansion for the university. During the period under consideration, the campus experienced growth in the number of enrolments, staff employment and research output. It is illustrated in Figure 5 that the value of expenditure by the campus is significantly large, and certainly a positive stimulus for the economy, both locally and nationwide.
Empirical analysis
Identifying the sectors that benefit
The process to identify the sectors that benefit is done through linking the activities for which there are campus expenses with the relevant sector. Table 1 illustrates the selected activities and the corresponding sectors.
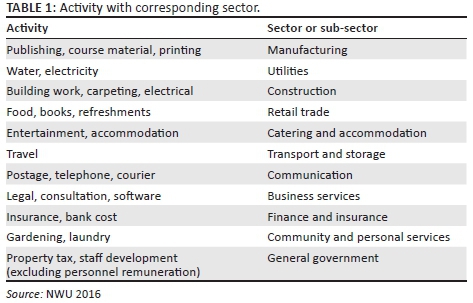
Personnel remuneration is the single largest expense of the campus. In 2015, these expenses alone contributed 61% of total expenditure and were similarly large during the preceding years. Salaries represent an income source that is on its part used by households for spending on a variety of goods and services in different economic sectors. The salary component is excluded from the analysis as it represents an injection from households into the economy.
The value in expenditure for each sector is illustrated in Figure 6.
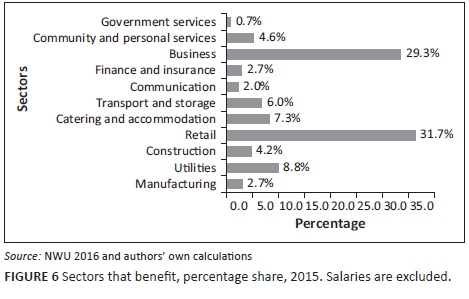
Figure 6 shows the expenditure made by the university campus according to sectors and that most of the sectors within the economy benefit, with the exception of agriculture and mining.
Retail represents the largest expenditure type with 31.7%, followed by business services with 29.3%. Expenditure on activities in the utilities sector represents 8.8% of all expenditure, catering and accommodation with 7.3%, and transport and storage at 6%. Expenditure on government services sector, which includes property tax, represents the smallest expense for the campus at 0.7%. A total of 84.3% of expenditure is within the tertiary sector, which highlights the benefit that these sectors receive from university expenditure.
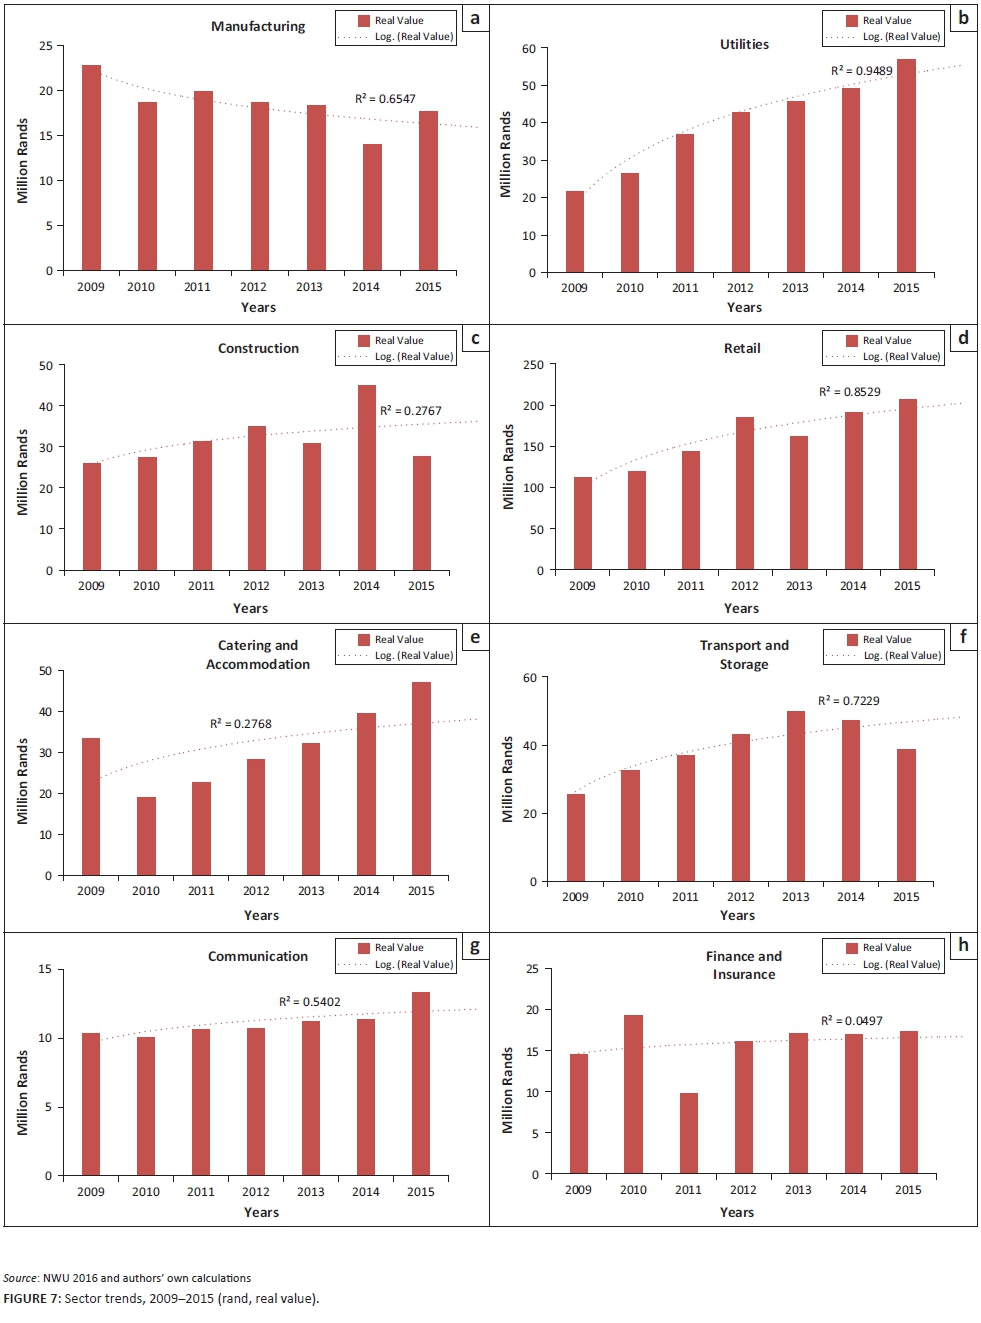
Longer term expenditure trends over the period 2009-2015 show the sectors that strengthen their link with a university or alternatively have a diminishing role based on expenditure. Figure 7 graphically illustrates the expenditure level for each sector between 2009 and 2015, and the following can be concluded.
The manufacturing sector consists mainly of spending on activities in the paper, publishing and printing sub-sector as far as the university is concerned. Since 2009, the value of university expenditure in manufacturing activity has decreased steadily; this during a period of expansion for the campus. The major reason for this decrease is most probably the lower reliance on printing and paper products and a move towards the electronic use of similar reading material.
The expenditure on utilities, which includes water and electricity, has increased significantly and has more than doubled over the past seven years. Investment in and use of electricity generating capable infrastructure, to limit the negative operational impact on the university because of power shortages, is a possible reason for the increase. At the same time, the price of electricity also increased with rates above inflation values. Furthermore, the university has invested significantly over this period in a number of new buildings on the campus that would contribute to an increase in demand for water and electricity use.
The construction sector includes expenditure on general maintenance and investments in new buildings on the campus. The campus has construction-related expenditure on an annual basis and, apart from 2014, this value is mostly stable.
Expenditure on retail and related activity increases annually. The value in 2015 is double the 2009 value, and significant expenses are incurred in this sector. Retail expenditure includes activities such as stationery, food and computer equipment.
Expenditure on catering and accommodation activities represents one of the smaller sectors. Expenditure in this sector was initially high in 2009 and decreased significantly the following year. Between 2010 and 2015, expenditure had increased annually, with the 2015 value significantly higher than the 2009 value. Expenditure on conferencing is part of this sector and also falls within the retail and transport sectors.
The transport and storage sector reached a peak in 2013 and has since decreased to the same level as in 2011, with overseas and local travel expenditure the largest contributors.
Expenditure on communication activity has increased only slightly over the past seven years, with telephone and courier services responsible for the largest of the expenditure.
Similarly, expenditure within the finance and insurance sector has stayed more or less constant over the period under consideration.
Business services are the third largest sector with 11.5% of expenditure made towards such activities, for example legal and consultation services. The expenditure value increased annually from 2010 and reached a peak in 2014 and was lower in 2015.
The expenditure on community and personal services is slightly higher every year and includes expenditure on conference fees, gardening and laundry services.
The government services sector is responsible for 0.7% of all expenditures. The expenditure on government services has increased between 2009 and 2015 and consists of the payment of property tax, staff development and staff training.
Sectoral trends
When sectoral expenditure is expressed as a percentage of total university campus expenditure, the change in contribution, for the period 2009 to 2015, can be compared to identify changes. Figure 8 shows the sectoral percentage share of university expenditures for 2009, 2012 and 2015.
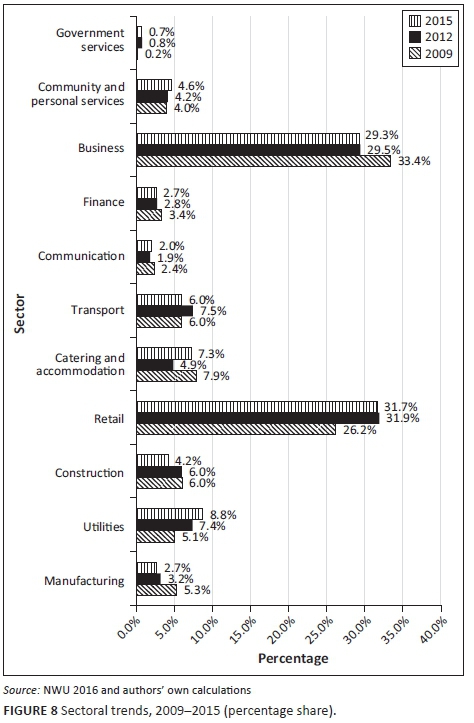
Figure 8 shows that, over the long term, the retail and business services are the sectors that benefit the most from university expenditure and their share as percentage of expenditure has remained near 30% over the period. The manufacturing and construction sectors had lower contributions in 2015 compared to 2009, while utilities had a significantly higher share in 2015. The share of the other sectors has stayed relatively the same over this period.
The following section will investigate the change in shares for expenditure within the context of the local economy.
Strengthening sectoral linkages
This section investigates whether sectoral changes, resulting from university expenditure, have the ability to influence economic activity in the local economy with the use of competitive advantage analysis (CAA). CAA is the ideal analytical tool to measure the structure and performance of economic entities (DBSA 2001). The findings of this kind of analysis are descriptive and add another dimension to the explanation of the relationship between university expenditure and local economic activity.
The leading-lagging analysis is a CAA tool that describes the growth dynamic of the university's sectoral growth in comparison with the local economy. There are two key values, the district sector relative growth (DSRG), which, in this instance, reflects the Tlokwe economy, and the local sector relative growth (LSRG), represented by the Potchefstroom Campus expenditure. The campus expenditure values are adjusted to reflect its GVA value for each sector.
District sector relative growth
The DSRG shows the sector growth compared to the total growth of the district economy, in this case, Tlokwe. If the sector growth is higher than the total growth rate, then the sector is leading, meaning that it has increased at a higher rate than the total economy and signifies a sector that is rising relative to the district economy. When the sector growth rate is less than the total growth of the district economy, the sector is lagging:
DSRG = District GVA growth in a sector minus District GVA growth overall.
Local sector relative growth
The LSRG measures the growth of a sector in the local economy, in relation to the growth of the same sector in the district economy. A sector is leading when the local sector has a higher growth rate than the corresponding sector in the district economy and it is lagging when it is lower.
LSRG = Local GVA growth in the sector minus District GVA growth in the sector.
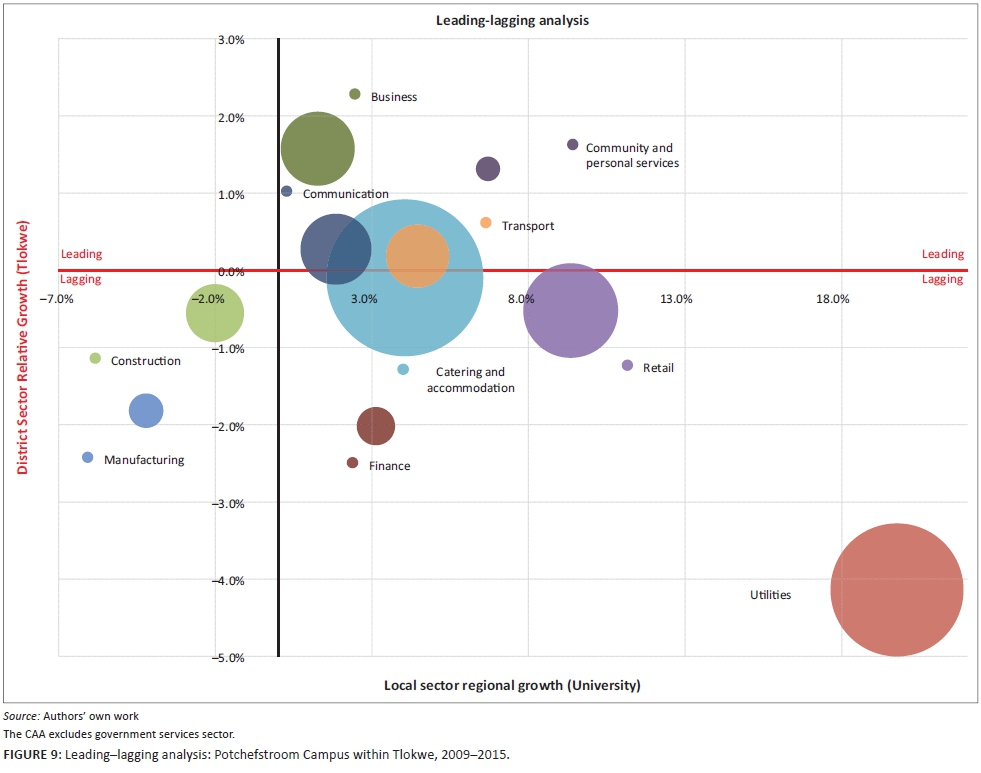
The findings of the leading-lagging analysis of the current study are provided in Figure 9, while the location quotient (LQ) is incorporated into the findings where its value is indicated by the size of the circle. The LQ indicates the level of concentration of a sector between the local and district economies (Leigh 1970). The LQ is a ratio that measures the relative size of the local sector with the relative size of the same sector within the district economy.
The LQ is added to this analysis to illustrate sectoral spending concentration from Potchefstroom Campus within the Tlokwe economy. A higher LQ value indicates that the sector is more specialised or concentrated in the local economy (university) compared to the district economy (Tlokwe) and vice versa.
LQ = Percentage of local sector GVA/percentage of district sector GVA.
Figure 9 provides a descriptive analysis in the growth trends for the period indicated. The LSRG, which represents the university, is indicated on the vertical axis and ranges between −5% and 3%, while the DSRG, which represents the Tlokwe economy, is on the horizontal axis and ranges between −7% and 20%. The graph is divided into four segments. The upper right segment shows the sectors that are leading in both LSRG and DSRG and the bottom right segment is leading in the local sector but lagging in the district sector. The bottom left segment shows the sectors that are lagging in both the local and district sector analysis, while the upper left segment reflects a leading district sector and lagging local sector.
The analysis does not unambiguously explain causality between economic activity generated as a result of university expenditure and the local economy; however, it does provide unique insight into sectoral expenditure growth of the university compared with sector growth in the local economy. At this point, it is important to repeat that the LSRG and DSRG analyses compare sector and overall growth with each other, in an effort to explain the economic structure and performance of the university within the Tlokwe local economy.
The sectors where the LSRG and DSRG are leading show an increase in competitive advantage resulting from strong economic growth within the local and district economies. The sectors include catering and accommodation, transport and communication, business services and community and personal services. Sectors where LSRG and DSRG are lagging have, in comparison, experienced lower economic growth. The sectors include manufacturing and construction.
The CAA is not without controversy, as highlighted by Buss (1999), who makes a case against targeted industry strategies that are mostly developed based on the findings of such analyses. The CAA is often wrongfully used as a measuring tool instead of a descriptive tool on which strategic planning is made. This paper only utilised the CAA as a descriptive tool in understanding the role of sectoral expenditure patterns within the local economy context.
This section evaluated the sectoral structure of spending by Potchefstroom Campus, as an economic entity within the Tlokwe municipal economy. The analysis shows the intricate changes that have taken place on a sectoral level for university campus expenditure within the Tlokwe economy during 2009-2015. The following section combines the findings of the CAA and the general expenditure trends for each of the sectors and discusses the growth prospects for sectors that benefit from university expenditure.
Interpretation of the results
Identifying the growth prospects for each of the sectors that benefit from university expenditure requires an integrated approach of data assimilation and interpretation. The growth prospects per sector are determined by combining the expenditure trends between 2009 and 2015, as well as the comparative advantage analysis findings. The limited data periods available have unfortunately restricted the use of forecasting techniques to conduct a detailed growth analysis. For this reason, the growth prospects are based on combining the historical performance of each sector and the CAA findings, and categorised as low, medium or high.
Growth prospects = f(Ss, Sg, LQ)
where Ss is the sector's share of total campus expenditure, Sg is the sector growth over the past seven years and LQ is the location quotient, an indication of the concentration of the sector compared to the local economy.
Low growth represents sectors that have a small sector share of university expenditure, below 5%, coupled with low growth of below 2% per annum and a low LQ. Medium growth represents sectors with a small share of university expenditure, above 5%, coupled with positive growth over the past seven years of above 2% per annum and having a medium to high LQ. The high growth sectors represent the sectors that have a share of more than 5%, have positive economic growth and a high LQ.
Table 2 illustrates the growth prospects on a sectoral level resulting from university expenditure.
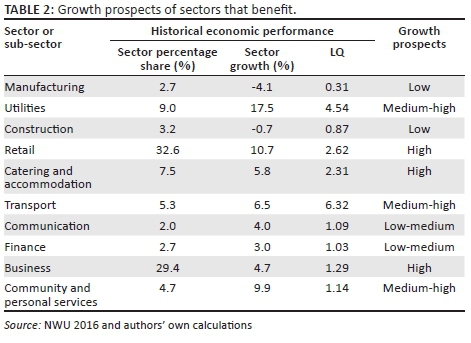
The growth prospects per sector, as provided in Table 2, are also shown in Figure 10. The figure is a graphic representation of the table.
The sector percentage share (indicated in column 2 of Table 2) reflects the significance of a sector in terms of the benefits gained from university expenditure. A higher value represents a higher significant link between the university and sector. In other words, the sector gains significantly from an operational campus. In this case, activities that fall within the retail and finance and business services sectors are the major beneficiaries from a university's presence.
The sector growth is indicative of the strength between the sector and the university. A sector that continues to have positive growth is strengthening the university-sector link, while a negative growth weakens the link.
The interpretation of LQ is not complex and merely indicates the level of concentration of the sector resulting from expenditure compared to the local economy. Sectors that dominate will have higher LQ values and sectors that are relatively scarce will have lower values.
The past seven years have been a period of expansion for the campus, which includes increasing enrolments of contact students, increases in personnel on the campus and the development of physical infrastructure (including new lecture halls and hostels) on the campus. The interpretation of university-sector linkages is conducted with this expansion period in mind. During this period of expansion, expenditure on activities in the manufacturing sector is slowly decreasing. Potchefstroom Campus shows limited and decreasing benefits to manufacturing activity and signifies low growth prospects.
The utility sector is growing significantly, as university expenditure on these activities increases annually. The expansion of the university's physical infrastructure, coupled with uncertainty in national electricity supply, has undoubtedly driven expenditure in this sector. Expenditure in this sector is still relatively small compared to all sectors receiving university expenditure and while the expenditure has increased, investment in this sector should stabilise as the national electricity supply stabilises. With continued investment in infrastructure on the campus and the need to continue operations even with interruptions in water and electricity services, this sector represents a medium to high growth prospect in the short-run.
The expenditure on construction has increased slightly until 2014, while 2015 is significantly lower. The sector trend illustrates that construction has been relatively constant over a seven-year period, although it is clear that there are years with above average followed by years of below average expenditure. The level of expenditure is expected to remain at current expenditure levels over a longer term and represents low growth prospects.
The university-retail sector link is significant and has solidified over the period of analysis. The retail sector has a significant benefit from the presence of Potchefstroom Campus and growth prospects remain high for this sector.
The annual increase in catering and accommodation expenditure, above average total expenditure, has strengthened the link between the university and the sector. The sector represents a high growth prospect during the current period of expansion for the campus.
The transport sector reached a peak in expenditure levels in 2013 and declined thereafter. The 2015 expenditure is comparable with the levels of expenditure of 2011 but is still higher than in 2009. Over the long term, the sector shows positive economic performance but decreasing over the short term. Given the short-run decrease in expenditure, during a time of expansion for the campus, this sector represents medium-to-high growth prospects.
The communication sector receives the smallest share of university expenditure with low levels of growth. The expenditure value is mostly constant each year and represents low to medium growth prospects.
The finance sector is similar to the communications sector in that expenditure is consistently the same value year on year. The long-term trend indicates positive economic performance, but the sector share remains low; as a result, growth prospects are low to medium.
The university-business services sector link is significant. The expenditure value increases annually, with the exception of 2015. The sector represents high growth potential.
Community and personal services are a sector that has continually grown over the past seven years and represents a medium to high growth prospect.
Summary and conclusion
The aim of this study is to identify the sectors that benefit from expenditure made by a university campus. Instead of using a generalised input-output model, an alternative approach, the bill-of-goods method, was used. The advantage of this approach is that it considers all the expenses made per activity by the university as indicated by the accounting statements, which is then allocated to the relevant sector though the use of the SIC of South Africa.
The bill-of-goods approach provides exceptional value in identifying the beneficial sectors, particularly considering the process involved to allocate the expenditure activities into sectors. Identifying the annual economic value of the sector, coupled with expenditure changes over time, provides important trend analyses.
The expenditure from the Potchefstroom campus of North-West University benefits mainly the tertiary sectors, and these sectors are less likely to be influenced by drastic business cycle fluctuations compared to the primary and secondary sectors. Although not completely unaffected by business cycle changes, the beneficial sectors will be more resilient to these changes. Three sectors, in particular the government services, business services and trade sectors, gain the most from university expenditure, while expenditure growth in smaller sectors such as catering and accommodation and utilities shows growth prospects. Potchefstroom Campus is experiencing a period of growth and expansion, which has affected the value of expenditure from the campus.
The findings of this study will be used in refining provincial or local SAM models to improve the measurement of an economic impact assessment for the university campus, especially as SAM models are not readily available on such a micro-level within South Africa. The university-sector linkages provide insight into development and growth trends of the economy, especially the local economy in which the campus is situated. This insight would assist in the planning of the town where these institutions are located, as the local impact on demand for activity related to university expenditure would have an effect on long-term land use development. This link between sector and land use demand is the topic of a follow-up study.
Acknowledgements
The authors would like to thank TRADE (Research Focus Area) for their contribution in making this publication possible.
Competing interests
The authors declare that they have no financial or personal relationships that may have inappropriately influenced them in writing this article.
Authors' contributions
D.D. formulated the main concept and did the original research. He conducted most of the research and wrote the original manuscript. He is an expert on the topic, lecturer and doctoral fellow at North-West University (South Africa). E.P.J.K. assisted in the development of the concept, interpretation of some of the empirical findings and the development of the manuscript. He assisted in the writing and the finalisation of the article for publication.
References
Acs, Z.J., Audretsch, D.B. & Feldman, M.P., 1994, 'R & D spillovers and recipient firm size', The Review of Economics and Statistics 76(2), 336-340. https://doi.org/10.2307/2109888 [ Links ]
Ambargis, Z.O., McComb, T. & Robbins, C.A., 2011, 'Estimating the local economic impacts of university activity using a bill of goods approach', in The 19th International Input-Output Conference, Alexandria, VA, 13-19th June, 1-11. [ Links ]
Antikainen, A., 1981, 'The regional impact of universities in Finland', Higher Education 10(4), 437-448. https://doi.org/10.1007/BF01676925 [ Links ]
Armstrong, H.W., Darrall, J. & Grove-White, R., 1997, 'Maximising the local economic, environmental and social benefits of a university: Lancaster University', Geo Journal 41(4), 339-350. https://doi.org/10.1023/A:1006849629834 [ Links ]
Bano, S. & Taylor, J., 2015, 'Universities and the knowledge-based economy: Perceptions from a developing country', Higher Education Research & Development 34(2), 242-255. https://doi.org/10.1080/07294360.2014.956696 [ Links ]
Bonner, E.R., 1968, 'The economic impact of a university on its local community', Journal of the American Institute of Planners 34(5), 339-343. https://doi.org/10.1080/01944366808977555 [ Links ]
Booth, G.G. & Jarrett, J.E., 1976, 'The identification and estimation of a university's economic impacts', The Journal of Higher Education 47(5), 565-576. https://doi.org/10.1080/00221546.1976.11774077 [ Links ]
Brown, K.H. & Heaney, M.T., 1997, 'A note on measuring the economic impact of institutions of higher education', Research in Higher Education 38(2), 229-240. https://doi.org/10.1023/A:1024937821040 [ Links ]
Buss, T.F., 1999, 'The case against targeted industry strategies', Economic Development Quarterly 13(4), 339-356. [ Links ]
Caffrey, J. & Isaacs, H.H., 1972, 'Estimating the impact of a college or university on the local economy', The Journal of Higher Education 43(1), 82. https://doi.org/10.1080/00221546.1972.11774934 [ Links ]
Development Bank of Southern Africa (DBSA), 2001, Guidelines to regional socio-economic analysis, DBSA, Midrand. [ Links ]
Drucker, J. & Goldstein, H., 2007, 'Assessing the regional economic development impacts of universities: A review of current approaches', International Regional Science Review 30(1), 20-46. https://doi.org/10.1177/0160017606296731 [ Links ]
Duke, J., 2014, 'Are economic developers asking universities to participate in the development of their state's economies?', Economic Development Journal 13(4), 19-23. [ Links ]
Elliott, D.S., Levin, S.L. & Meisel, J.B., 1988, 'Measuring the economic impact of institutions of higher education', Research in Higher Education 28(1), 17-33. https://doi.org/10.1007/BF00976857 [ Links ]
Friedman, J. & Silberman, J., 2003, 'University technology transfer: Do incentives, management and location matter?', Journal of Technology Transfer 28, 17-30. https://doi.org/10.1023/A:1021674618658 [ Links ]
Goldstein, H. & Drucker, J., 2006, 'The economic development impacts of universities on regions: Do size and distance matter?', Economic Development Quarterly 20(1), 22-43. https://doi.org/10.1177/0891242405283387 [ Links ]
Google Maps, 2017, Map of Potchefstroom, Google, viewed 23 February 2017, from https://www.google.co.za/maps/@-26.7176086,27.1087616,12z?hl=en [ Links ]
Leigh, R., 1970, 'The use of location quotients in urban economic base studies', Land Economics 46(2), 202-205. https://doi.org/10.2307/3145181 [ Links ]
Martin, F., 1998, 'The economic impact of Canadian university R&D', Research Policy 28, 677-687. https://doi.org/10.1016/S0048-7333(98)00083-3 [ Links ]
Neeliah, H. & Seetanah, B., 2016, 'Does human capital contribute to economic growth in Mauritius?', European Journal of Training and Development 40(4), 248-261. https://doi.org/10.1108/EJTD-02-2014-0019 [ Links ]
North West University (NWU), 2015, Management information report, NWU, Potchefstroom. [ Links ]
North West University (NWU), 2016, Accounting statements, NWU, Potchefstroom. (unpublished) [ Links ]
Özsoy, C., 2008, 'The contribution of higher education to economic development', paper presented at the 8th Global Conference on Business & Economics, Florence, Italy, 18-19th October, viewed 18 January 2017, from http://www.gcbe.us/8th_GCBE/data/confcd.htm [ Links ]
Parrillo, A.J. & De Socio, M., 2014, 'Universities and hospitals as agents of economic stability and growth in small cities: A comparative analysis', The Industrial Geographer 11, 1-28. [ Links ]
Polo, C. & Valle, E., 2012, 'Input-output and SAM models', in L. Dwyer, A. Gill & N. Seetaram (eds.), Handbook of research methods in tourism: Quantitative and qualitative approaches, pp. 227-235, Edward Elgar, Cheltenham, UK. [ Links ]
Quantec Data, 2017, 'Regional standardised dataset', viewed 26 January 2017, from http://quanis1.easydata.co.za/ReportFolders/reportFolders.aspx [ Links ]
Siegfried, J.J., Sanderson, A.R. & McHenry, P., 2007, 'The economic impact of colleges and universities', Economics of Education Review 26, 546-558. https://doi.org/10.1016/j.econedurev.2006.07.010 [ Links ]
Siemiatycki, E., 2013, 'A smooth ride? From industrial to creative urbanism in Oshawa, Ontario', International Journal of Urban and Regional Research 37(Sept.), 1766-1784. https://doi.org/10.1111/j.1468-2427.2012.01196.x [ Links ]
Smith, E.R. & Bissonnette, K.K., 1989, 'The economic impact of non-resident students on West Virginia's economy', Research in Higher Education 30(2), 229-238. https://doi.org/10.1007/BF00992719 [ Links ]
Statistics South Africa (StatsSA), 2011, Census 2011, viewed 26 November 2016, from http://www.quantec.ca.za. [ Links ]
Steinacker, A., 2005, 'The economic effect of urban collages on their surrounding communities', Urban Studies 42(7), 1161-1175. https://doi.org/10.1080/00420980500121335 [ Links ]
Stevens, P. & Weale, M., 2004, 'Education and economic growth', in G. Johnes & J. Johnes (eds.), International handbook on the economics of education, pp. 164-188, Edward Elgar, Cheltenham, UK and Northampton, MA. [ Links ]
Stewart, T.J., Prinzinger, J.M., Dias, J.K., Bowden, J.T., Salley, J.K. & Smith, A.E., 1989, 'The economic impact of a historically black college upon its local community', Journal of Negro Education 58(2), 232-242. https://doi.org/10.2307/2295596 [ Links ]
 Correspondence:
David Dyason
David.Dyason@nwu.ac.za
Received: 14 June 2017
Accepted: 08 Oct. 2017
Published: 20 Nov. 2017

