


Servicios Personalizados
Articulo
 Inglés (pdf)
 Articulo en XML
 Referencias del artículo
Indicadores

Links relacionados
-
 Citado por Google
 -
 Similares en Google
Compartir

 Permalink
Acta Commercii
versión On-line ISSN 1684-1999
versión impresa ISSN 2413-1903
Acta Commer. vol.15 no.1 Johannesburg 2015
http://dx.doi.org/http://dx.doi.org/10.4102/ac.v15i1.290
ORIGINAL RESEARCH
http://dx.doi. org/10.4102/acom.v15i1.290
Influence of reward preferences in attracting, retaining, and motivating knowledge workers in South African information technology companies
Mark BussinI; Wernardt C. ToerienII
IIndustrial Psychology and People Management, University of Johannesburg, South Africa
IIGordon Institute of Business Science, University of Pretoria, South Africa
ABSTRACT
PURPOSE: The world of work is evolving and the nature of relationships between knowledge workers and their employers has changed distinctly, leading to a change in the type of rewards they prefer. The nature of these preferences in the South African, industry-specific context is poorly understood. The purpose of this study was to deepen understanding of the reward preferences of Information technology (IT) knowledge workers in South Africa, specifically as these relate to the attraction, retention and motivation of knowledge workers
DESIGN: The research design included a quantitative, empirical and descriptive study of reward preferences, measured with a self-administered survey and analysed using non-parametric tests for variance between dependent and independent groups and non-parametric analysis of variance
FINDINGS: This study found that there are specific reward preferences in knowledge workers in the IT sector in South Africa and that these preferences apply differently when related to the attraction, retention and motivation of employees. It identified the most important reward components in the competition for knowledge workers and also demonstrated that demographic characteristics play a statistically significant role in determining reward preferences
PRACTICAL IMPLICATIONS: The study's findings show that a holistic approach to total rewards is required, failing which, companies will find themselves facing increased turnover and job-hopping. Importantly, the study also highlights that different rewards need to form part of knowledge workers' relationship with their employer in three different scenarios: attraction, retention and motivation
Introduction and literature review
This study investigated the reward preferences of knowledge workers in the IT industry in South Africa and explored the relationship between these reward preferences and attraction, motivation and retention.
Context
The modern workplace is changing rapidly, with advances in technology changing the nature of the world's economy from being predominantly product based towards a new, knowledge-based paradigm. The most valuable assets we create are increasingly intangible and competitive advantage lies within the unique knowledge and experience of a company's most talented and skilled employees (Beechler & Woodward 2009).
The problem is that there simply are not enough knowledge workers to meet global demand. It has been suggested that by 2020, there may be as much as a 13% shortage of highly skilled and university-educated workers worldwide (Dewhurst, Hancock & Ellsworth 2013). This shortage of skills is also evident in the South African context and is compounded by decreasing standards of education and increased mobility of knowledge workers leading to immigration (Wöcke & Heymann 2012).
In addition to companies competing for scarce skills, there is significant cost attached to losing existing knowledge workers to voluntary turnover. These costs include decreased productivity and the direct costs of recruiting and training replacements. There are also the less quantifiable costs involved in losing employees who carry significant intellectual capital with them and the disruption in organisational processes experienced by the employer when these workers leave (Dess & Shaw 2001; Morrell, Loan-Clarke & Wilkinson 2004). In one study in the information technology (IT) sector in the United States of America, the cost of replacing an employee was estimated to be between $80 000 and $800 000, representing a significant financial impact on technology companies (Von Hagel & Miller 2011).
Technology drives not only a major shift in the source of value generation for companies, but also the evolution of the workplace and, subsequently, the relationship and psychological contract between employer and employee (Sutherland & Jordaan 2004). The psychological contract refers to the perceptions of the employer and employee's mutual obligations towards each other (CIPD 2014).
As technology is a major driver of the changes to the psychological contract, authors writing in business publications, such as Johns and Gratton (2013), are of the opinion that knowledge workers in technology companies are at the forefront of the evolving workplace and have come to expect to be able to 'live' the revolution. Studies on workers in high-technology industries show that these employees are likely to have a slightly different emphasis regarding what they expect from their workplace and from their employer than those in more traditional companies (Medcof & Rumpel 2007).
The changing expectations of employees, particularly in the IT sector, coupled with the evolution of the workplace, present a challenge in understanding the reward preferences of these employees and how these preferences might be changing.
Problem statement
Effective talent attraction, retention and motivation are critical for companies in the IT sector, as is avoiding the impact of employee turnover on their performance. It is hypothesised that developing a nuanced understanding of reward preferences will enable IT companies to better meet the needs of their employees and subsequently lead to higher levels of attraction, retention and motivation.
Whilst there is a plethora of studies in developed markets, like the United States, there is a lack of understanding of knowledge worker reward preferences in the South African context, particularly as these relate to the IT sector, which is likely to exhibit preferences particular to that industry if international trends hold true (Horwitz, Heng & Quazi 2003; Medcof & Rumpel 2007). Most local studies to date were not industry specific. Furthermore, this study contributes to the literature as there is a lack of understanding of how these reward preferences relate specifically to the attraction, retention and motivation of knowledge workers.
Knowledge workers
Knowledge workers are said to be those who create intangible assets by using specialised knowledge and who, due to the changing nature of the knowledge economy in which they operate, need to continuously enhance, upgrade and refresh their knowledge (Sutherland & Jordaan 2004). Studies into factors that influence the retention of knowledge workers indicate that these employees have high levels of egocentrism, are increasingly career-mobile and expect personal learning and development to be a key feature of their relationship with their employer (Sutherland & Jordaan 2004).
Nowhere is the importance of knowledge workers as evident as in IT industries, where these workers are at the forefront of the knowledge economy. In IT, knowledge workers expect to harness technology in the workplace to provide flexibility in their working arrangements (Johns & Gratton 2013). It is notable that job satisfaction, previously considered a reliable antecedent to employee turnover (Sutherland & Jordaan 2004), is not an accurate predictor of knowledge workers' intention to remain with their current employer. Studies suggest that this is because other, more egocentric factors, such as their personal development goals, are important considerations in knowledge workers' career decisions (Sutherland & Jordaan 2004).
This illustrates the demanding nature of knowledge workers and presents employers competing for their skills with the challenge of finding a suitable frame of reference for defining exactly what it is that these highly mobile resources will expect before they will join and stay with a company.
The total rewards concept
The concept of total rewards includes everything that employees value as part of their relationship with an employer (Medcof & Rumpel 2007). It is related to the employee value proposition (EVP), which, in marketing and branding terms, refers to internal brand equity that an employer has in its employees (Van der Merwe 2012).
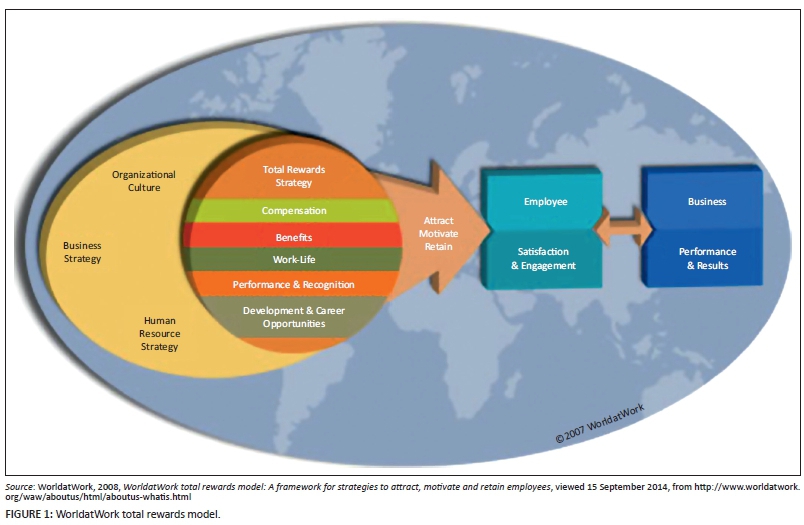
Hlalethoa (2010) asserts that most companies have adopted a form of total rewards model that is derived from the one created and maintained by WorldatWork (2008). This model is illustrated in Figure 1.
The WorldatWork (2008) total rewards model classifies rewards as follows:
1. Compensation: any remuneration in the form of fixed remuneration (also referred to as 'base pay'), which is mandatory compensation that does not vary and is not tied to performance, variable pay, which is compensation that may depend on performance, and short-term and long-term incentives.
2. Benefits, which are ancillary, such as medical or retirement benefits.
3. Work life, which is the structure, processes and environment put in place to support employees to do their jobs.
4. The terms performance and recognition refer to the perception that performance is being measured correctly and is in alignment with the organisation's goals. The terms also refer to the employee's duties, coupled with the employee receiving acknowledgement for helping the organisation achieve its goals.
5. Development opportunities refer to initiatives put in place to upgrade or enhance an employee's skills, whilst career opportunities refer to all factors that contribute to a clear career path and career planning being in place (Hlalethoa 2010; WorldatWork 2008).
Van Blerck (2012) asserts that several variations of this total rewards models exist, with slight differences; however, the underlying components are mostly similar. Whilst differences in defining and categorising reward components are noted across several studies (Moore & Bussin 2012; Nienaber, Bussin & Henn 2011; Schlechter, Hung & Bussin 2014; Snelgar, Renard & Venter 2013), dividing reward components into categories seems to be done based on logical classification, rather than based on the fact that employees seem to show a preference for all the components of a category. For example, whilst Moore and Bussin (2012) and Nienaber et al. (2011) found that components do not show internal consistency when compared to aggregated category scores, Snelgar et al. (2013) found that their revised categorisation showed internal consistency.
These contradictory findings show that there is no definitive correct or incorrect model for defining reward categories and classifying the underlying components. Research by Medcof and Rumpel (2007) reports that the total rewards approach is a promising approach for employees in high-technology industries, as these employees have significantly different reward preferences than other occupational categories.
With the WorldatWork (2008) model being the most widely used as a basis for derived models (Hlalethoa 2010), it was considered to be the most suitable for framing this investigation into the different reward components and categories preferred by knowledge workers.
Understanding reward preferences
Understanding which rewards are preferred by employees is vital for any organisation as a starting point in developing methods of attracting and retaining top talent. Studies undertaken in an effort to deepen this understanding have suggested that reward preferences might differ based on a variety of factors (Bussin 2011). Some of the most widely posited determinants of reward preference include the employee's demographic characteristics, such as age, gender, marital status and race (Bunton & Brewer 2012; Moore & Bussin 2012; Nienaber et al. 2011; Snelgar et al. 2013).
Nienaber et al. (2011) investigated whether employee personality type might be a significant determinant of reward preferences, but found that demographic characteristics played a more significant role, citing, for example, different preferences for employees of different race groups.
Other studies have highlighted the difference in reward preferences between industries, with Medcof and Rumpel (2007) reporting, for example, that employees in high-technology companies exhibit significantly different reward preferences compared to those in more traditional companies, such as a strong emphasis on ongoing knowledge sharing and learning in their work environment. Horwitz et al. (2003) suggest that workers in IT place greater emphasis on having access to the latest technology in their place of work. The work environment also plays a bigger role in retaining employees in this sector than it does in others, with employees expecting, for example, unprecedented flexibility in their working arrangements enabled by technology (Johns & Gratton 2013).
Moore and Bussin (2012) attempted to find out whether generational theory and reward preference could be correlated in the South African context, but found the contrary, suggesting that an employee's life stage might instead be a more significant determinant of reward preferences. A study by Bunton and Brewer (2012), in the United States, similarly found that generational cohort did not significantly determine reward preferences.
It is clear from the literature that demographic and industry-specific factors influence reward preferences; however, the difficulty lies in reliably correlating these factors with certain reward preferences, especially when studies examine employees from different sectors and types of companies. This is further complicated by reward preferences, even for a single employee, varying between those preferences that would encourage them to take up employment with an employer, those that they evaluate when deciding to stay with a current employer and those that motivate them to perform (Snelgar et al. 2013).
Reward preference and attraction, retention and motivation
Studies on reward preferences appear to indicate that they may differ based on three broad scenarios: being initially attracted to a new employer, deciding whether to remain with an existing employer or feeling motivated to perform (attraction, retention and motivation, respectively). Examples in the local context include findings by Snelgar et al. (2013) and Nienaber et al. (2011), which illustrate these differences. Bergmann and Scarpello (2001) note that organisations who use mainly remuneration or monetary compensation as a reward might find themselves challenged to sustain their employees' motivation, which supports the concept of different rewards being preferred in attraction, retention and motivation.
Having established that reward preferences may differ between these scenarios, it is imperative to understand the nature of these differences. In most cases, a competitive total compensation package forms the basis for attracting and retaining top talent (Horwitz et al. 2003; Schlechter et al. 2014). Whilst competitive compensation has been shown to be important in attracting new employees and, when absent, causes existing employees to consider seeking other employment opportunities, the dynamic of motivating people seems to work slightly differently, with the emphasis shifting to the nature of work undertaken by employees, having freedom to plan and schedule work, feeling supported and receiving acknowledgement (Horwitz et al. 2003).
When examining the reward categories, as defined previously in the total rewards model, studies by Nienaber et al. (2011), Snelgar et al. (2013) and Bhengu and Bussin (2012) concur that whilst basic (fixed) monetary compensation is a major factor in attracting employees initially, once this employment 'order qualifier' is in place, employees value a variety of other factors relating to career management, personal development and the work environment when deciding whether to stay with an employer and feeling motivated to perform. Even in studies where basic (fixed) monetary compensation is cited as the most important factor in more than one of these three scenarios, it does appear to behave like a 'hygiene factor' that is the minimum hurdle required to compete for talent, followed by diverging preferences for subsequent reward categories in the three scenarios respectively (Bhengu & Bussin 2012; Nienaber et al. 2011; Snelgar et al. 2013).
Findings on how reward preferences differ between the three scenarios are not consistent in different studies. This appears to be based on a variety of factors, the most apparent of which are: the measuring instrument used, the categorisation of reward preferences and their components, the target population and the industry concerned. For example, Nienaber et al. (2011) found that base pay (fixed compensation) is the biggest factor in attraction, whilst performance and career management were the biggest factors in retention and motivation of employees. Similar findings were made by Snelgar et al. (2013), who found that performance and career management were the most important factors in motivation and the second most important factors in retention.
In somewhat dissimilar findings, Bhengu and Bussin (2012) report that differences were present between the factors influencing attraction, retention and motivation. However, their study showed that monthly salary (compensation) came third in all three scenarios. The authors found that in retention and motivation, quality of the work environment and developmental opportunities were rated most and second most important respectively, whilst regarding attraction, the inverse was true. The findings do, however, support Nienaber et al. (2011), who assert that retention and motivation exhibit similar reward preferences, whilst attraction is dissimilar.
It follows from these findings that companies competing for talent on the basis of money alone are likely to be faced with the phenomenon of employees job-hopping, as these companies are simply competing on price. In order to gain a competitive advantage in the war for talent, there is consensus that competitive pay is only a base requirement and those companies wishing to retain top talent need to ensure that their talent management practices follow a holistic total rewards approach (Stahl et al. 2012).
Research design and objectives
Research objectives
The primary objective of this study was to investigate the reward preferences of knowledge workers in the IT industry in South Africa and the influence of demographic factors on these preferences. The secondary objective was to explore the relationship between these reward preferences and attraction, motivation and retention.
Research design
The research design included a quantitative, empirical and descriptive study of reward preferences. Research was conducted in the form of primary data-gathering, which was done using a survey, consisting of a three-part questionnaire.
Part 1 of the questionnaire collected demographic information from respondents, namely age, gender, race, type of position occupied, length of service with current organisation, level of qualification and type of organisation.
Part 2 was constructed to measure reward preferences. The five categories of rewards defined by the WorldatWork (2008) total rewards model were expanded into components, drawing on previous research done by Hlalethoa (2010), Moore and Bussin (2012) and Nienaber et al. (2011).
Part 3 of the questionnaire consisted of three rank order questions. The aim of this part of the questionnaire was twofold. Firstly, it aimed to verify the overall reward preferences of respondents. Secondly, it served to determine whether respondents had significantly different reward preferences in each of three different scenarios related to an employer's rewards strategy: attracting new employees, retaining existing employees and motivating employees to perform at their peak. The components selected to comprise each of the five categories are listed in Table 1.
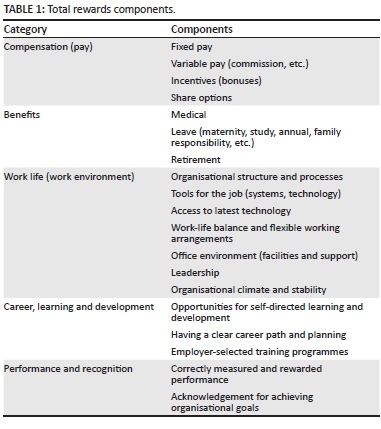
Due to issues with internal consistency of reward components and their categories cited in other studies (Moore & Bussin 2012), it was decided to balance the number of components in each category with the feasibility of measuring respondents' preference for each component in the three different scenarios. To achieve this, the minimum number of reward components in each category were selected that would provide useful insight into the reward components that are most pertinent to the local and industry context of this study.
A new set of questions was designed to measure the respondents' preference for each of the 19 components. The questionnaire used a five-point Likert-type scale, presenting respondents with hypothetical scenarios or statements concerning each reward component. Respondents were asked to evaluate each statement and indicate whether they considered the component unimportant, of little importance, moderately important, important or very important.
Population
The target population consisted of employees of South African IT companies who fitted the definition of knowledge workers (Sutherland & Jordaan 2004). Accordingly, respondents who indicated their job function to be any of the following were excluded: administrative support, facilities and cleaning, clerical and secretarial. A non-probability sampling technique was used where human resources (HR) and line managers in two multinational IT companies (consisting of 482 and 1230 staff members respectively) were asked to distribute the survey to the target population. The sample was thus determined by the accessibility of respondents to the known line and HR managers. A form of snowball sampling was employed, in that HR and line managers were used to cascade the survey into the organisational hierarchy.
The research required a good probability of selecting a sample that was representative of most knowledge workers in South African IT companies. These two organisations were chosen as they had workforces that represented a diverse range of knowledge workers with varied demographics and job functions, ranging from sales to technical experts.
Data collection and analysis
Data were collected by distributing an electronic version of the survey to respondents via selected HR and line managers, using Survey Monkey. Participation of the target population was voluntary, subject to informed consent and kept completely confidential by not collecting personal identifiers as part of the survey.
The second and third parts of the questionnaire in the present study contained the bulk of the information to be collected and consisted of continuous ordinal-type data measuring respondent's agreement on a five-point scale, as well as rank order data. As the research propositions were chiefly concerned with variance in this continuous data, the reference table provided by Bartlett, Kotrlik and Higgins (2001) was used to determine that a total population of 4000 or higher would require a sample size of 119, where the alpha value was 0.05.
Descriptive statistics (mean and median) were generated for the purposes of understanding the relative importance of reward preferences to respondents on the component level. In order for results to assist employers in tailoring their reward strategies in line with the components selected, it was necessary to determine which rewards were favoured by respondents, ranking them by median and then mean to determine this.
The ranking derived needed to be verified to determine whether differences in medians were statistically significant, thereby validating the ranking of overall reward preferences. In order to test the differences between reward component median ratings, pair-wise Wilcoxon signed rank tests were executed on all pairs of reward preferences.
The data was investigated for variance attributable to certain demographic variables. When conducting analysis of variance (ANOVA), a single dependent variable was used: the reward component rating.
General descriptive statistics and histograms were generated for responses based on each of the independent variables of interest. It was determined that their distribution violated the assumption of normality, which is essential in parametric ANOVA. In addition, the dependent variable data were either ordinal (Likert-type scale) or rank order. De Winter and Dodou (2010) found that in such cases, non-parametric methods are the most appropriate and have increased power and reliability when analysing five-point Likert-type ratings, especially if such data violate the assumption of normality required for parametric testing. McKnight and Najab (2010) recommend the Kruskal-Wallis test as the suitable non-parametric equivalent.
The Kruskal-Wallis test was thus conducted by grouping responses into samples based on each of the independent variables and comparing them to detect whether samples may or may not be from the same population (indicating the probability that their variance was statistically significant).
This test was followed by pair-wise testing to determine which group in the sample (based on the independent variable) was responsible for the variance. This was done using the Mann-Whitney U-test, which is also known as the Wilcoxon rank sum test, and which tests for differences between two groups where the variable being measured is ordinal and where there is no specific distribution (McKnight & Najab 2010).
In each of the three scenarios presented to respondents, corresponding to preference for attraction, retention and motivation respectively, the data contained the top ten preferred components selected by each respondent. This data were transformed into rank scores according to the ranks assigned to them by respondents.
Descriptive statistics were generated for each of the three scenarios (attraction, retention and motivation) to illustrate the overall rank scores achieved by the 19 reward components in each scenario and to allow comparison to determine where possible differences in preference might be between the scenarios.
In order to identify where statistically significant reward preferences might exist across the three scenarios and across all reward components, a Friedman ANOVA was conducted, with each of the scenarios being regarded as a dependent sample, as they were rated by the same respondents.
Where possibly significant differences were indicated by the Friedman ANOVA (p-value smaller than 0.1), post-hoc Kruskal-Wallis tests were conducted on the reward component across the three scenarios, to determine whether the variance was statistically significant.
The primary objective of this study was to investigate the reward preferences of knowledge workers in the IT industry in South Africa. The secondary objective was to explore the relationship between these reward preferences and attraction, motivation and retention.
Research hypotheses
Research hypothesis 1
South African IT knowledge workers have overall reward preferences, which show significant differences as they relate to attraction, retention and motivation respectively.
Research hypothesis 2
Demographic characteristics play a significant role in determining the reward preferences for South African IT knowledge workers.
Research limitations
The main research limitation was that the sampling technique used could not guarantee adequate representation of all demographic characteristics intended to be measured and compared. In addition, because two large multinationals were targeted, the findings may apply mostly to corporate IT companies and may not be generalisable to all companies operating in the IT sector, particularly smaller, niche environments.
The research aimed to develop a better understanding of reward preferences and their relationship to attraction, retention and motivation and did not explore any causal relationships in differing reward preferences. Whilst this still provides valuable insight into what reward preferences actually are in the local context, there may be complex reasons for differences in such preferences across different demographics, which were not evaluated.
Results
Descriptive statistics
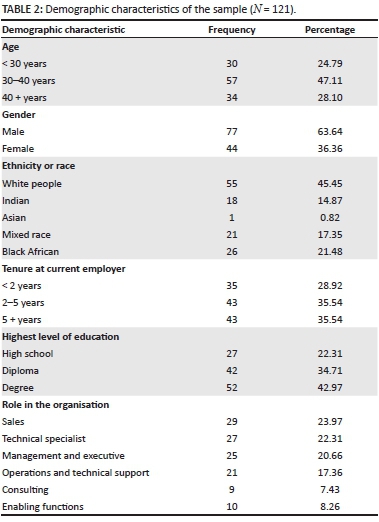
The survey was distributed to a total of 563 potential respondents; 135 completed questionnaires were returned. Of these responses, 14 were incomplete or unusable, providing 121 usable responses. This signified a response rate of 23.9%. The demographic characteristics of the sample are described in Table 2.
Reward preferences
Internal consistency, measured by calculating the Cronbach's alpha of reward categories (compensation, benefits, work life, career, learning and development and performance and recognition) was found to be low (smaller than 0.6) for all categories set out in Table 1, except work-life, which showed only acceptable consistency (between 0.6 and 0.7). For this reason reward preferences were evaluated individually and not on category level.
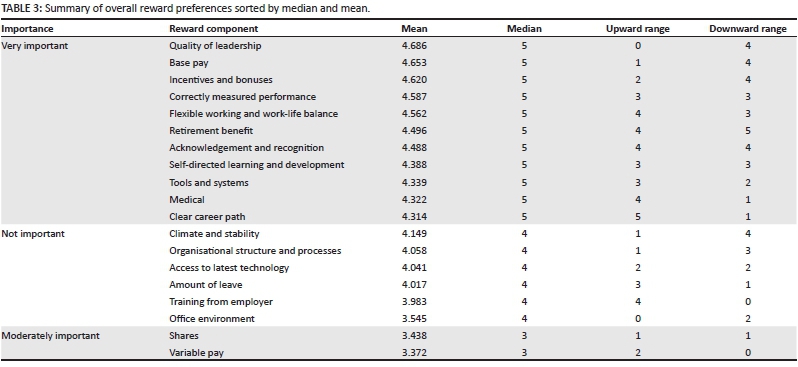
Overall preference for different reward components was measured on the central tendency of their scores on the five-point Likert-type scale. A summary of these measures is presented in Table 3.
The variance of ratings was such that it was only possible to rank ratings into three major categories of importance. However, results of the Wilcoxon matched-pairs tests between each item and the remaining items showed some significant differences. These are expressed in Table 3 as the distance to the nearest upward or downward item that shows a statistically significant difference, labelled 'upward range' and 'downward range' respectively.
Respondents showed statistically similar preferences for the first 11 items shown in Table 3, corresponding to a rating of 'very important'. The next six items had medians corresponding to a rating of 'important', whilst only the last two items showed a median corresponding to a rating of 'moderately important'. No components showed that they were considered 'of little importance' or 'unimportant' by the sample in totality.
The upward and downward range numbers show that the approximate ranking of items in Table 3 is accurate, with ranges increasing and decreasing respectively as boundaries to the three categories of importance are approached. However, results of the Wilcoxon matched-pairs tests between items illustrated that there are significant differences between some items, especially within the first category of importance; for example, 'Quality of leadership' (Item 1) was shown to be statistically more important than 'Retirement benefit' (Item 6).
Demographic influences on reward preference ratings
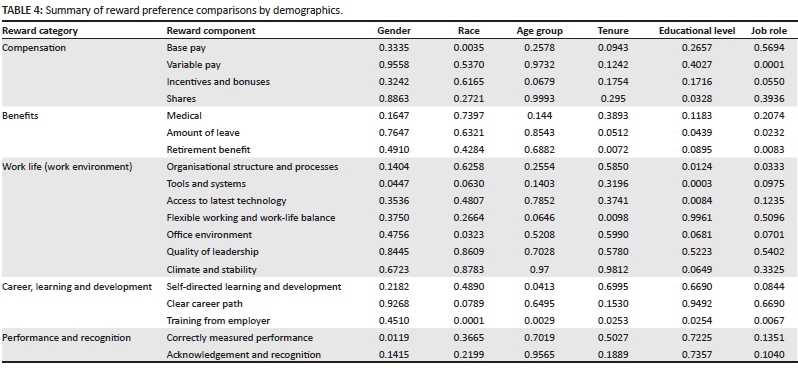
The influence of demographics on overall reward preference ratings was measured by conducting a Kruskal-Wallis ANOVA and controlling for each demographic as the independent variable.
The results of these tests per demographic variable, in the form of the relevant p-values, are shown in Table 4. Cases where the tests for differences were significant are shown in bold and are shaded.
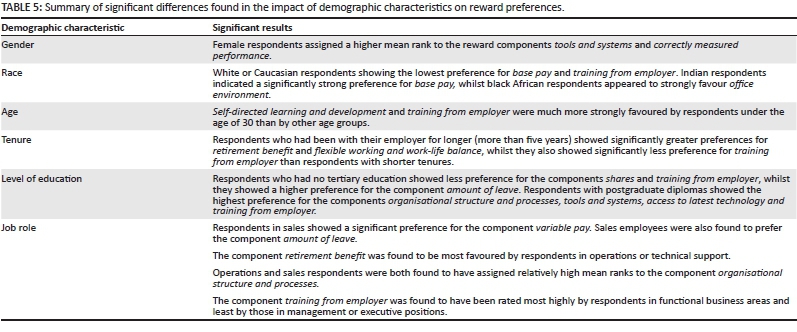
Table 4 shows that differences based on all demographic variables were found. Where significant differences at the 95% confidence level were found (p-value below 0.05), the relevant demographic and reward components were inspected on the mean ranks to provide information as to the nature of the differences. A summary of the significant differences appears in Table 5.
Reward preferences in attraction, retention and motivation
Respondents showed similar preferences for the components base pay and incentives and bonuses across all three scenarios. Similarly, the component flexible working and work-life balance was found to be highly preferable in all three scenarios. It is notable that components categorised as benefits in the total rewards model were found to be more preferable in the scenario of attracting and retaining, whilst they were not preferred in the motivation scenario.
A summary of the median and mean rank scores of all components in the attraction scenario is shown in Table 6.
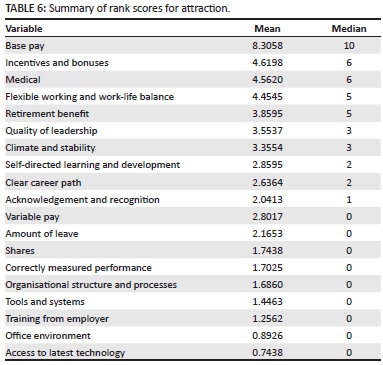
The top ten reward components preferred by respondents for the attraction scenario are shown above the line, with less important components shaded.
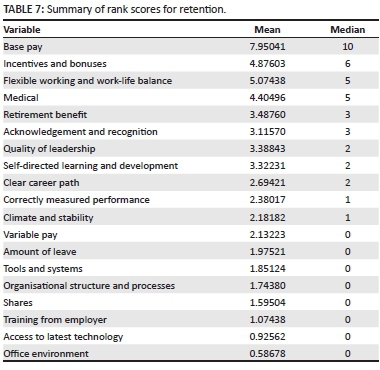
In the retention scenario, reward components were found to be similarly preferred, though in a slightly different order than in the attraction scenario. A summary of mean and median rank scores for reward components in the retention scenario is shown in Table 7. The top ten components preferred (determined by sorting, first according to mean and then according to median) in the retention scenario are shown above the line, with less important components shaded.
In the motivation scenario, respondents showed similar preferences for the components base pay, incentives and bonuses and flexible working and work-life balance, whilst preferences for components relating to the reward categories of career, learning and development and performance and recognition featured prominently.
A summary of mean and median rank scores for reward components in the motivation scenario, with the top ten reward components shown above the line and less important components shaded, is shown in Table 8.

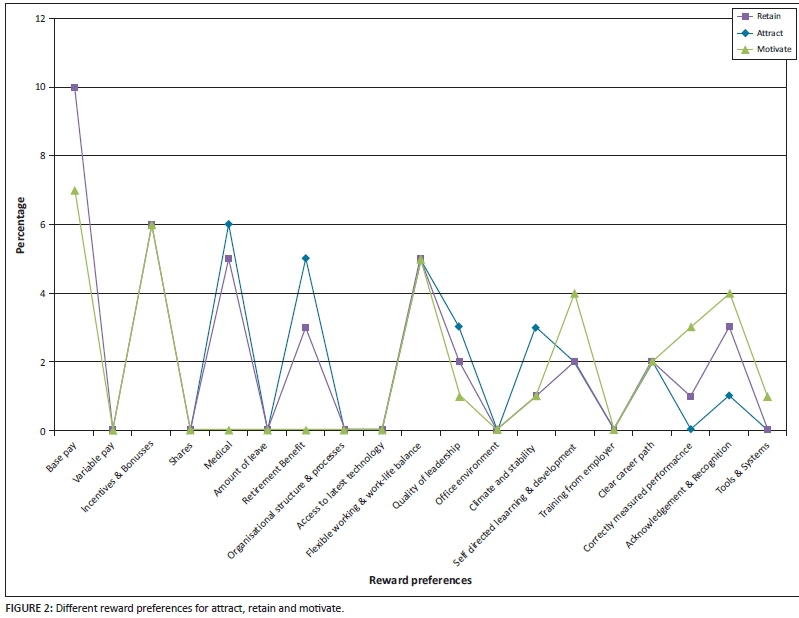
Differences between attraction, retention and motivation
Respondents showed significantly different preferences for many components across the three scenarios. An illustration of differences in median rank scores for all reward components is shown in Figure 2. This graph shows the three different scenarios - attraction, retention and motivation - and the mean score assigned to each reward component by respondents for each scenario.
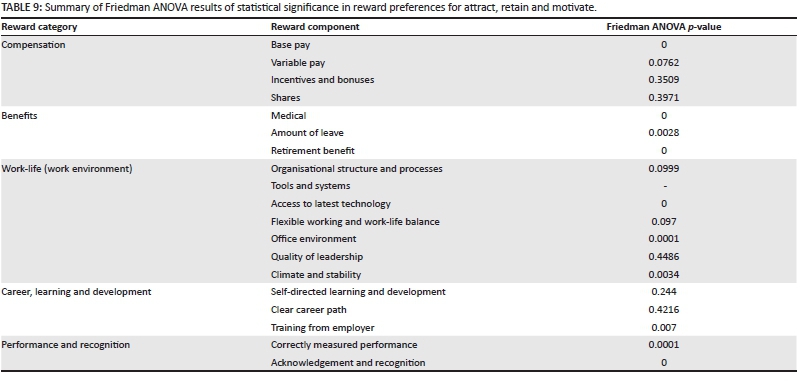
Results of the Friedman ANOVA tests on each reward component across the three scenarios found statistically significant differences in preference for all reward components, except five. A summary of the relevant p-values is presented in Table 9 with significant p-values (p-value below 0.05 at the 95% confidence level) presented in bold and shaded.
Discussion of results
Research hypothesis 1
The results show that there are overall reward preferences in knowledge workers in the IT sector in SA. Table 10 indicates the rank (relatively speaking) of each component, as well as its category of overall importance to respondents, based on Likert-type ratings.
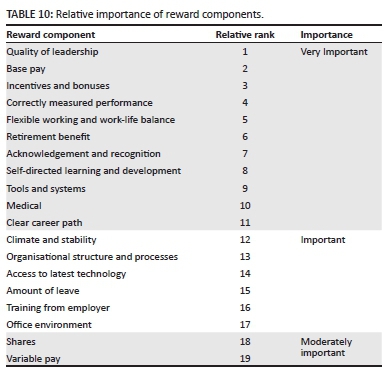
The findings support the literature and show that the main elements of monetary compensation are still crucially important (Bunton & Brewer 2012; Horwitz et al. 2003; Moore & Bussin 2012; Nienaber et al. 2011; Schlechter et al. 2014; Snelgar et al. 2013). Findings in this study highlight basic or fixed pay and the opportunity to earn incentives and bonuses as being very important to respondents.
The inclusion of benefits such as medical and retirement in the factors considered very important supports the notion in contemporary business writing (such as in the work of Horwitz et al. 2003) that a competitive total package is a criterion for entry into the competition for talent.
The findings illustrate the relatively high importance of flexible working arrangements and work-life balance to knowledge workers in the IT industry, which is in agreement with more recent industry-specific business literature by Johns and Gratton (2013) and academic studies in the local context (Nienaber et al. 2011).
Components that can be considered part of the work-life (work environment) reward category were found to be important to respondents, in line with findings in the high-technology industry by Medcof and Rumpel (2007); however, they were exceeded in importance by reward components that belong to the categories career, learning and development and performance and recognition. This appears to be congruent with assertions that knowledge workers place high value on constantly developing and upgrading their skills (Sutherland & Jordaan 2004) and with findings by studies in the local context that found that a high value is placed on career development and personal growth opportunities (Nienaber et al. 2011).
The findings regarding attraction, retention and motivation show that there are significant differences between rewards that matter to knowledge workers in these three scenarios. This supports business literature and academic studies on the subject (Bhengu & Bussin 2012; Horwitz et al. 2003; Kwon & Hein 2012; Nienaber et al. 2011; Snelgar et al. 2013).
Overall, the findings of this study show somewhat similar preferences in the scenarios of attraction and retention on most components, whilst they differ notably for motivation. This supports the work of Snelgar et al. (2013), but is in contrast to the study by Nienaber et al. (2011), who found that attraction was the scenario that differed from the other two.
Drawing together the above findings and theory, a competitive rewards model for South African IT knowledge workers is proposed. This model (illustrated in Figure 3) shows those factors regarded as hurdles to entry into the talent competition, called minimum talent qualifiers, followed by the most important factors for respectively attracting, retaining and motivating IT knowledge workers.
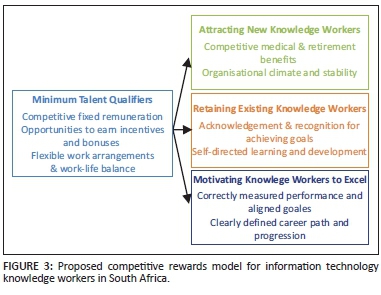
The model does not suggest that components should be considered in isolation, or that those listed as the most important in attraction, for example, are unimportant for, say, retention. Rather, it is an attempt at a holistic structuring of the most pertinent rewards for South African IT knowledge workers.
Research hypothesis 2
Studies on the influence of demographics on reward preferences appear to be largely motivated by the desire to find meaningful ways of segmenting the knowledge workforce so that more targeted, and therefore more effective, reward strategies can be designed (Du Toit, Erasmus & Strydom 2007; Moore & Bussin 2012).
This study found differences in reward preference based on several demographic characteristics, but these should be interpreted in light of the usefulness of said differences in providing meaningful segmentation variables.
Whilst it was found that some differences existed between race groups, and even though other authors have suggested investigating race as a segmentation variable (Moore & Bussin 2012), the differences found here did not prove practically useful. The present study found that Indian respondents indicated a higher preference for basic or fixed remuneration, whilst they showed the lowest preference for the office environment (facilities, decor and such), which are not really aspects that can be targeted at individual race groups. The only other significant difference showed white or Caucasian respondents indicated less of a preference for training determined and provided by their employer.
Snelgar et al. (2013) found that gender played a role in determining reward preferences, but pointed out that this is not always the case, citing Paddey and Rousseau (2011), who found no differences between the genders in this regard. They assert that women place more emphasis on base pay, the quality of the work environment and work-life balance. This was not evident in the findings of the present study of IT knowledge workers, which found that women place more emphasis on having performance correctly measured and aligned to the organisation's goals.
The findings related to age group show that younger employees placed higher value on learning and development driven and directed by them, as well as training selected and provided by the employer. Findings related to age group are suggested to be related to life stages (Snelgar et al. 2013). This suggests that younger employees are at an earlier stage of their career, when learning and development play an important role in their future career progression. Similarly, the present study found that employees with a tenure of longer than five years consider retirement benefits to be more important, which could also be a reflection of their career's life stage.
Findings also show that employees with longer tenures have a slightly lower preference for training determined and provided by their employer, which probably stems from them being established in the employer's environment and familiar with the domain knowledge required to perform their work.
The results show that employees with higher levels of education show less preference for optimal tools and systems, organisational structure and processes in place to do their jobs. This is likely to be a symptom of employees who are engaged in more functional work relying less on their knowledge capital for the bulk of their performance. They would be more beholden to the organisation's processes and to the systems they rely on for performing their jobs. Employees with higher knowledge capital would possibly see their performance as relying more on the skilful application of said knowledge in order to succeed.
Concerning job roles, comparative studies in the local context are scarce, particularly industry-specific studies such as the present study. Findings of the present study show some differences in rewards preferred by employees with specific job roles. It found that workers in enabling functions such as marketing, HR and finance show a stronger preference for training determined and provided by their employer, whilst those in management and executive positions consider employer-provided training relatively less important. This is possibly due to those in management and executive positions requiring more self-driven development to perform in their jobs rather than domain-specific training, such as that normally provided by employers.
Conclusion
This research showed that there are specific reward preferences for knowledge workers in the IT sector in SA. The impact of demographic characteristics on reward preferences was also demonstrated. A model for structuring competitive total rewards in the South African IT industry was proposed that shows that there are different reward strategies that can be successfully used to attract, retain and motivate knowledge workers. The war for talent in both the local and the global marketplace will only be won by those who adopt a total reward strategy that is appropriate to the preferences of their knowledge workers and keeps pace with the evolving trends in the world in which we work.
Recommendations
It is recommended that managers and leaders in the South African IT sector inspect their organisations' rewards through the lens of the total rewards concept used throughout this study and that they take stock of whether they have considered all of the aspects required to acquire and retain top talent.
The simplified list of rewards components used in this study could provide a basis for investigating whether they are meeting the preferences of their knowledge workers, or for conducting employee surveys of their own. If employers wish to know where to start and what to focus on, the relative rankings determined by this study will provide insight into the importance of different total rewards components. Leaders in the IT industry should be aware that the war for talent cannot be won on price alone.
Areas for future research
It would be meaningful to investigate if the simplified, condensed reward components measured could be factor analysed to determine an appropriate categorisation.
One shortcoming of this study, which should be addressed in the local context, is the type of rating instrument used to measure overall reward preferences. The five-point Likert-type items ranged from unimportant to very important, but the median value, moderately important, is not truly a preference-agnostic point on the scale. Furthermore, the nature of reward preferences means that studies that ask respondents to rate their preferences are likely to be plagued by low variance and positive skewedness towards higher ratings. Realistically, people consider all rewards important to some extent.
A recommendation would be to address this shortcoming by devising a more appropriate measuring instrument, perhaps asking respondents to score reward components out of 10, by enlarging the rating scale to 7 or 10 points, and modifying the interval descriptions, or by forcing pair-wise trade-off questions, which might be more complicated, but would perhaps yield a more accurate real ranking of reward preferences.
Acknowledgements
Competing interests
The authors declare that they have no financial or personal relationship(s) that may have inappropriately influenced them in writing this article.
Authors' contributions
M.B. (University of Johannesburg) was the project leader and W.T. (University of Pretoria) was responsible for the experiment and project design. M.B. made conceptual contributions and wrote the manuscript.
References
Bartlett, J.E., Kotrlik, J.W. & Higgins, C.C., 2001, 'Organizational research: Determining appropriate sample size in survey research', Information Technology, Learning, and Performance Journal 19(1), 43-50. [ Links ]
Beechler, S. & Woodward, I.C., 2009, 'The global "war for talent"', Journal of International Management 15(3), 273-285. http://dx.doi.org/10.1016/j.intman.2009.01.002 [ Links ]
Bergmann, T.J. & Scarpello, V.G., 2001, Compensation decision making, 4th edn., Harcourt, Inc. [ Links ]
Bhengu, M.B. & Bussin, M., 2012, 'The perceived effectiveness of employee share options as a mechanism of talent management in South Africa', Acta Commercii 12(1), 85-93. [ Links ]
Bunton, T.E. & Brewer, J.L., 2012, 'Discovering workplace motivators for the millennial generation of IT employees', Proceedings of the ACM 1st Annual conference on Research in Information Technology 13-18 October. http://dx.doi.org/10.1145/2380790.2380795 [ Links ]
Bussin, M., 2011, The remuneration handbook for Africa: A practical and informative handbook for managing and recognition in Africa, Knowres Publishing, Randburg. [ Links ]
CIPD, 2014, 'The psychological contract - Resource summary', viewed 27 September 2014, from http://www.cipd.co.uk/hr-resources/factsheets/psychological-contract.aspx. [ Links ]
De Winter, J.C. & Dodou, D., 2010, 'Five-point Likert items: T test versus Mann-Whitney-Wilcoxon', Practical Assessment, Research & Evaluation 15(11), 1-12. [ Links ]
Dess, G.G. & Shaw, J.D., 2001, 'Voluntary turnover, social capital and organizational performance', Academy of Management Review 26(3), 446-456. [ Links ]
Dewhurst, M., Hancock, B. & Ellsworth, D., 2013, 'Redesigning knowledge work', Harvard Business Review 91, 58-64. [ Links ]
Du Toit, G.E., Erasmus, B.J. & Strydom, J.W., 2007, Introduction to business management, 7th edn., Oxford University Press, Cape Town. [ Links ]
Hlalethoa, J.J.R., 2010, Reward strategy as a staff retention tool at the financial services board, unpublished Master of Commerce thesis, Department of Industrial Psychology and People Management, University of Johannesburg. [ Links ]
Horwitz, F.M., Heng, C.T. & Quazi, H. A., 2003, 'Finders, keepers? Attracting, motivating and retaining knowledge workers', Human Resource Management Journal 13(4), 23-44. http://dx.doi.org/10.1111/j.1748-8583.2003.tb00103.x [ Links ]
Johns, T. & Gratton, L., 2013, 'The third wave of virtual work', Harvard Business Review 91, 66-72. [ Links ]
Kwon, J. & Hein, P., 2012, 'Employee benefits in a total rewards framework', Benefits Quarterly 29(1), 32-38. [ Links ]
McKnight, P.E. & Najab, J., 2010, 'Mann-Whitney U-test', in The corsini encyclopaedia of psychology, John Wiley & Sons, Hoboken, NJ. http://dx.doi.org/10.1002/9780470479216.corpsy0524 [ Links ]
Medcof, J.W. & Rumpel, S., 2007, 'High technology workers and total rewards', The Journal of High Technology Management Research 18(1), 59-72. http://dx.doi.org/10.1016/j.hitech.2007.03.004 [ Links ]
Moore, A. & Bussin, M., 2012, 'Reward preferences for generations in selected information and communication technology companies', SA Journal of Human Resource Management/SA Tydskrif vir Menslikehulpbronbestuur 10(1), Art. #325, 9 pages. [ Links ]
Morrell, K., Loan-Clarke, J. & Wilkinson, A., 2004, 'The role of shocks in employee turnover', British Journal of Management 15(4), 335-349. http://dx.doi.org/10.1111/j.1467-8551.2004.00423.x [ Links ]
Nienaber, R., Bussin, M. & Henn, C., 2011, 'The relationship between personality types and Reward preferences', Acta Commercii 11(2), Art. #153, 9 pages. [ Links ]
Paddey, M. & Rousseau, G.G., 2011, 'The effects of the global recession on the work restructuring levels of managers in the South African automotive industry', South African Journal of Economic and Management Sciences 14(3), 346-360. [ Links ]
Schlechter, A., Hung, A. & Bussin, M., 2014, 'Understanding talent attraction: The influence of financial rewards elements on perceived job attractiveness', SA Journal of Human Resource Management/SA Tydskrif vir Menslikehulpbronbestuur 12(1), Art. #647, 13 pages. http://dx.doi.org/10.4102/sajhrm.v12i1.647 [ Links ]
Snelgar, R.J., Renard, M. & Venter, D., 2013, 'An empirical study of the reward preferences of South African employees', SA Journal of Human Resource Management 11(1), Art. #351, 14 pages. [ Links ]
Stahl, G., Björkman, I., Farndale, E., Morris, S.S., Paauwe, J., Stiles, P. et al., 2012, 'Six principles of effective global talent management', Sloan Management Review 53(2), 25-42. [ Links ]
Sutherland, M. & Jordaan, W., 2004, Factors affecting the retention of knowledge workers, University of Johannesburg, Johannesburg. [ Links ]
Van Blerck, T.G., 2012, The relationship between executive remuneration at financial institutions and economic value added, unpublished MBA thesis, University of Pretoria. [ Links ]
Van der Merwe, S.J.M., 2012, Remuneration's role in the EVP decision-making process, unpublished MBA dissertation, University of Pretoria. [ Links ]
Von Hagel, W.J. & Miller, L.A., 2011, 'Precipitating events leading to voluntary employee turnover among information technology professionals', Journal of Leadership Studies 5(2), 14-33. http://dx.doi.org/10.1002/jls.20215 [ Links ]
Wöcke, A. & Heymann, M., 2012, 'Impact of demographic variables on voluntary labour turnover in South Africa', The International Journal of Human Resource Management 23(16), 3479-3494. http://dx.doi.org/10.1080/09585192.2011.639028 [ Links ]
WorldatWork, 2008, WorldatWork total rewards model: A framework for strategies to attract, motivate and retain employees, viewed 15 September 2014, from http://www.worldatwork.org/waw/aboutus/html/aboutus-whatis.html [ Links ]
 Correspondence:
Mark Bussin
PO Box 2334, Saxonwold 2132
South Africa
drbussin@mweb.co.za
Received: 06 Oct. 2014
Accepted: 06 May 2015
Published: 27 July 2015

