


Serviços Personalizados
Artigo
 Inglês (pdf)
 Artigo em XML
 Referências do artigo
Indicadores

Links relacionados
-
 Citado por Google
 -
 Similares em Google
Compartilhar

 Permalink
SA Orthopaedic Journal
versão On-line ISSN 2309-8309
versão impressa ISSN 1681-150X
SA orthop. j. vol.21 no.2 Centurion 2022
http://dx.doi.org/10.17159/2309-8309/2022/V21N2A0
EDITORIAL
Data and decision making – from odd to artificial
Leonard C Marais
Department of Orthopaedics, School of Clinical Medicine, University of KwaZulu-Natal, Durban, South Africa

With my term as Editor-in-Chief of the SAOJ coming to an end soon, I cannot help but reflect on some of my past experiences in this role. Perhaps the most challenging (and satisfying) was the need to get to grips with some of the more intricate aspects of research methodology and statistics. At first glance, these concepts seem fairly straightforward, but almost ubiquitously become exceedingly complex the harder you look. The odds ratio (OR) is an excellent case in point.
There are a number of ways in which the measure of association between an exposure and an outcome can be expressed. ORs are probably the most commonly used. The current emphasis on reporting 95% confidence intervals (CI), rather than only p-values, has resulted in us seeing and doing a lot more logistic regression. Along with the 95% CI, the statistical program also provides the OR, which is then reported in our results. Now, ORs are tricky things. To justify this statement, I am going to have to go way back to the start, where all good research should start, with the definitions.
A ratio is simply a number obtained by dividing one number by another number, and there is not necessarily a relationship between the numerator and denominator. A proportion is a ratio that relates a part to a whole, thus there is a relationship between the numerator and denominator. Rate is a proportion where the denominator also takes into account another dimension, typically time. Defining probability (P) is a minefield, but for our purposes, we will limit it to the measure of the likelihood that an event will occur. With the basics out of the way, let us delve a little deeper.
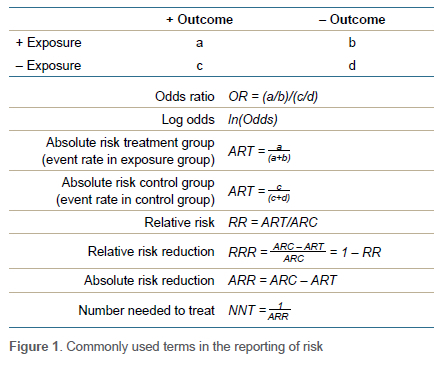
Relative risk (RR), also known as the risk ratio, is a descriptive statistic commonly used in analytical studies. Risk can be defined as the probability of the outcome of interest occurring. RR is therefore essentially a ratio of proportions. In statistical terms, RR is equal to the event rate in the exposed group divided by the event rate in the non-exposed (control) group (Figure 1). For example, imagine we are performing a study comparing the risk of developing infection following grade III open fractures when antibiotics are given within an hour of the injury (treatment group) or not (control group). If 5 out of 100 patients in the treatment group and 20 out of 100 patients in the control group get an infection, we have a relative risk of 0.25. RR = 0.25 means exposed patients (i.e., in the treatment group) are 0.25 times as likely to develop the outcome of interest. We could also state that patients receiving antibiotics within an hour were 75% (0.75 = 1 - 0.25) less likely to develop infection. As clinicians we generally prefer to think in terms of probabilities and relative risk.
The other commonly used descriptive statistic to report measure of association is the odds ratio (OR). Odds can be defined as the relative probability of the outcome of interest occurring. So, what is this probability relative to? - the probability of outcome not occurring. In other words, odds represent the ratio of the probability of the event occurring over the probability of the event not occurring. Odds can mathematically be defined as equal to (P/1-P). The OR then is a ratio of ratios and equal to odds of outcome in the exposed group divided by odds of outcome in the non-exposed control group. An OR < 1 means a reduced odds of the outcome of interest occurring while an OR > 1 implies increased odds. Thus, in our open fracture example study, the OR would be 0.21. This would mean that the odds (not risk) of infection is 79% lower in the group that received antibiotics. If an OR is 3.8, that would mean that odds of the outcome of interest occurring was increased by 3.8 times.
For the sake of completeness, I will also mention number needed to treat (NNT), which is essentially the number of patients that need to receive the exposure to prevent one unwanted outcome. It is defined as the inverse of the absolute risk reduction (ARR). ARR is equal to event rate in the control group (CER) minus the event rate in the exposed group (EER).
At this point, it might be useful to reflect on the origin of ORs. The first rationale has to do with study design. In cross-sectional studies, the RR can be calculated from the prevalence. In cohort studies RR can be calculated from the incidence. If the incidence or prevalence is not available in case-control studies, then OR may be the only option to provide an indication of the measure of association.1 It is important to remember that case-control studies are typically used to study rare diseases or events. Why this is relevant, will hopefully make more sense shortly. The second reason for ORs' existence is statistical in nature and somewhat more complex. Basically, logistic regression provides an OR rather than RR, even in a cohort study, because of the frequency of convergence problems during the mathematical modelling.2 What is a convergence problem? The explanation is beyond the scope of this piece, and my understanding. It has something to do with the fact that regression aims to maximise the likelihood (by finding the maximum log likelihood) through iteration and the problem occurs when the process cannot converge on a best-fit model. But I digress ...
Now before we examine ORs any further, we need to have a look at how ORs are computed by our statistical software. Please bear with me as things are about to get messy. In our open fracture example above, the baseline odds for infection was 0.25; thus 20 infections/80 no infections. Now imagine we increase our sample size by 1 000 and we have improved our treatment to the extent that we still only have 20 infections. This will equate to an odds of 0.02 for infection. But if we turn it around and ask what are the odds of not getting an infection, it will be 54 (1080/20). It's a problem of scale; 0.02 looks much closer to 1 than 54. While representing exactly the same event, the odds of infection not occurring appear to be a lot bigger than infection occurring. How did statisticians solve the problem? By using the logarithm (log) function. (Note: in logistic regression, log means the natural log [loge or ln]). Log odds is the log of the odds, i.e., loge(odds). Why use log odds? Basically, to create a fair comparison scale. Log odds for infection occurring = loge(20/1080) = -3.99. Log odds for infection not occurring = loge(1080/20) = 3.99. Using log odds creates symmetry in the scale by creating outputs that are normally distributed around zero.3
When logistic regression is performed by a statistical program it uses the logit function, where logit  . The regression coefficient (b) reported in the outpu t tab l e is the amount of change expected in the log odds when there is a one unit change in the exposure variable with all of the other variables in the model being held constant. The OR is then computed as the exponential function of the regression coefficient associated with a one-unit increase in the exposure. In mathematical terms OR = eb1 (where e= 2.718).
So what, I hear you ask. Well, there are a number of implications. First, it's important to recognise that ORs should not be interpreted as an equivalent to RR. It is incorrect to say that with an OR of 4 there is a 'four-fold increase in the risk'. OR always overestimates the RR and represents a poor approximation of relative risk when the baseline risk (in the control group) for the outcome of interest is high (roughly more than 5-10%).4 As with all statistical tests, certain assumptions are made and this one is called the 'rare disease assumption'. In rare diseases, the odds are close to the risk as the number of non-events is close to the total number of subjects.5 Thus, with a baseline risk of around 5%, an OR of 4 would equate to a relative risk of roughly 3.5. With a baseline risk of 25%, an OR of 4 would equate to the relative risk of about 2.5, and at 50%, an OR of 4 a relative risk of only about 1.5. You will notice the exponential nature of the relationship. Methods have been described by which the OR estimated by logistic regression can be converted to a 'corrected' risk ratio which is closer to the 'true' risk ratio.6 This may be necessary in cohort studies where the event rate is more than 10% and the OR more than 2.5 or less than 0.5.
Secondly, when the OR is calculated by performing logistic regression, the sample size is important. Logistic regression calculates the OR from the regression coefficient where OR = eb. To determine the coefficient, it uses a maximum likelihood estimation (MLE). MLE is a method of estimating the value of the parameters of a model from observed data in a way that these values will maximise the probability that the process described by the model produces the actually observed data. You might be wondering, as I did, how the regression coefficient is calculated. You will have to trust me when I say: Let's not go there. What is important though is to recognise that the behaviour of maximum likelihood estimation is unpredictable when dealing with small sample sizes. Some say that 100 should be the minimum sample size.7
Thirdly, we have the problem of 'non-collapsibility'. Since most of the predictors we use in a multivariate model are correlated to some degree, it is common for regression coefficients to change from one model to the next. In fact, as you include more variables in a model that are predictive of an outcome, the magnitude of the coefficient of a variable unrelated to others will keep increasing.8 Ultimately this also creates problems for us in meta-analysis. The ORs used in meta-analysis will come from different studies using different models with varying degrees of omitted variables and may not be directly comparable.
I will admit that I may have embellished here somewhat and it is difficult to say exactly how large the effect size of the mentioned problems are in the studies we typically read. Furthermore, I am not trying to imply it is wrong to report ORs, it should just be interpreted correctly. And it remains vital that we do not only report relative measures of association (like ORs and RRs), but ensure that we also clearly communicate absolute measures, like event rates in the respective groups. Others have recommended that we should try and report at least one other measure of effect size alongside the OR.8 The result is that we clinicians may have to familiarise ourselves with a host of new statistical methods and concepts like Poisson regression and negative binominal regression.9 But will these more complex statistical methods improve our decision making?
One can foresee us working in this, let us call it, 'analytical' way for some time and therefore an understanding of these concepts remains valuable. However, the issues with ORs also highlight the fragility of our analytical approach, which may have more profound implications. As clinicians, we aim to base our treatment on the highest levels of evidence, mainly meta-analysis. Thus, we will, for example, decide to, or not to, internally fixate a patient's fractured clavicle based on this evidence. Yet we are often left with the nagging feeling that the analytics we are using and the inferences we have drawn may have not accounted for all the complexity involved in the decision-making process. Do the observations from a population as a whole provide meaningful evidence for decision making at a patient level?10
We recognise the shortcoming of the OR measure itself, and know there are others. There is power, reliability, validity, fragility, heterogeneity and a host of other confounders that could have crept in at the individual study level or during the synthesis. Then there is the fact that we are using the output of our analytical approach as a constant function, i.e., whatever the input into the equation, the output remains constant. If we choose operative management of clavicle fractures based on the OR for non-union, for example, the 16-year-old motocross enthusiast will get treated with internal fixation, as will the 36-year-old accountant who occasionally cycles. An oversimplification, I agree, but there may be some truth to the argument. The impact of a host of input variables may remain unaccounted for when the decision is based on a few outcome variables from the study sample as a whole only. There may well be circumstances where a certain combination of input variables like patient factors, fracture pattern and displacement, etc., might result in an OR that would favour nonoperative management.
Will adding more inferential statistics to our results or computing them in much more elaborate ways really improve our ability to choose the correct treatment for the patient sitting in front of us? Or will a larger sample size or the 'big data' approach solve our problem? It may well help, but there may be alternative ways in which data can be used to provide us with an output that assists us with choosing the optimal management strategy at individual patient level. Ironically, the answer again lies in the form of logistic regression and the logit function. This mathematical function has found major application in artificial intelligence (AI), and machine learning in particular. Machine learning involves the building of a model by looking at data and identifying patterns, and then using those insights to better complete its assigned task. Any task that requires a set of data inputs or rules can be automated using machine learning, even the more complex tasks. And the machine learns from new data, continuously refining the model.
The decision to fixate or not fixate a clavicle might therefore become 'AI-based'. While it would still be founded on the available data, i.e., evidence-based, the algorithms and models will be so complex it would likely be beyond our comprehension. And we are not talking about the distant future here. If you look at any edition of a prominent orthopaedic journal these days, you are bound to And at least one machine-learning article. Currently these models are mostly focused on detection of pathology (pattern recognition) or the prediction of an outcome, prognosis or complications. A systematic review published in 2021 identified 34 papers that evaluated machine learning as a patient-provider decision-making tool.10 The majority of these studies focused on risk prediction and patient stratification, which can then be used to inform decision making. For example, the International Spine Study Group worked on a model to predict major complications after spinal deformity correction surgery.11 Some took it a step further, venturing into the field of making the actual decision. Azimi et al., for example, use an artificial neural network to select surgery for patients with lumbar spinal stenosis.12 I agree, that hits close to home.
While it is not inconceivable that these novel decision-making tools may become part of our practice in the future, some things won't change. We will still want, and need, to have an understanding of how it works and how to use it correctly. The rabbit hole will most likely just get a bit deeper.
References
1. Sacket DL, Deeks JF, Altman DG. Down with odds ratios! Evidence-Based Med. 1996;1(6):164-66. [ Links ]
2. Williamson T, Eliasziw M, Hick GH. Log-binomial models: exploring failed convergence. Emerg Them Epidem. 2013:10(1):14. https://doi.org/10.1186/1742-7622-10-14. [ Links ]
3. Agarwal P. What and why of log odds. Towards Data Science. 9 July 2019. Available from: https://towardsdatascience.com/https-towardsdatascience-com-what-and-why-of-log-odds-64ba988bf704. Accessed 14 February 2022. [ Links ]
4. Schmidt CO, Kohlmann T. When to use the odds ratio or the relative risk? Int J Public Health. 2008;53(3):165-67. https://doi.org/10.1007/s00038-008-7068-3. [ Links ]
5. Schulz KF, Grimes DA. An overview of clinical research: the lay of the land. Lancet. 2002;359(9300):57-61. https://doi.org/10.1016/s0140-6736(02)07283-5. [ Links ]
6. Zhang J, Yu KF. What is relative risk? A method of correcting the odds ratio in cohort studies of common outcomes. JAMA. 1998;280(19):1690-91. https://doi.org/10.1001/jama.280.19.1690. [ Links ]
7. UCLA Advanced Research Computing. Logistic regression with Stata chapter 1: introduction to logistic regression with Stata. Available from: https://stats.oarc.ucla.edu/stata/webbooks/logistic/chapter1/logistic-regression-with-statachapter-1-introduction-to-logistic-regression-with-stata/. Accessed 14 February 2022. [ Links ]
8. Uanhoro JO, Wang Y, O'Connel AA. Problems with using odds ratios as effect sizes in binary logistic regression and alternative approaches. J Exp Educ. 2021;89(4):670-89. [ Links ]
9. Schober P, Vetter TR. Count data in medical research: Poisson regression and negative binomial regression. Anesth Analg. 2021;132(5):1378-79. https://doi.org/10.1213/ane.0000000000005398. [ Links ]
10. Brnabic A, Hess LM. Systematic literature review of machine learning methods used in the analysis of real-world data for patient-provider decision making. BMC Med Inform Decis Mak. 2021;21(1):54. https://doi.org/10.1186/s12911-021-01403-2. [ Links ]
11. Scheer JK, Smith JS, Schwab F, et al. Development of a preoperative predictive model for major complications following adult spinal deformity surgery. J Neurosurg Spine. 2017;26(6):736-43. https://doi.org/10.3171/2016.10.spine16197. [ Links ]
12. Azimi P, Mohammadi HR, Benzel EC, et al. Use of artificial neural networks to decision making in patients with lumbar spinal canal stenosis. J Neurosurg Sci. 2017;61(6):603-601. https://doi.org/10.23736/s0390-5616.16.03078-2. [ Links ]
* Corresponding author: lcmarais@saoj.co.za

