


Services on Demand
Article
 English (pdf)
 Article in xml format
 Article references
Indicators

Related links
-
 Cited by Google
 -
 Similars in Google
Share

 Permalink
SA Orthopaedic Journal
On-line version ISSN 2309-8309
Print version ISSN 1681-150X
SA orthop. j. vol.17 n.1 Centurion Feb./Mar. 2018
http://dx.doi.org/10.17159/2309-8309/2018/v17n1a7
UPPER LIMB
Range of movement, power and pinch grip strength post flexor tendon repair
Spark TI; Godlwana LII; Ntsiea MVII
IBSc, MSc student; Department of Physiotherapy, Faculty of Health Sciences, University of the Witwatersrand
IIPhD, Senior lecturer; Department of Physiotherapy, Faculty of Health Sciences, University of the Witwatersrand
ABSTRACT
BACKGROUND: Flexor tendon injuries (FTI) are common hand injuries that pose a challenge to the multi-disciplinary team. Despite being the most researched topic in hand literature, the optimal surgical and post-operative treatment of FTI remains unclear and results after flexor tendon repair (FTR) continue to be unpredictable.
PURPOSE: The purpose of this study was to determine the range of movement (ROM), power and pinch grip strength post FTR and to establish factors that may affect these.
METHOD: The study was conducted at an academic hospital in Gauteng, South Africa, between January 2013 and September 2015. At one, three and six months post FTR, the ROM of the injured and contralateral finger(s) were measured. At three and six months post FTR the participants' bilateral power and pinch grip strength were also measured.
RESULTS: One hundred and twenty-six participants (n=126) enrolled in the study. There was a drop-out rate of 48%, leaving 65 participants that completed six months' follow-up: 41 males (63%) and 24 females (37%) with mean age of 32 years (SD±10, n=65). Out of 65 participants, 2% (n=1) had an excellent outcome, 32% (n=21) a good outcome, 32% (n=21) a fair outcome and 34% (n=22) a poor outcome with regard to ROM. At six months post FTR the average power grip was 60% (SD±25, n=65) of the unaffected hand, while the average pinch grip was 52% (SD±42, n=65) of the unaffected hand. Sixty-eight per cent (n=44) of patients had post-operative complications: the most common complication was tenodesis/ adhesions (25%, n=16), followed by contracture (22%, n=14). Four patients (6%) had ruptures and 11 (17%) underwent further surgery. Factors that had a positive effect on outcome at six months post FTR were: younger age, no associated injury, less duration between injury and surgery, having controlled active motion instead of passive motion occupational therapy protocol, and not having a language barrier. Injury in zone IV was associated with worse ROM and power grip strength than other zones.
CONCLUSION: Although there were some promising outcomes, during this period participants did not consistently achieve the good or excellent outcomes that are achieved in some developed countries.
Level of evidence: Level 4.
Key words: flexor tendon repair, range of movement, pinch grip strength, South Africa
Introduction
Flexor tendon injuries (FTI) are common hand injuries that pose a challenge to the multi-disciplinary team.1 Despite this, the optimal surgical and post-operative treatment of FTI remains unclear and results after flexor tendon repair (FTR) continue to be unpredictable.2
There are several differences in post-surgical outcomes between developed and developing countries. In developing countries, outcomes may be influenced by: a lack of resources (both of the healthcare facilities and of the patients that utilise the services),3,4 a higher post-operative infection rate,5 language barriers,6 and lower education levels.7 Other factors that are reported to influence outcome post FTR include age, smoking, mechanism of injury, zone and extent of injury, time lapsed from injury to surgery, surgical technique, post-operative rehabilitation and adherence to therapy.1,4 Although much research has been done in developed countries minimal research has been done in developing countries. Thus, post-operative functional outcomes between developing and developed countries may not be the same.
The International Classification of Functioning, Disability and Health (ICF) provides a framework for the description of health conditions in terms of body functions and structure, activities and participation, as well as personal and environmental factors. Outcome post FTR is most frequently determined by measuring the impairments in body structure and functions, such as range of motion (ROM) and strength of the affected hand. Thus, the aim of this study was to determine ROM, power and pinch grip strength post FTR and factors that may influence these.
Method
Study design and participants
A longitudinal observational study was done at an academic hospital in Johannesburg, South Africa, from January 2013 to September 2015. Persons with an FTI in any zone, in any finger, with any associated neurovascular and/or bony injury, and who were over the age of 14 years were included. Persons with a previous injury to the affected or unaffected hand with residual ROM and/or strength deficit were excluded. This was part of a bigger study to establish functional outcomes after FTR of the hand.
Sampling
A sample of n=126 was recruited following considerations that there are 11 factors affecting FTR outcomes (age, language barriers, smoking, mechanism of injury, zone of injury, extent of injury, including number of digits injured and associated injury, time lapsed from injury to surgery, surgical technique, post-operative rehabilitation protocol and adherence to therapy1,4 and each factor was assigned ten participants (total of 110 participants). A loss to follow-up of 15% (16 participants) was anticipated, resulting in n=126.
Instrumentation and outcome measures
ROM was measured with a universal metal finger goniometer. Conventional goniometry was used as it was found to be comparable with computer-aided goniometry and motion analysis.9 Any change in ROM by >5° was considered clinically meaningful.10 Grip strength was measured with a Jamar dynamometer, in the position described by the American Society of Hand Therapists (elbow flexed 90°, forearm in neutral and patient gripping the dynamometer at the second handle position). The minimal detectable change (MDC) has not been established; however, there are readily available age- and sex-specific norms.11 Pinch strength was measured using a pinch meter.
The pinch meter measures thumb-finger prehension in pounds and/or kilograms and norms are available.12
Procedure
During the study period, theatre lists were obtained from the hospital hands unit and patients due for FTR were identified. Post surgically all participants received occupational therapy (OT) for four weeks. The OT protocols used were the passive motion or controlled active motion or early active motion protocols. After four weeks patients were invited to participate in the study by the researcher as they attended their first physiotherapy appointment. They continued to receive the usual OT and physiotherapy as necessary. At invitation (baseline, four weeks post-operatively) a data collection form that covered details about demographics, injury, surgery, rehabilitation and post-operative complications was completed by those who gave consent. The aspects of rehabilitation and post-operative complications were gathered at the three and six-month follow-up period where necessary.
At baseline, bilateral hand ROM was measured. For measurement of the finger joints the participant's wrist was in neutral, and the participant was asked to form a composite fist to measure flexion ROM (i.e. joints were not measured in isolation). The participant was then asked to open their hand as much as possible in order to measure extension ROM. For the thumb flexion and extension ROM measurement the participant was asked to flex and extend their thumb as fully as possible (with wrist in neutral). ROM of the affected hand was measured in an identical manner at three and six months post-surgery. At three and six months post-surgery the participant's bilateral grip strength and pinch strength were measured. Three measurements were taken for both affected and unaffected hands and an average of the three readings was calculated.
Data analysis
The Total Active Movement (TAM) classification system, as described by the American Society for Surgery of the Hand (ASSH),13 was applied to the ROM measurements. TAM was calculated by subtracting the sum of the extension deficit present at each joint (metacarpal-phalangeal joint [MCPJ], proximal interphalangeal joint [PIPJ] and distal interphalangeal joint [DIPJ]) from the sum of the degrees of flexion at each joint: TAM = total active flexion (MCPJ, PIPJ, DIPJ) - total extension deficit (MCPJ, PIPJ, DIPJ).13 The average TAM for the affected hand was then calculated and classified according to the following: 100% -Excellent, >75% - Good, >50% - Fair, <50% - Poor.
For power and pinch grip strength, three measurements were taken bilaterally, and the average of the affected hand was then divided by the average of the unaffected hand to determine the percentage of unaffected grip strength. Descriptive statistics were used to analyse demographic information, ROM, pinch and grip strength. Friedman's test was used to compare median scores of ROM over the study period, and the Wilcoxon Signed Rank test was used to compare median scores of grip and pinch strength over the study period. Pearson's correlation was used for ROM and power grip, while Spearman's correlation was used for pinch grip, due to the skewness of its distribution. To test association, t-test, one-way ANOVA and Kruskal-Wallis tests were used. The predictor variables were: age category, smoking history, mechanism of injury (sharp or tearing), zone of injury, number of digits injured, associated injury, number of weeks between injury and surgery, suture technique, OT protocol, adherence to therapy and presence of language barrier. Bonferroni test was used to determine, when there are differences between the groups. Regression analysis was done for variables which were statistically significant from univariate analysis. Stata statistical software (version 14) was used for statistical analysis. Significance was set at p < 0.05.
Results
Participants
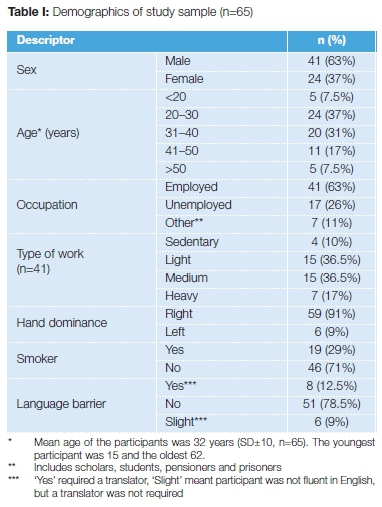
Of the 126 participants (n=126) enrolled in the study, 75% (n=94) and 56% (n=72) completed their three- and six-month assessments, respectively. Seven participants who attended their six-month follow-up had missed their three-month follow-up, leaving 51.5% (n=65) participants (141 fingers) with complete data and eligible for analysis; thus results have been presented using n=65. The demographics of the study sample are summarised in Table I. Most of the participants were male (63%) and between the ages of 20 and 30 years (37%). Sixty-three per cent (n=41) of the participants were employed, 91% of the sample was right hand dominant and 78.5% could understand and speak English fluently.
Characteristics of injuries
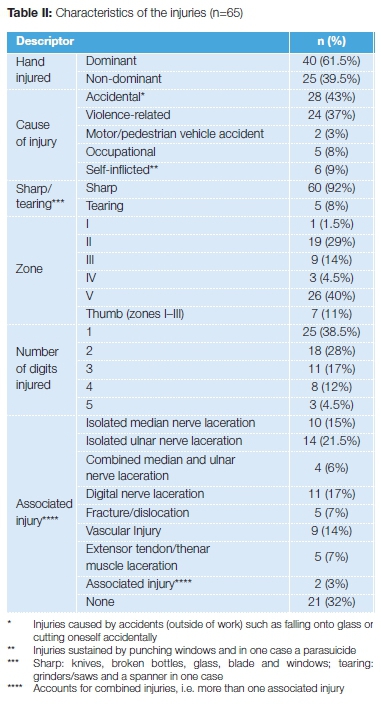
Characteristics of injuries sustained by participants are summarised in Table II. Most (61.5%) participants injured their dominant hand and the most commonly injured zone was zone V (40%). Most participants only injured a single digit (38.5%). The most common associated injury was ulnar nerve (21.5%).
Details of the surgery and complications post surgery
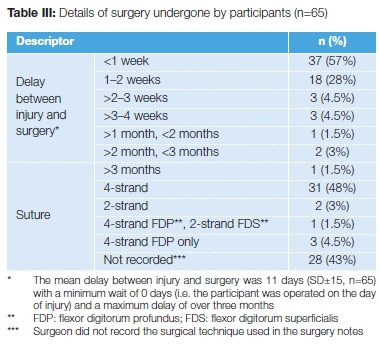
Details of the surgery undergone by participants are summarised in Table III. There was a mean delay of 11 days (SD±15, n=65) between injury and surgery, with most of the participants (57%) undergoing FTR within a week of sustaining their FTI. Almost half of the patients (48%) had four-strand repair. There was a high rate (43%) at which the surgeon did not specify in the surgery notes which suture was used.
Sixty-eight per cent of participants (n=44) experienced one or more complications post FTR. The most common complication was tenodesis/adhesions (25%, n=16), followed by contracture (22%, n=14) and infection (9%, n=6). Eleven participants (17%) underwent further surgery. The further surgeries included: three debridements, three tenolysis, one contracture release, three secondary tendon repairs and one Riordan tendon transfer.
ROM, power and grip strength
The ROM of participants at one, three and six months post FTR, in terms of TAM, showed an improvement in median TAM of 36% from one to three months (p<0.001), and 8% from three to six months (p<0.001). At one month post FTR, the majority (94%, n=61) of participants had ROM classified as poor. At three months post FTR the ROM classification was divided almost equally between fair (45%, n=29) and poor (43%, n=28). At six months post FTR the participants' ROM was split almost equally into thirds of good and excellent (34%, n=22), fair (32%, n=21) and poor (34%, n=22) results. The power grip strength improved by 21% (p<0.001) and pinch grip strength by 25% (p<0.001) from three to six months.
Factors that affect ROM, power and grip strength six months post FTR
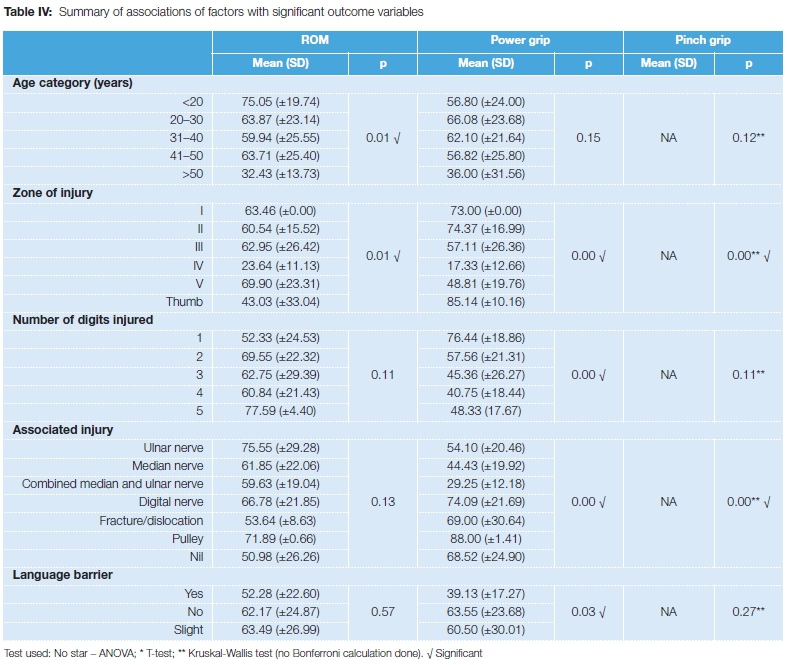
Power grip, ROM, and pinch grip were all positively correlated; therefore, as ROM improves, strength improves and vice versa. After testing for correlation, tests for association were done. The summary is presented in Table IV. ROM at six months was significantly associated with age and zone of injury. Participants aged 50 years and older or who had an injury in zone IV of their hand were more likely to have decreased ROM when compared to other age categories and zones. Power grip was significantly associated with zone of injury, number of digits injured, associated injury and presence of a language barrier. Participants who had an injury in zone IV, a combined median and ulnar nerve injury or were unable to speak English were more likely to have decreased power grip, while those with injury to the thumb or a single digit injury were more likely to have increased power grip. Pinch grip was significantly associated with zone of injury and associated injury.
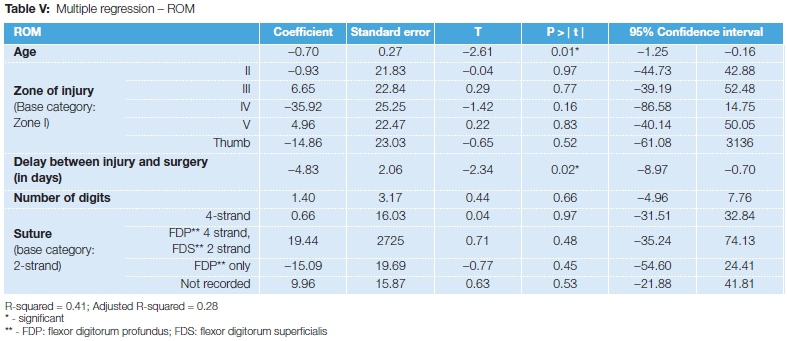
The factors found to be significantly correlated to and/or associated with each outcome variable were used in the multiple linear regression and are summarised in Table V. For each year decrease in age there was a 0.7° increase in ROM (p=0.01).
For every day earlier that the participant was operated on post-injury there was a 4.83° increase in ROM (p=0.02).
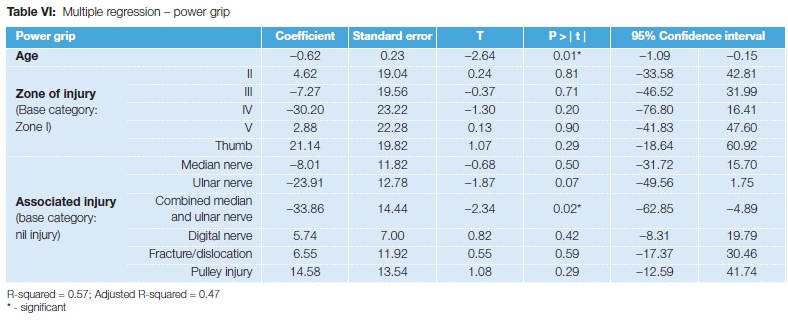
Table VI shows that for each year decrease in age there was a 0.62kg increase in power grip (p=0.01). A participant with a combined median and ulnar nerve injury was 34 times more likely to have decreased power grip strength when compared to those with no associated injury (p=0.02).
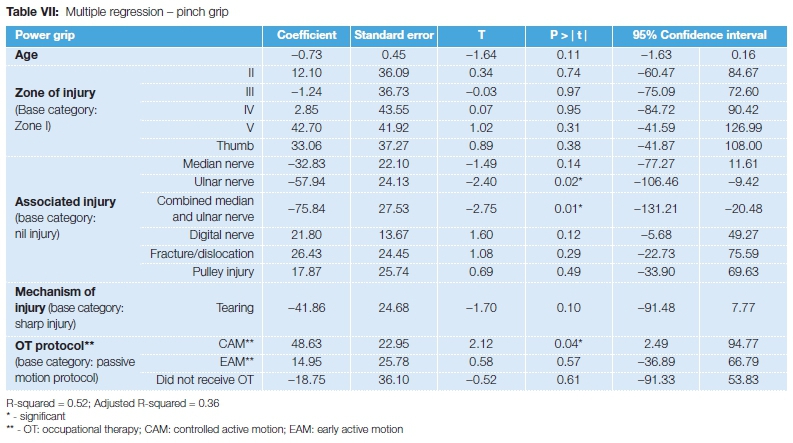
Table VII indicates that participants with an ulnar nerve injury or with combined median and ulnar nerve injury were 58 times (p=0.02) and 76 times (p=0.01) more likely to have decreased pinch grip strength respectively. Participants who were treated using a controlled active motion (CAM) protocol were 49 times more likely to have increased pinch grip strength when compared to those treated with a passive motion protocol (p=0.04).
Discussion
The majority of the participants were male and between the ages of 20 and 30 years, both of which are similar to previous research14 and in keeping with the global trend of young males experiencing high rates of injury when compared with other age and gender groups.15,16 This is due to the increased level of risk-taking behaviours,15,16 increased exposure to occupations or activities where they may sustain injury, and increased alcohol consumption when compared to women.16
Almost two-thirds of the participants were employed (63%) and 26% were unemployed, which is similar to South Africa's unemployment rate of 25%.17 It is difficult to compare these figures with other flexor tendon research as employment is rarely considered in the assessment of outcomes post FTR.
Twenty-nine per cent of the participants were smokers. This is the same percentage as Trumble et al.'s study,18 and a lot higher than the estimated smoking prevalence in South Africa of 17.6%.19 This may be due to the fact that participants were mostly males, who are significantly more likely to use tobacco than females.19
The most commonly injured zone was zone V (40%). Studies by De Jong et al.14and Hung et al.20found that zone II was the commonly injured flexor tendon zone, injured in 19.1 % and 52% of cases respectively. These studies found that zone V was injured in 6.7% and 17% of cases, which is much lower than that of this study. Often FTR research does not include injuries in zone V due to the higher likelihood of an associated peripheral nerve injury, which is often an exclusion criterion.21 The lack of associated nerve injury as part of the exclusion criteria in this study may account for the higher representation of zone V injuries in this sample. It is also more difficult to find information in the literature regarding incidence of injury in zones other than zone II, which is the zone most FTR research focuses on.22 The fact that the current study did not exclude zone V injuries is a strength of the study, as it aids in broadening the literature regarding zone V injuries, especially when considering factors that influence functional outcome post injury.
Nerve lacerations were the most commonly associated injury in this study and vascular injury was the most common secondary associated injury. Trumble et al.18had a 36% incidence of digital nerve injuries in their sample and Hung et al.20had a 67% incidence. These higher numbers are to be expected as both studies focused on zone II FTI, where injury to digital nerves occurs. The higher incidence of associated peripheral nerve injuries than other associated injuries in this study is more than likely due to the high number of zone V injuries sustained by this sample. However, the figures from this study are not as high as those found by Al-Shanawany et al.23 where there was involvement of the median nerve in 25% of cases, the ulnar nerve in 30% of cases and combined median and ulnar nerve injury in 45% (only 6% in this study). Most FTR studies over the years24-26 have excluded patients with associated injuries, making it difficult to compare this research with other flexor tendon research.
With regard to the time elapsed between injury and surgery, there was a mean delay of 11 days (SD±15, n=65), with most of the participants (57%) undergoing FTR within a week of sustaining their FTI. This compares favourably with Braga-Silva and Kuyven's study27 in Brazil where all of the participants had surgery between days 7 and 21 post injury. This was due to difficulties with access to specialist hand surgery, which is a factor in the South African healthcare system too. In the developed countries of England,25 Japan26 and Iran,28 in specialised hand centres, the majority of patients underwent surgery much sooner: all patients in the study by Caulfield et al.25had surgery on day 2 post injury.
Both Tang29 and Dy and Daluiski30 state that there is no solid evidence regarding the best time to perform tendon repair. Tang27 refers to McFarlane et al.'s study31 that stated that direct repair may be possible up to several months post injury, depending on the amount of tendon retraction that has occurred. This is confirmed by the Ave patients in this study who had a primary FTR performed despite delays of over one month post injury.
Almost half of the patients (48%) had four-strand repair. This is in keeping with the move away from the conventional two-strand method toward the most widely accepted four-strand technique.32 There are no present-day studies that would accept less than a four-strand repair into their sample due to the move towards more aggressive, earlier active mobilisation, which requires the strength of more than a two-strand repair.18,26,33
A high number (68%) of participants experienced complications post FTR. This is much higher than the rate quoted by Dy et al.34of 4% rupture and 4% adhesions. The rupture rate of 6% is equivalent with the rate of 4-6% consistently quoted in the literature;32 however, the adhesion rate of 25% is much higher than that found in other literature.8 The higher adhesion rate is likely due to the passive motion protocol currently used at the hospital where this research was conducted, owing to the fact that in passive motion protocols there is a higher risk of decreased ROM and adhesions.34-36 There was a significant improvement in ROM from one to three months and from three to six months. With rehabilitation, post-FTR ROM seems to improve for the first six months, as is shown in this sample, and only reaches a plateau at around one year post repair.
The median power and pinch grip percentages of the unaffected hand were 41% and 29% at three months and 62% and 54% at six months respectively. There was a significant improvement in strength for power grip and pinch grip from three to six months. Like ROM, grip strength also improves for the first six months and reaches a steady state at one year post FTR, as described by May and Sifverskiold,37 and Libberecht et al.13
For power grip strength, Kitis et al.'s findings38 were a mean of 85% of the unaffected hand at 12 weeks post FTR, much higher than this sample at six months post FTR, but their study only looked at zone II injuries, where median or ulnar nerve injuries were not a factor that could affect the grip strength. Bal et al.39found a mean of 62% (71% in zone II and 53% in zone V) of the unaffected hand with a median follow-up period of 72 weeks, an identical result to this study, and they included patients with peripheral nerve injury.
There was a variation in strength according to hand dominance, with the right hand dominant participants averaging 18% higher in power grip and 11% higher in pinch grip than the left hand dominant participants at six months post FTR.
When one considers the 10% rule (where strength of the dominant hand is 10% more than that of the non-dominant hand, especially for right-hand dominant people), this variation is lessened.13
In this study, increasing age leads to decreasing ROM and power grip strength. In particular, participants aged 50 years and over were more likely to have decreased ROM when compared to other age groups. These findings are similar to those of Freuh et al.33 who found that older age is associated with decreased ROM post FTR. This is explained by the deterioration of tendon quality with advancing age,40 which makes tendon repairs more prone to poor outcomes.
Associated injury was found to affect both the power and pinch grip strength at six months post FTR, a similar finding to other studies which established that in the presence of an associated bony or neurovascular injury results are poorer.18,34,41 A combined median and ulnar nerve injury was the associated injury to cause the greatest loss of power and pinch grip strength, while ulnar nerve injury also resulted in decreased pinch grip strength. This makes sense as the median and ulnar nerves innervate all the flexors in the forearm and hand, so aceration of both nerves would greatly affect grip strength in the hand. Another reason associated injury could affect the outcome of grip strength is that more severe injuries, involving multiple structures, could require a period of immobilisation before active rehabilitation can commence.33 This delay in active mobilisation could lead to development of adhesions and stiffness which may be difficult to overcome once active ROM starts.
The delay between injury and surgery had a significant effect on ROM. This makes sense in that the sooner the patient is operated on the better the outcomes. Torrie et al.32found that outcomes were improved if patients underwent surgery within seven days of sustaining an FTI.
The final factor that was found to affect the outcome post FTR is the presence of a language barrier. A possible reason why language barrier affects the outcome is if the participants are able to communicate effectively with the health professionals treating them they should be able to understand the strict instructions and the importance of rehabilitation post FTR. If the participant understands both of these they would be less likely to unintentionally be non-adherent32 with splint wear and the home exercise programme, and possibly more likely to attend therapy sessions, all of which are important to the functional outcome post FTR.
Conclusion
The factors found to significantly affect the ROM, power and pinch strength at six months post FTR are: age, zone of injury, associated injury, delay between injury and surgery, OT protocol used and language barrier.
Limitations
The primary limitation of this study is the small size of the sample and high dropout rate, both of which affect the reliability of the analyses and make it difficult to generalise the results. However, a maximum of six factors were found to be significantly correlated to and/or associated with each outcome variable and only these factors were used in the multiple linear regression analysis making up for the minimum of ten participants per factor.
Clinical message
• Controlled active motion is more beneficial than passive motion post FTR.
• Early FTR post-injury results in better ROM.
• Accurate surgery notes are needed for therapists to adhere to
the necessary precautions/contraindications. A translator is needed when there is a language barrier for patients to understanding their condition and precautions.
Compliance with ethics guidelines
Permission to conduct research was obtained from the hospital, ethical clearance granted by the University of the Witwatersrand Human Research Ethics Committee (M130748), and all participants gave informed consent.
References
1. Saini N, Kundani V, Patni P & Gupta S. Outcome of early active mobilization after flexor tendons repair in zones II-V in hand. Indian Journal of Orthopaedics 2010;314-21. [ Links ]
2. Kotwal PP & Ansari M. T. Zone 2 flexor tendon injuries: Venturing into the no man's land. Indian Journal of Orthopaedics 2012;608-15. [ Links ]
3. Schaub TA & Chung KC. Systems of provision and delivery of hand care, and its impact on the community. Injury 2006 37:1066-70. [ Links ]
4. Tang JB. Tendon injuries across the world. Injury 2006;37:1036-42. [ Links ]
5. Allegranzi B & Pittet D. Healthcare-associated infections in developing countries: Simple solutions to meet complex challenges. Infection Control and Hospital Epidemiology 2007;28(12):1323-27. [ Links ]
6. Schlemmer A & Mash B. The effects of a language barrier in a South African district hospital. South African Medical Journal 2006;96(10):1084-87. [ Links ]
7. Chung KC, Kotsis SV & Kim M. Predictors of functional outcomes after surgical treatment of distal radius fractures. The Journal of Hand Surgery 2007;2A (1):76-83. [ Links ]
8. Tang JB. Clinical outcomes associated with flexor tendon repair. Hand Clinics 2005;21:199-210. [ Links ]
9. Georgeu GA, Mayfield S & Logan AM. Lateral digital photography with computer aided goniometry versus standard goniometry for recording joint finger angles. Journal of Hand Surgery (British and European Volume) 2002;27B(2):184-86. [ Links ]
10. Macionis V. Reliability of the standard goniometry and diagrammatic recording of finger joint angles: A comparative study with healthy subjects and non-professional raters. BioMed Central Musculoskeletal Disorders 2013;14:17. [ Links ]
11. Lamb M. Rehab measures: hand-held dynamometer/grip strength 2014. Retrieved October 15, 2015, from Rehab Measures: http://www.rehabmeasures.org/Lists/RehabMeasures/DispForm.aspx?ID=1185 [ Links ]
12. Mathiowetz V, Kashman N, Volland G, Weber K, Dowe M & Rogers S. Grip and pinch strength: Normative data for adults. Archives of Physical Medicine and Rehabilitation 1985;66(2):69-74. [ Links ]
13. Libberecht K, Lafaire C, & Van Hee R. Evaluation and functional assessment of flexor tendon repair in the hand. Acta Chirurgica Belgica 2006;106:560-65. [ Links ]
14. De Jong JP, Nguyen JT, Sonnema AJ, Nguyen EC, Amadio PC & Moran SL. The incidence of acute traumatic tendon injuries in the hand and wrist: A 10-year population-based study. Clinics in Orthopedic Surgery 2014;6(2):196-202. [ Links ]
15. Kent MM & Young US. Adults vulnerable to injuries and violence 2010. Retrieved October 13, 2015, from Population Reference Bureau: http://www.prb.org/Publications/Articles/2010/usyoungadult-injury.aspx [ Links ]
16. Sorenson SB. Gender disparities in injury mortality: Consistent, persistent and larger than you'd think. American Journal of Public Health 2011;101(S1):353-58. [ Links ]
17. StatsSA. Quarterly Labour Force Survey 2015. Pretoria: Statistics South Africa. [ Links ]
18. Trumble TE, Vedder NB, Seiler JG, Hanel DP, Diao E & Pettrone S. Zone-II flexor tendon repair: A randomized prospective trial of active place-and-hold therapy compared with passive motion therapy. The Journal of Bone and Joint Surgery 2010;92:1381 -89. [ Links ]
19. Reddy P, Zuma K, Shisana O, Jonas K & Sewpaul R. Prevalence of tobacco use among adults in South Africa: results from the first South African national health and nutrition examination survey. South African Medical Journal 2015;105(8):648-55. [ Links ]
20. Hung LK, Yeung PL, Wong JM, Pang KW, Cheung L & Chan P. Active mobilisation after flexor tendon repair: comparison of results following injuries in zone 2 and other zones. Journal of Orthopaedic Surgery 2005;13(2):158-63. [ Links ]
21. Chesney A, Chauhan A, Kattan A, Farrokhyar F & Thoma A. Systematic review of flexor tendon rehabilitation protocols in zone II of the hand. Plastic and Reconstructive Surgery 2011;127(4): 1583-92. [ Links ]
22. Howell JW & Peck F. Rehabilitation of flexor and extensor tendon injuries in the hand: Current updates. Injury 2013;44:397-402. [ Links ]
23. Al-Shanawany S, Korayyem HK, Saad MM, Desouki S & Ghozlan N. Functional outcome and medicolegal implications of flexor tendon injuries at the wrist. Egyptian Rheumatology and Rehabilitation 2003;30(2):255-72. [ Links ]
24. Tottenham VM, Wilton-Bennett K & Jeffery J. Effects of delayed therapeutic intervention following zone II flexor tendon repair. Journal of Hand Therapy 1995;8:23-26. [ Links ]
25. Caulfield RH, Maleki-Tabrizi A, Patel H, Coldham F, Mee S & Nanchahal J. Comparison of zones 1 to 4 flexor tendon repairs using absorbable and unabsorbable four-strand core sutures. The Journal of Hand Surgery (European Volume) 2008;33E (4):412-17. [ Links ]
26. Moriya K, Yoshizu T, Maki Y, Tsubokawa N, Narisawa H & Endo N. Clinical outcomes of early active mobilization following flexor tendon repair using the six-strand technique: short- and long-term evaluations. The Journal of Hand Surgery (European Volume) 2015;40E(3):250-58. [ Links ]
27. Braga-Silva J & Kuyven C. R. Early active mobilization after flexor tendon repairs in zone two. Chriugie de la main 2005;24:165-68. [ Links ]
28. Farzad M, Layeghi F, Asgari A, Ring DC, Karimlou M & Hosseini SA. A prospective randomized controlled trial of controlled passive mobilization vs. place and active hold exercises after zone 2 flexor tendon repair. Hand Surgery 2014;19(1):1-7. [ Links ]
29. Tang JB. Indications, methods, postoperative motion and outcome evaluation of primary flexor tendon repairs in zone 2. Journal of Hand Surgery (European Volume) 2007;32E(2):118-29. [ Links ]
30. Dy CJ & Daluiski A. Update on zone II flexor tendon injuries. Journal of the American Academy of Orthopaedic Surgeons 2014;22:791 -99. [ Links ]
31. McFarlane R M, Lamon R & Jarvis G. Flexor tendon injuries within the finger. A study of the results of tendon suture and tendon graft. Journal of Trauma 1968;8(6):987H1000. [ Links ]
32. Torrie P. A, Atwal N, Sheriff D & Cowey A. Flexor tendon injuries. Orthopaedics and Trauma 2010;24(3):217-22. [ Links ]
33. Freuh FS, Kunz VS, Gravestock IJ, Held L, Haefeli M & Giovanoli P. Primary flexor tendon repair in zones 1 and 2: Early passive mobilization versus controlled active motion. Journal of Hand Surgery 2014;39(7):1344-50. [ Links ]
34. Dy CJ, Hernandez-Soria A, Ma Y, Roberts TR & Daluiski A. Complications after flexor tendon repair: A systematic review and meta-analysis. Journal of Hand Surgery 2012;37A:543-51. [ Links ]
35. Starr HM, Snoddy M, Hammond KE & Seiler JG. Flexor tendon rehabilitation protocols: A systematic review. Journal of Hand Surgery 2013;38A:1712-17. [ Links ]
36. Lutsky KG, Giang EL & Matzon JL. Flexor tendon injury, repair and rehabilitation. Orthopedic Clinics of North America 2015;46:67-76. [ Links ]
37. May EJ & Silfverskiold KL. Rate of recovery after flexor tendon repair in zone II. A prospective longitudinal study of 145 digits. Scandinavian Journal of Plastic and Reconstructive Surgery and Hand Surgery 1993;18(3):411-18. [ Links ]
38. Kitis A, Buker N & Kara IG. Comparison of two methods of controlled mobilisation of repaired flexor tendons in zone 2. Scandinavian Journal of Plastic and Reconstructive Surgery and Hand Surgery 2009;43(3):160-65. [ Links ]
39. Bal S, Oz B, Gurgan A, Memis A, Demirdover C & Sahin B. Anatomic and functional improvements achieved by rehaibilitation in zone II and zone V flexor tendon injuries. American Journal of Physical Medicine and Rehabilitation 2011 ;90(1):17-24. [ Links ]
40. Goodman HJ & Choueka J. Biomechanics of the flexor tendons. Hand Clinics 2005;21:129-49. [ Links ]
41. Starnes T, Saunders RJ & Means KR. Clinical outcomes of zone II flexor tendon repair depending on mechanism of injury. Journal of Hand Surgery 2012;37A:2532-40. [ Links ]
 Correspondence:
Dr Veronica Ntsiea
Physiotherapy Department, Faculty of Health Sciences, University of the Witwatersrand
7 York Road, Parktown, 2193
cell: +27 83 2972146; tel: +27 11 717 3702
fax: +27 86 5534762
email: Veronica.Ntsiea@wits.ac.za
Received: August 2016
Accepted: January 2017
Published: March 2018
Editor: Prof Anton Schepers, University of the Witwatersrand
Funding: None
Conflict of interest: The authors declare that there is no conflict of interest.

