


Servicios Personalizados
Articulo
 Inglés (pdf)
 Articulo en XML
 Referencias del artículo
Indicadores

Links relacionados
-
 Citado por Google
 -
 Similares en Google
Compartir

 Permalink
SA Orthopaedic Journal
versión On-line ISSN 2309-8309
versión impresa ISSN 1681-150X
SA orthop. j. vol.15 no.4 Centurion oct./nov. 2016
http://dx.doi.org/10.17159/2309-8309/2016/v15n4a3
GENERAL
Orthopaedic research activity in South Africa measured by publication rates in the 15 highest impact journals related to population size and gross domestic product
Prof E HohmannI; Dr V GlattII; Prof K TetsworthIII
IMBBS, FRCS, FRCS (Tr&Orth), MD, PhD, Medical School, University of Queensland, Australia
IIPhD, Institute of Health and Biomedical Innovation, Queensland University of Technology, Brisbane, Queensland, Australia
IIIMD, FRACS, Department of Orthopaedic Surgery, Royal Brisbane Hospital, Herston, Queensland, Australia. Department of Surgery, School of Medicine, University of Queensland, Australia Queensland University of Technology Orthopaedic Research Centre of Australia
ABSTRACT
BACKGROUND: The purpose of this study was to investigate the number of publications and impact of South African surgeons in the 15 highest impact orthopaedic journals over a five-year period.
METHODS: The abstracts between January 2010 and December 2014 were screened and the total number of publications and impact points were collated. Normalisation to population size, GDP and per capita GDP was performed.
RESULTS: Of the 23 021 orthopaedic articles from 66 countries, South Africa published 19 articles and ranked 41st overall for the number of publications and 40th for impact. When compared to the other African countries it ranked 2nd. The following ranks were calculated for adjusting population (51st overall, 2nd in Africa), GDP (51st overall, 3rd in Africa), GDP per capita (31st overall, 3rd in Africa).
CONCLUSION: This study demonstrated that South Africa ranked in the lower third of all countries that published in the top 15 highest impact orthopaedic journals. In Africa, Egypt was the leading country for total publications and impact factor maintaining the first rank even when adjusted for population size, GDP, GDP per capita and research funding in percentage of GDP.
Key words: bibliometrics, orthopaedic surgery, impact factor, publication productivity
Introduction
Research is a major component of innovation and can contribute to health improvements through a knowledge-to-action-process.1 In general, the total number of publications by a country is one of the indicators of research output and productivity and is an important aspect of clinical excel-lence.2-4 While the developing world contains more than 75% of the world's population and has the largest burden of musculoskeletal disease, less than 10% of publications originate from these countries.1 Aluede et al. investigated the representation of developing countries in four high impact orthopaedic journals over a three-year period, and determined that less than 0.4% of all articles (n=15) were published by authors from Sub-Saharan Africa, with only six publications originating from South Africa.5
Yamey interviewed academic leaders from low and middle income countries about potential obstructions for health interventions and reported that limited human resources, lack of leadership, financial constraints and lack of political will are some of the perceived barriers.6 Similarly, Bouchard et al. demonstrated that poor leadership, high cost, poor healthcare structure, inadequate human resources and especially corruption are barriers to orthopaedic care and research.7 Shipley suggested that the lack of resources in public hospitals, administrative support, funding and motivation in South Africa are possible barriers despite an abundance of subjects addressing local and continental topics.8
Bibliometric analysis is commonly used as a proxy for research output and several authors have previously performed bibliometric analysis of orthopaedic publications.9-11 Only Ireland and Turkey have specifically investigated their country's individual contribution to orthopaedic literature with a focus on the institution, individual authors and distribution of publications among journals.12,13
However, the total number of publications may not account for economic discrepancies and population size.11 In addition, the availability of funding would certainly result in higher publication output by countries with a larger population size and more powerful economies in particular when considering the economic realities of low income and developing countries.11,14 To adjust for these inconsistencies the use of gross domestic product (GDP) and gross domestic product per capita may result in more meaningful results and allow for comparisons between countries.15
The purpose of this study was threefold: 1) to investigate the number of publications and impact of South African surgeons in the 15 highest impact orthopaedic journals over a five-year period and relate these variables to population size, GDP and GDP per capita; 2) to establish the number of publications required for South Africa to be equal with the country having the overall highest research output, to establish the number of publications required for South Africa to be comparable to the average; 3) and to compare South Africa's research output to other African countries.
Methods
The 2015 Journal Citation report was accessed on the Web of Science (Thomson Reuters, New York, USA).16 The 15 highest ranked journals based on the 2015 impact factor were selected from the category 'orthopedics'. Journals that were not directly related to the field of orthopaedic surgery or their main purpose was to provide narrative review articles were excluded from this list (Table I). Only research articles (level 1-4), systematic reviews, meta-analysis, non-solicited review articles and case reports were included. Letters to the editor, editorials, editorial comments, historical articles, errata, proceeding papers, meeting abstracts and notes were excluded.

The abstracts of these articles published between January 2010 and December 2014 were screened via the journals' websites. The level of evidence was recorded for each published article. If the journal did not assign the level of evidence, the 'levels of evidence' chart published by the Journal of Bone and Joint Surgery was used.17 Discrepancies were solved by agreement between the two senior authors. The country of origin was defined as the country of origin of the corresponding author if the manuscript did not provide details about study location.
GDP and GDP per capita were sourced from the World Bank website18 and population size was extracted from the CIA World Factbook.19 For the African countries that had published articles in the top 15 journals, more demographic information was collected: GDP composition as a percentage of GDP, health and education expenditure in percentage GDP, literacy rate, physicians and hospital beds per 1 000 population, the country's position rank on the corruption index and corruption perception index. These variables were used for qualitative analysis of research output on the African continent.
The total number of publications and the total number of impact points were collated. To adjust the number of publications for population size, the population size was divided by the total number of publications.
The resulting value reflected the population size per publication (PSPP); in other words, the calculated value described the population size per published article, which allowed for better comparison of research output between countries. Similarly, population size was divided by the total impact points (PSIP).
For further analysis, the GDP was divided by the total number of publications and impact points. The established values provided an overview of the gross cost of producing a manuscript (GDPP), respectively one impact point (GDPI) for each country. To adjust for population size and economic strength, the GDP per capita was divided by the total number of publications and impact points. The established values provided a more detailed overview of the gross cost per capita producing a manuscript (GDPPC), respectively one impact point (GDPIC) for each country
The country list for GDPPC was then ranked and the number of publications of the country ranked median was used to calculate the number of publications each country should achieve to be equivalent with the median. The following formula was used:
1. Per capita GDP (in USD)/number of publications = benchmark factor (of 'median' country)
2. Per capita GDP of each country/benchmark factor = required publications to be equal with median
There is no published evidence for this approach, yet the 'papers' to be published provide an excellent overview of the relative output and research strength between countries corrected for economic power (GDP/capita) and population size. Finally, the GDPPC was used to calculated the numbers of publications needed to become equal with the perceived current global leader in orthopaedic research, namely the United States.
Results
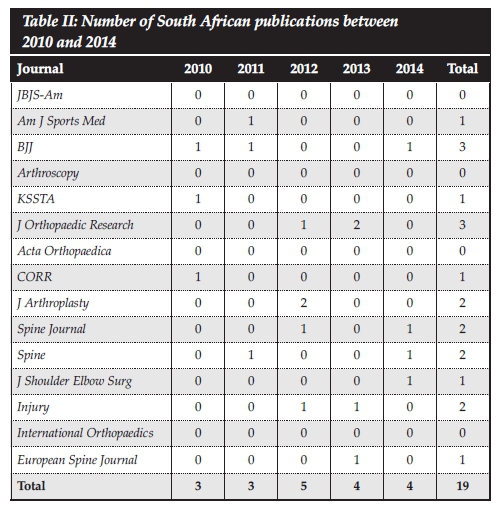
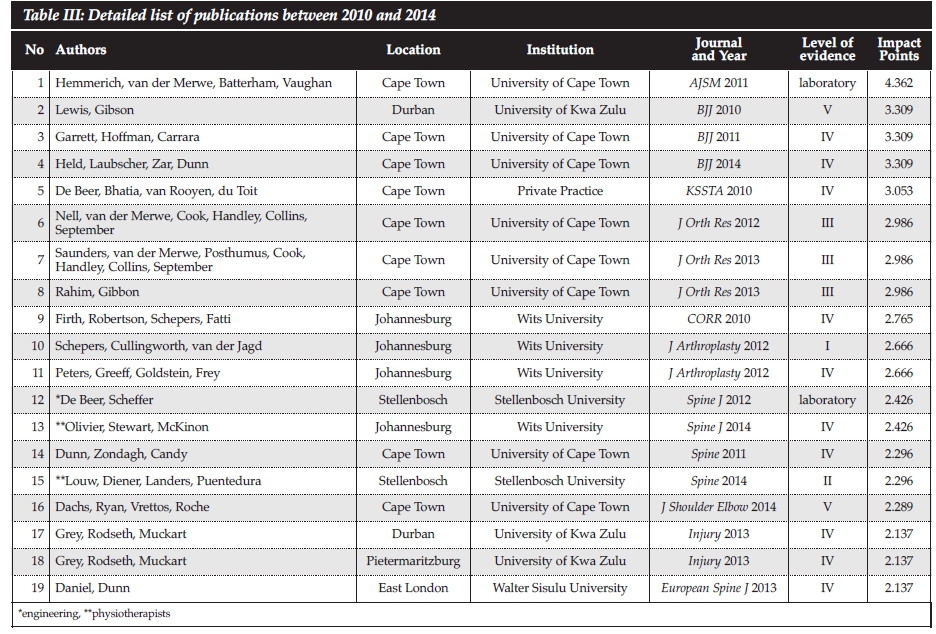
A total of 23 021 orthopaedic articles were published within the study period between January 2010 and December 2014 (Table I). Table II demonstrates the number of South Africa's publications within these journals. A total of 19 publications were recorded (Table III). Nine publications were published from Cape Town; eight of these were university-based and one was from a private practice. Four publications were from Johannesburg, two from Durban and Stellenbosch, and the remaining two from East London and Pietermaritzburg; all of these papers were university-based. Of the 19 publications, three studies were published by physiotherapists and engineers having no input from orthopaedic surgeons.
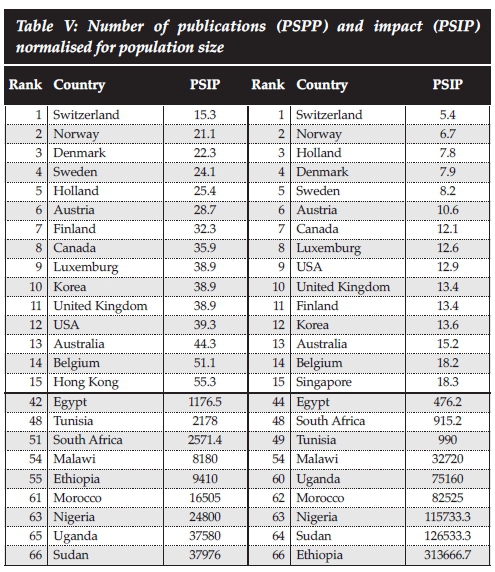
A total of 66 countries have published at least one article. The country ranked as 'medium' (Poland) published 61 articles. Table IV shows the top 15 countries with the United States being the leading country with a total of 8 149 publications and a total of 24 744 impact points. South Africa ranked 41st overall for the number of publications and 40th for impact. When compared to the other African countries it ranked 2nd, both for the number of publications and impact. When adjusting for population size, Switzerland was the leading country with one publication per 15.300 and one impact point for 5.400 (Table V). South Africa ranked 51st for the number of publications and 48th for impact. When compared to the other African countries it ranked 3rd for the number of publications and 2nd for impact.

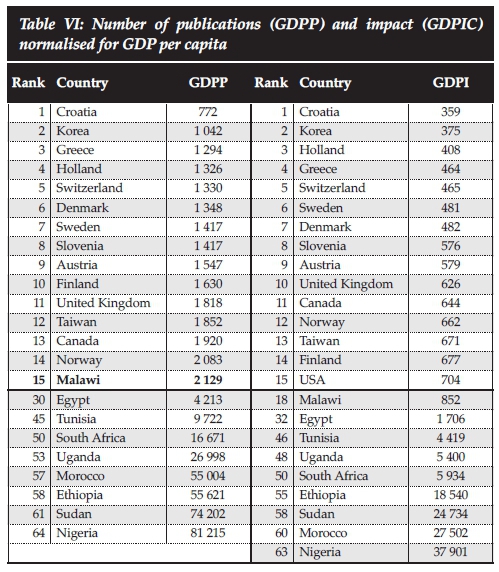
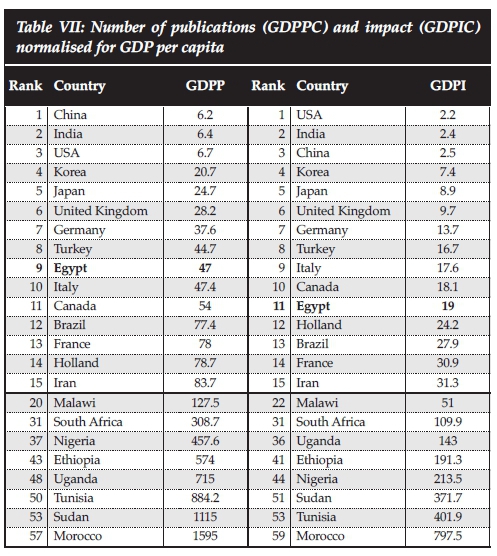
The number of publications and impact points related to GDP were highest for Croatia with one publication per 772.000 USD and producing one impact point per 359.000 USD (Table VI). South Africa ranked 50st for both the number of publications impact. When compared to the other African countries it ranked 4th for the number of publications and 5th for impact. When adjusting for GDP per capita, China produced one publication per 6.200 USD and for impact the USA produced one impact point per 2.200 USD (Table VII). South Africa ranked 31st for both the number of publications and for impact. When compared to the other African countries it ranked 3rd for the number of publications and for impact.
When using the median number (n=61) of publications per GDP/capita (GDPPC) calculated for all 66 countries which contributed with at least one publication in these top 15 journals over the study period, and calculating the 'required' number of publications to be equivalent with the median, 28 countries reached this benchmark figure (Table VIII). Interestingly, Egypt and Malawi published more papers than required and were the only African countries to meet the benchmark. South Africa ranked 31st. To meet the required benchmark, the number of publications was calculated to be n=28 but only 19 articles (68%) were published.

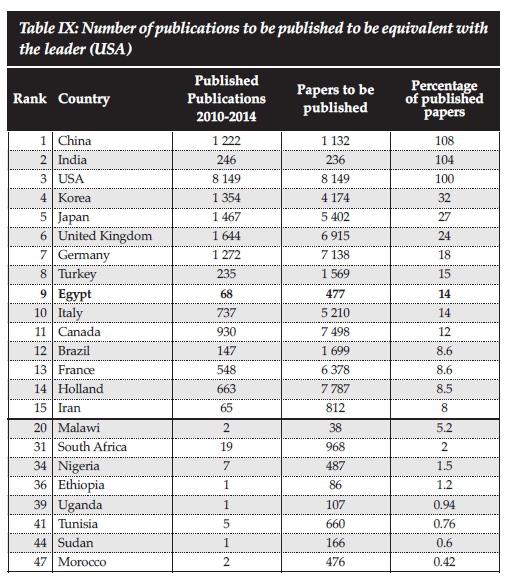
Using the GDPPC to calculate the required number of publications to be equivalent with the global research leader (USA), South Africa would have been required to publish 968 articles (Table IX).
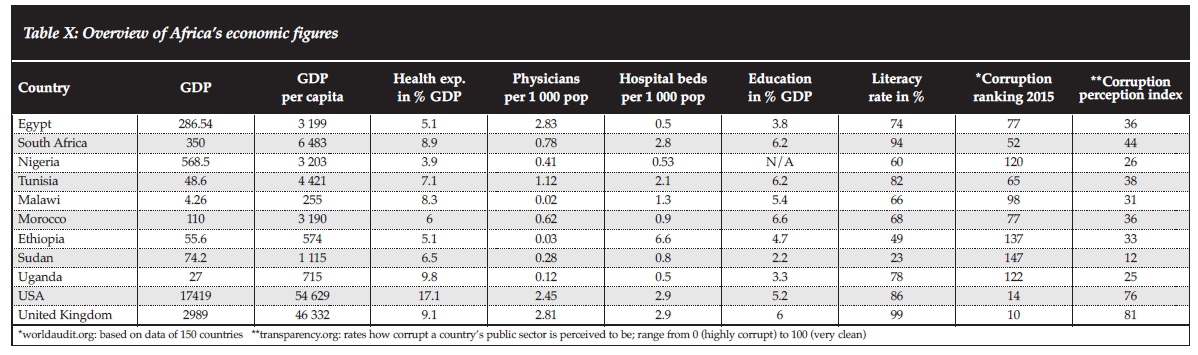
On the African continent, South Africa was among the countries with the highest health and education expenditure, the largest number of hospital beds, highest literacy rate and the lowest corruption ranking and corruption perception indices on the continent (Table X). However, it ranked only 3rd for physicians per 1 000 population (0.78) with both Egypt (2.83) and Tunisia (1.12) having higher number of physicians. When comparing South Africa to the UK, it is noteworthy that health expenditure and education expenditure in percentage GDP, hospital beds per 1 000 population and literacy rate were very similar.
Discussion
The results of this study demonstrated that South Africa is consistently ranked in the lower third of the 66 countries that published in the top 15 ranked orthopaedic journals. On the African continent, Egypt was the leading country for total publications and impact, maintaining the first rank even when adjusted for population size. GDP and GDP per capita are indicators of economic strength representing the value of all goods and services produced over a specific time period.12 The lower the cost of producing a research paper per capita/GDP should be a direct indicator of a country's research productivity. When adjusting for GDP and GDP per capita, South Africa ranked in the lowest quarter. Comparing South Africa's performance to the other African countries, Malawi, Egypt and Tunisia were better performers. This is somewhat surprising as the economic realities and figures in these countries are similar and one would expect a linear relationship between economic data and research productivity. Research output of the African countries is obviously not directly related to the highest per capita GDP; if it were, then South Africa would be the leader followed by Nigeria and Egypt. A similar observation was made in the developed world, where none of the five leading countries had the highest per capita GDP. The US is ranked 8th, Germany 15th, the UK 17th, Japan 23rd and Korea 27th.
Earlier research by Meo et al.14 and Halpenny et al.15 could not demonstrate a correlation between per capita GDP, total number of publications, or h-index in various science and social science journals, but did show a strong and positive correlation between the number of publications and the percentage of GPD spent on research. The available data from the World Bank from 2012 shows that Egypt (0.68%), South Africa (0.73%), Ethiopia (0.61%) and Tunisia (0.68) spend very similar percentages of their GDP on research funding.16 Based on these figures these countries should produce a very similar research output.
However, Egypt consistently publishes more articles than South Africa. The reason for this is not clear but may be related to the fact the Egypt has a higher rate of physicians per population.
We have developed a benchmark measure based on the median publications by dividing the per capita GDP with the median. In our opinion this benchmark allows for a more direct comparison between countries of research output related to per capita GDP. The result of this equation provided a clear value on how many publications were needed to achieve the median number of publications based on the individual country's per head GDP. As expected the USA was the overwhelming leader. For the African countries, South Africa ranked 31st overall and fell short by nine articles of reaching the benchmark. Again, Egypt was the African leader with a total of 68 publications requiring only 14 to reach the benchmark. Given that the economic indicators are comparable, the differences in physician density may again be the only explanation for the differences between the two countries.
Research output is an important determinant of economic growth and an increase in service delivery, education and innovation is often an indicator of a society's shift from a producing to a knowledge-based economy.20 In fact, publications of scientific literature can indicate the progress of science and technology.10 The number of publications in South Africa in the top 15 journals between 2010 and 2014 has been steady; in contrast, Egypt showed a 20% increase in publications between 2010 and 2014 despite volatile political circumstances. Obviously the below average publication record of South Africa cannot be explained by economic figures alone.
Shipley suggested that staff shortages and chaotic record systems hinder prospective and retrospective studies especially where long-term follow-up is required.8 However, these problems can be overcome by modern technology, personal engagement and involvement in the public sector, especially in the private sector of metropolitan areas. Shipley concedes that the underlying problem is possibly a lack of research ethos in the South African medical schools, lack of motivation of the individual and lack of recognition.8 One potential solution to increase the number of research publications certainly lies within the medical schools. Many orthopaedic registrars enrol in a Master's of Medicine (MMed) programme and research is a compulsory part of completion of the degree. These studies are possibly often not published and one could argue that in order to complete specialty training, a peer-reviewed publication should be compulsory. This is a common practice in other countries. A potential barrier to this approach is a lack of successful, motivated and well-trained academic teachers to provide individual guidance.
There are many other barriers in Africa that most likely affect the low research output on the continent. Elliot et al. have identified 19 barriers by conducting semi-structured interviews.21 These barriers range from resource constraints (funding, lack of protected research time, access to literature) to research processes (lack of training, record keeping, mentoring) to institutional barriers (culture, trauma burden, lack of collaboration). Simba et al. highlighted that despite the existence of adequate numbers of highly skilled researchers in Africa, the number of publications per faculty is low.22 This was attributed to the security of public employment, difficulties attracting research grants and outside work engagement with consultancies that assure additional income. Corruption is another major impediment to access healthcare in low-income countries and has an effect on research.23 Bouchard et al. demonstrated that one of the largest barriers to access orthopaedic and trauma care is corruption.7 The ranking of the included African countries on the 2015 corruption ranking index and corruption perception index, clearly demonstrates a high level of corruption in all countries. This is even more significant as the WHO has identified that the development of healthcare infrastructure is partly dependent on locally produced research, demonstrating the complex relationship between healthcare delivery, infrastructure and research. Interestingly, South Africa has very similar health and education expenditure in per cent/GDP and based on these facts could theoretically have a comparable and efficient health system to the United Kingdom. However, the UK ranks 10th on the 2015 corruption ranking and 81 on the corruption perception index, whereas South Africa ranks 52nd respectively and has a perceived corruption index of 44, indicating a medium level of corruption. Corruption may certainly be one factor explaining the differences between the two countries. The question must be asked how the South African healthcare system would perform if it had similar corruption indices.
What are the potential solutions? They are clearly related to building local capacity. Shipley suggested multi-centre studies, university-funded posts to promote research, cooperation with private surgeons and remunerated work outside the public service.8 Aluede et al. believes that multinational and cross-institutional collaborations and the initiation of educational programmes will generate more studies.5 The most important step might be the implementation of a mentoring programme. However, the lack of willingness of senior scientists and surgeons, and the lack of protected time are major limitations that must be addressed for this to be successful.5,21,22 Bennett et al. have suggested that mentoring could also be achieved by training mentors in the developed world.24 Finally the SA Orthopaedic Journal should be encouraged to apply to be indexed on Medline for worldwide dissemination of African-based research.
This study has limitations. The research was limited to the 15 highest impact orthopaedic journals. The inclusion of more journals may have resulted in a different outcome. The individual quality of each article was not assessed, making it possible that there was a significant discrepancy of the manuscript quality between countries, potentially introducing a selection bias. The selection of impact factor as an outcome measure for publication quality has been criticised as it is determined by technicalities not related to the scientific quality.25,26 Citation analysis was not performed and it is acknowledged that the number of citations are a proxy measure of influence reflecting the recognition and quality of the published research by its peers.27 Over-citation, biased citing, audience size, biased data and ignorance of the literature are common criticisms.28 Nevertheless, using impact reflects citation counts as article citation rates determine the journal's impact factor.25
This study developed a new approach to bibliometric analysis by using the median of all publications and relating it to the GDP per capita. This technique has not been validated and may lack the robustness of citation and content analysis. However, similar to classic bibliometrics, the calculated variable seems to allow for better comparisons between countries by establishing the number of publications required for a particular country to be equivalent with the average research output for a defined period of time taking the economic power per capita into consideration.
Conclusions
The results of this study demonstrated that South Africa ranked in the in the lower third of all 66 countries that published in the top 15 ranked orthopaedic journals. On the African continent, Egypt was the leading country for total publications and impact and maintained the first rank even when adjusted for population size, GDP, GDP per capita and research funding by the percentage of GDP. Finally South Africa missed the benchmark and published only 68% of the publications required to be equivalent.
Compliance with ethics guidelines
Prof Hohmann, Dr Glatt and Prof Tetsworth declare that the content of this article is their original work. No benefits of any form have been received from a commercial party related directly or indirectly to the subject of this article.
References
1. Coloma J, Harris E. From construction workers to architects: developing scientific research capacity in lower income countries. PLOS Biology 2009;7(7):e1000156. [ Links ]
2. Carey RM, Wheby MS, Reynolds RE. Evaluating faculty clinical excellence in the academic health sciences center. Academic Medicine 1993;68(11):813-17. [ Links ]
3. Christmas C, Kravet SJ, Durso SC, Wright SM. Clinical excellence in academia: perspectives from masterful academic clinicians. Mayo Clinic Proceedings 2008;83(9):989-94. [ Links ]
4. Luo X, Liang Z, Gong F, Bao H, Huang L, Jia Z. Worldwide produc tivity in the field of foot and ankle research from 2009-2013: a bibliometric analysis of highly cited journals. J Foot Ankle Res 2015;8:12. [ Links ]
5. Aluede EE, Phillips J, Bleyer J, Jergesen HE, Coughlin R. Representation of developing countries in orthopaedic journals. Clin Orth Relat Res 2012;470:2313-18. [ Links ]
6. Yamey G. What are the barriers to scaling up health interventions in low and middle income countries? A qualitative study of academic leaders in implementation science. Globalization Health 2012;8:11. [ Links ]
7. Bouchard M, Kohler JC, Orbinski J, Howard A. Corruption in the health care sector: a barrier to access of orthopaedic care and medical devices in Uganda. BMC Int Health Human Rights 2012;12:5. [ Links ]
8. Shipley J. Orthopaedic research in South Africa - the unstable pot. SA Orthopaedic Journal 2010;4:4. [ Links ]
9. Bosker BH, Verheyen CCPM. The international rank order of publications in major clinical orthopaedic journals from 2000 to 2004. J Bone Joint Surg Br 2006;88-B(2):156-58. [ Links ]
10. Hui Z, Yi Z, Peng J. Bibliometric analysis of the orthopaedic literature. Orthopedics 2013;36(10):e1225-e1232. [ Links ]
11. Lee KM, Ryu MS, Chung CY, Choi IH, Kwon DG, Kim TW, Sung KH, Seo SG, Park MS. Characteristics and trends of orthopedic publications between 2000 and 2009. Clinics Orthop Surg 2011;3:225-29. [ Links ]
12. Gurbuz Y, Sugun TS, Ozaksar K. A bibliometric analysis of orthopedic publications originating from Turkey. Acta Orthop Traumatol Turc 2015;49(1):57-66. [ Links ]
13. Kennedy C, O'Sullivan PO, Bilal M, Walsh A. Ireland's contribution to orthopaedic literature: a bibliometric analysis. The Surgeon 2013;11:267-71. [ Links ]
14. Meo SA, Al Masri AA, Usmani AM, Memom AN. Impact of GDP, spending on R&D, number of universities and scientific journals on research publications among Asian countries. PLOS One 2013;8(6):e66449. [ Links ]
15. Halpenny D, Burke J, McNeill G, Snow A, Torreggiani WC. Geographic origin of publications in radiological journals as a function of GDP and percentage of GDP spent on research. Academic Radiology 2010;17(6):768-71. [ Links ]
16. Journal Citation Reports for Scientific Information, 2015. www.webofknowledge.com [ Links ]
17. Marx R, Wilson SM, Swiontowski MF. Updating the assignment of levels of evidence. J Bone Joint Surg Am 2015;97:1-2. [ Links ]
18. World Bank list of economies. World Bank Data Development Group. Available at http://data.worldbank.org. Accessed January 20, 2016. [ Links ]
19. The world factbook. Central Intelligence Agency. Available at https://www.cia.gov/library/publications/resources/the-world-factbook. Accessed January 20, 2016. [ Links ]
20. Wong CY, Goh KL. The pathway of development: science and technology of NIEs and selected Asian emerging economies. Scientometrics 2012;92:523-48. [ Links ]
21. Elliott IS, Sonshine DB, Akhavan S, Shantz AS, Caldwell A, Shantz JS, Gosselin RA, Coughlin R. What factors influence the production of orthopaedic research in East Africa? A qualitative analysis of interviews. Clin Orthop Relat Res 2015;473:2120-30. [ Links ]
22. Simba D, Mukose A, Bazeyo W. Institutional capacity for health systems research in East and Cnetral African schools of public health: strengthening human and financial resources. Health Res Policy Systems 2014;12:23. [ Links ]
23. Kohler J. Fighting corruption in the health sector. Methods. United Nations Development Programmes: tools and good practices 2011. [ Links ]
24. Bennett S, Paina L, Ssengooba F, Waswa D, M'Imunya JM. Mentorship in African health research training prgrams: an explanatory study of Fogarty international programs in Kenya and Uganda. Education Health 2013;26(3):183-87. [ Links ]
25. Seglen PO. Why the impact factor of journals should not be used for evaluating research. BMJ 1997;314:498-502. [ Links ]
26. Whitehouse GH. Impact factors: facts and myths. Eur Radiol 2002; 12:715-717. [ Links ]
27. Lefaivre KA, Shadgan B, O'Brien PJ. 100 most cited articles in orthopaedic surgery. Clin Orth Relat Res 2011; 469:1487-97. [ Links ]
28. Mac Roberts MH, Mac Roberts BR. Problems of citation analysis. Scientometric 1996; 36(3):435-444. [ Links ]
 Correspondence:
Prof Erik Hohmann
Musculoskeletal Research Unit
PO Box 4045
Rockhampton, QLD 4700, Australia
Email: ehohmann@hotmail.com

