


Serviços Personalizados
Artigo
 Inglês (pdf)
 Artigo em XML
 Referências do artigo
Indicadores

Links relacionados
-
 Citado por Google
 -
 Similares em Google
Compartilhar

 Permalink
Southern African Journal of Critical Care (Online)
versão On-line ISSN 2078-676X
versão impressa ISSN 1562-8264
South. Afr. j. crit. care (Online) vol.38 no.1 Pretoria Mar. 2022
http://dx.doi.org/10.7196/SAJCC.2022.v38i1.532
RESEARCH
Prediction of in-hospital mortality: An adaptive severity-of-illness score for a tertiary ICU in South Africa
S PaziI; G SharpII; E van der MerweIII, IV
IBSc (Hons), MSc; Department of Statistics, Nelson Mandela University, Gqeberha, South Africa
IIBSc (Hons), MSc, PhD ; Department of Statistics, Nelson Mandela University, Gqeberha, South Africa
IIIMB ChB, MMed, FRCP (UK), Cert Cnt Care (CMSA); Adult Critical Care Unit, Livingstone Hospital, Gqeberha, South Africa
IVMB ChB, MMed, FRCP (UK), Cert Cnt Care (CMSA); Department of Anaesthesia and Critical Care, Faculty of Health Sciences, Walter Sisulu University, Mthatha, South Africa
ABSTRACT
BACKGROUND. A scoring system based on physiological conditions was developed in 1984 to assess the severity of illness. This version, and subsequent versions, were labelled Simplified Acute Physiology Scores (SAPS). Each extension addressed limitations in the earlier version, with the SAPS III model using a data-driven approach. However, the SAPS III model did not include data collected from the African continent, thereby limiting the generalisation of the results.
OBJECTIVES. To propose a scoring system for assessing severity of illness at intensive care unit (ICU) admission and a model for prediction of in-hospital mortality, based on the severity of illness score.
METHODS. This is a prospective cohort study which included patients who were admitted to an ICU in a South African tertiary hospital in 2017. Logistic regression modelling was used to develop the proposed scoring system, and the proposed mortality prediction model.
RESULTS. The study included 829 patients. Less than a quarter of patients (21.35%; n=177) died during the study period. The proposed model exhibited good calibration and excellent discrimination.
CONCLUSION. The proposed scoring system is able to assess severity of illness at ICU admission, while the proposed statistical model may be used in the prediction of in-hospital mortality.
Keywords: critical care, hospital mortality, ICU scoring system, intensive care, severity of illness, SAPS III, Africa.
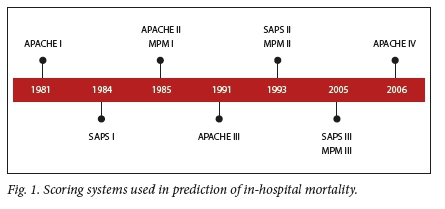
Severity of illness scores are commonly used in intensive care units (ICUs) to estimate the risk of in-hospital mortality.![1] The prediction of such risk is of importance in optimising limited hospital resources, such as beds or ventilators.[2] Commonly-used severity of illness scoring systems include the Acute Physiology and Chronic Health Evaluation (APACHE), Mortality Probability Model (MPM) and the Simplified Acute Physiology Score (SAPS)[1] Each of these scoring systems has several versions, as shown in Fig. 1. Of interest to this research is the SAPS III (SAPS 3) model, commonly referred to as SAPS 3. Moreno et al.[3] proposed the following model for prediction of in-hospital mortality based on a SAPS 3 score:
Generally, a SAPS 3 score is computed within 1 hour of ICU admission and is converted to probability of in-hospital mortality using the aforementioned equation. Though the SAPS 3 model was developed for use worldwide, the dataset used in its development was not representative of the global case mix.Pl Owing to this, external validation of the SAPS 3 model is necessary, prior to its use in any ICU.P] Nassa et al.[A] reviewed published studies that externally validated the SAPS 3 model and demonstrated that the SAPS 3 model could not be used to predict in-hospital mortality in many ICUs. In particular, of the 28 studies reviewed, it was found that the model exhibited lack-of-fit in 60.71% (n=17) studies. There are few studies that externally validated the SAPS 3 model in a general ICU, post 2013.[5-9] However, most of these sought to investigate the performance of this model in a specific group of patients. As the present study is not a systematic review, these studies are not reported.
The findings of the Nassar et al.[4]study supported the motivation for conducting this study in the South African (SA) context. Additional motivation came from the Van der Merwe et al.[10] study, which was the first to externally validate the SAPS 3 model in Sub-Saharan Africa (SSA). They found that the SAPS 3 model could be used to describe case mix in a SA-based ICU based on a Hosmer-Lemeshow (H-L) goodness-of-fit test with a p-value of 0.15. On the basis of this significant p-value, it was decided to investigate whether a model based on African ICU data would improve the fit. The third motivation stemmed from the omission of African-based ICUs in the development of the SAPS 3 model.
The aim of the study is to develop a prognostic model for prediction of in-hospital mortality in a tertiary public hospital in SA. The objectives of the study were to propose a severity-of-illness scoring system using data collected in a SA hospital and to develop a statistical model for predicting in-hospital mortality based on the proposed severity-of-illness score.
Methods
Study design and source of data
The study design was a prospective observational study conducted in a closed multidisciplinary 16-bed tertiary ICU with fulltime onsite resident cover, fulltime specialist cover and a registered nurse to patient ratio of 3:4. Livingstone Tertiary Hospital serves ~1.6 million people from an area of 60 000 km2. The dataset was extracted from the database of an observational ICU study: acute kidney injury in critically ill patients in a tertiary ICU in the Eastern Cape, SA (the LivAKI study), which included 875 admissions to Livingstone Tertiary Hospital adult ICU.[2] All first-time ICU admissions aged 12 years and older, admitted between 3 January 2017 and 3 January 2018 were included. Exclusion criteria were patients who arrived moribund and who died within 6 hours of admission (considered inappropriate ICU referrals), patients admitted to step-down beds for drug infusions, patients with incomplete data sets (e.g. unknown hospital outcome, patients who were re-admitted to ICU, brain-dead patients admitted for organ donation and patients with end-stage kidney disease who were found ineligible for long-term renal replacement therapy due to resource limitations).
Ethics considerations
Ethics approval for data collection during the LivAKI study was granted by the Walter Sisulu University Human Research Ethics Unit (ref. no. 067/2016). The need for study participants' consent was waived, as this was a non-experimental study that would not influence patient management.
Predictor and outcome variables
The outcome variable of interest was defined as the survival status (survivor/non-survivor) at discharge. A survivor was defined as a patient who was discharged alive during the study period. On the other hand, a non-survivor was defined as a patient who demised in the hospital during the study period.
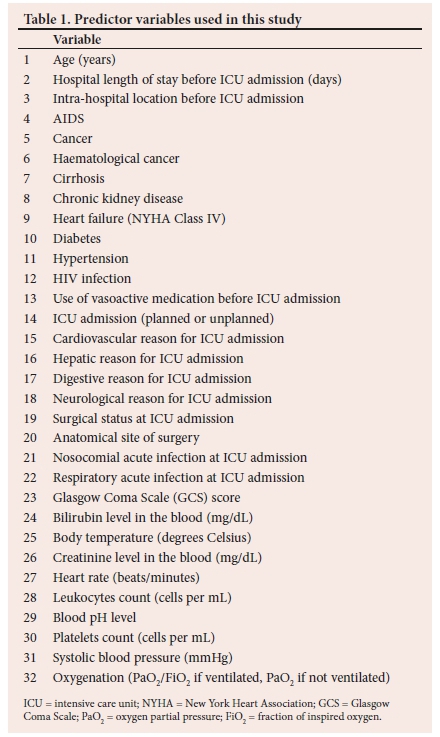
The variables in the SAPS 3 model were used as predictor variables. In addition, the presence of chronic kidney disease, diabetes, hypertension, and HIV status were added to the list of variables from the SAPS 3 model. These comorbidities were added due to their prevalence in SA. The list of all predictor variables in this study is provided in Table 1.
Data collection
Data for each predictor variable were collected within an hour of ICU admission, while the outcome of interest was recorded at discharge.
Overview of the research methodology
Depicted in Fig. 2 is the general framework of the methodology used in this study. Firstly, four multiple logistic regression models were developed, each of which was used to develop a scoring system, with weights in each scoring system derived by multiplying the estimated coefficients of a multiple logistic regression model by 10. Secondly, each scoring system was used to generate a severity-of-illness score for each patient in the study sample. The sample with the new scores was used to cross-validate the results. Cross-validation was repeated 500 times using the technique described by Pazi et al.[11] Lastly, the four models were compared by analysing the results from 500 validation samples.
Variable selection
Predictor variables in the first multiple logistic regression model (model 1) are listed in Table 1. A forward-selection approach was employed in selecting predictor variables for inclusion in the second multiple logistic regression model (model 2). The goal for model 2 was to mainly consist of physiological variables, similar to the SAPS II model. Therefore, the forward-selection approach began with the fit of a logistic regression model including physiological variables only (variables 23 - 32 in Table 1). Other predictor variables were added in a stepwise manner, using a likelihood ratio test as the criterion. A significance level of 0.10 was used to determine whether a variable was eligible for entry in each step.
A forward-selection procedure was also used to select variables for inclusion in the third multiple logistic regression model (model 3). However, this approach started with the fit of a logistic regression model with zero predictor variables. Predictor variables were added in the manner described in the previous paragraph. Lastly, univariate analyses were conducted to select variables for inclusion in the fourth multiple logistic regression model (model 4). Each univariate analysis required conducting a statistical hypothesis test to assess the association between the outcome variable and a predictor variable. Statistical hypothesis tests used include the Pearson's chi-squared test and the Fisher's exact test. All the variables which were statistically significant, at the significance level of 0.15, in the univariate analyses, were added to model 4. A higher significance level was used to account for confounders that may not have been evident in the univariate analysis.
Cross-validation of results
The following steps were used to cross-validate the results:
• Step 1: Randomly divide the study sample with the new scores into a developmental sample (67%) and a validation sample (33%)
• Step 2: Use the developmental sample to derive a model that transforms a severity-of-illness score to probability of in-hospital mortality for each scoring system
• Step 3: Predict in-hospital mortality for each patient in the validation sample
• Step 4: Compare the observed and the predicted outcomes in the validation sample
• Step 5: Repeat steps 1 -4 500 times.
Each mortality prediction model in step 2 was developed using simple logistic regression:
Probability of in-hospital mortality = 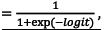
where
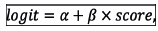
a and β are parameters of the model which are mathematical constants, and the score refers to the numerical value computed by the associated scoring system. The parameters, a and β, were estimated by means of the method of maximum likelihood.
In step 4, the observed and predicted outcomes were compared by evaluating goodness-of-fit, discrimination and classification ability of each mortality prediction model. The H-L test, standardised mortality ratio (SMR) and the flexible calibration curve were used to assess goodnes-of-fit[12151,13] Discrimination was assessed using an area under the receiver operating characteristic curve (AUC) and area under the precison-recall curve[1] Three performance metrics including balanced accuracy (BA), bookmarked informedness (BM) and markedness (MK), were used to assess classification ability. These performance metrics were computed as:
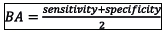
(worst value = 0; best value = 1)
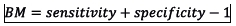
(worst value = -1; best value = 1)

(worst value = -1; best value = 1)
Each of the three aforementioned classification metrics measures the model's ability to predict class membership (i.e. survivor or non-survivor). In other words, they measure the classification accuracy of the model.
Cross-validation was considered important for the purposes of comparing the performance of the models developed in this study. After selecting the superior model, goodness-of-fit and discrimination thereof, were assessed on a single-validation sample.
Results
Participants
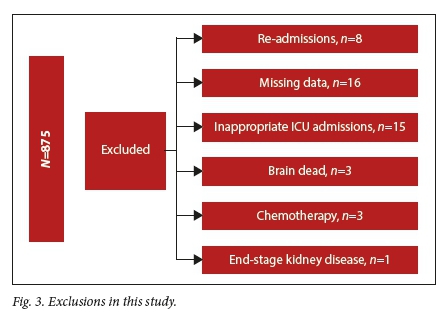
There were 875 patients admitted to the multidisciplinary ICU at Livingstone Tertiary Hospital between 3 January 2017 and 3 January 2018. Of these 875 patients, 46 were excluded, resulting in the study sample of 829 patients. Fig. 3 shows the groups of patients who were excluded in this study.
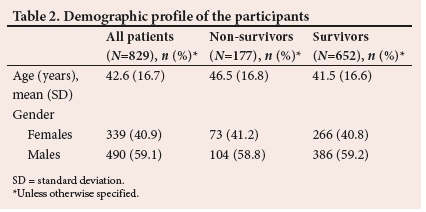
Less than a quarter of patients (21.35%; ;1=177) died during the study period. Table 2 presents basic demographics of the patients in the study. On average, the non-survivors were older than the survivors. This is evident from the mean values and the f-test analysis (p=0.00030). Furthermore, the percentage of male survivors was approximately the same as that of male non-survivors. The same was observed in the female groups. Therefore, there is little to no association between gender and in-hospital mortality. These results were confirmed by the Pearsons chi- squared test (p=0.9835).
The scoring systems
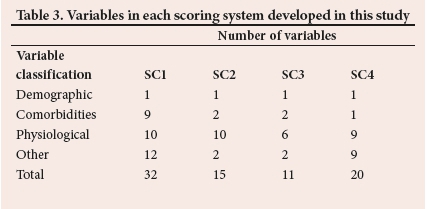
Table 3 summarises the number of variables into four classes for each scoring system. The list of all variables in each scoring system can be found in Appendix A (https://www.samedical.org/file/1835).
Comparison of the models
Table 4 summarises the cross-validation results from the validation samples. The column labelled p<0.05 reports, in percentage, the results of the 500 H-L tests. Each mean AUC is the arithmetic mean of the AUC values from all 500 validation samples, with mean BA, mean BM, and mean MK defined similarly.
The proposed model
The following is the proposed model for prediction of in-hospital mortality.
Probability of in-hospital mortality
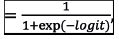
where
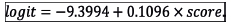
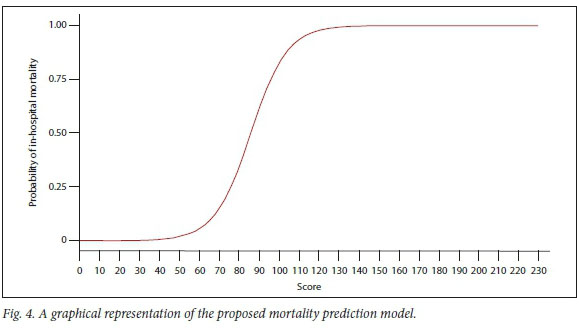
Fig. 4 is the graphical representation of the proposed mortality prediction model.
The multiple logistic regression model from which the proposed scoring system was derived is tabled as Appendix B (https://www.samedical.org/file/1835).
Calibration of the proposed model
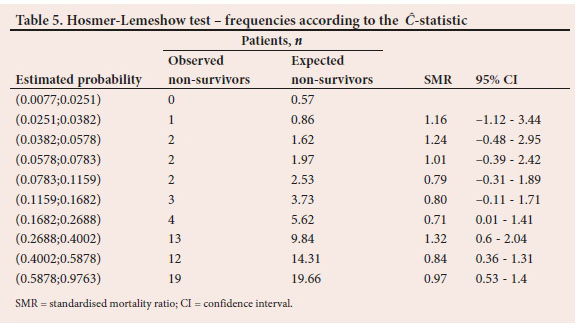
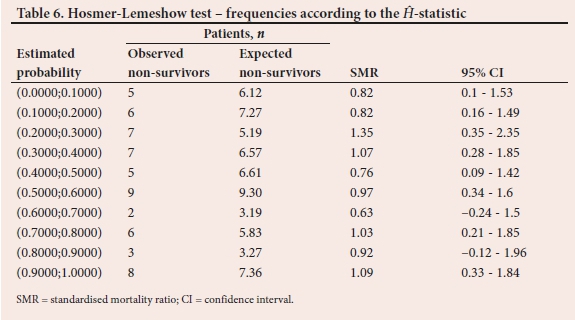
To demonstrate the comparison between observed and expected non-survivor frequencies, Tables 5 and 6 report the results from the last of the 500 validation samples. The estimated probabilities of in-hospital mortality in Table 5 are grouped according to percentiles. Also displayed in Table 5 is the SMR, with associated 95% confidence interval (Cl) for each risk group. Table 6 is similar to Table 5. However, the probabilities are grouped according to fixed values as shown in the first column. The C test statistic based on the frequencies in Table 5 is 3.96 (p=0.9489) while the H from the frequencies in Table 6 is 4.16 (p=0.9399).
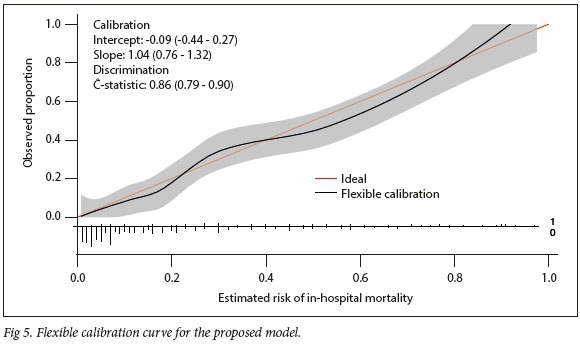
Depicted in Fig. 5 is the flexible calibration curve for assessment of goodness-of-fit of the proposed model. Fig. 5 also includes the intercept, slope, and the c-statistic with associated 95% CL
Discrimination of the proposed model
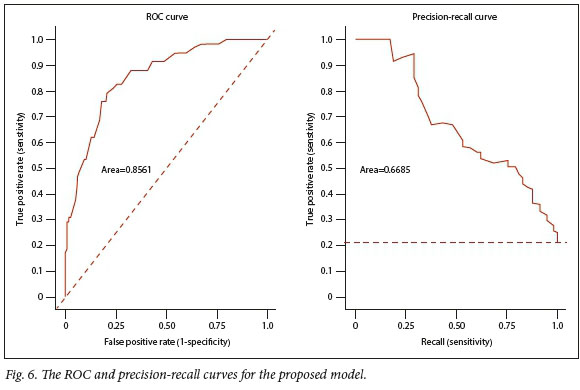
Fig. 6 depicts the receiver operating curve (ROC) and the precision-recall curve for the proposed model.
Discussion
The variables in the first scoring system (SCI) were similar to those in the SAPS 3 model. The difference is that chronic kidney disease, hypertension, diabetes and HIV do not form part of the comorbidities in the SAPS 3 model. The second scoring system (SC2) measured severity of illness based mainly on physiological data, thereby making it similar to the SAPS II model. The third scoring system (SC3) is unique in the sense that its variables were selected based solely on statistical significance. Variables in the fourth scoring system (SC4) were also selected based on statistical significance. However, each variable needed to be statistically significant in a univariate analysis, and not necessarily in the multivariate analysis.
Table 4 shows that 12.6% of the 500 validation samples resulted in lack-of-fit of the SCI model. Similarly, 13% resulted in lack-of-fit of the SC2 model, 12.2% resulted in lack-of-fit of the SC3 model, and 16.4% in that of the SC4 model. This means that fewer validation samples resulted in lack-of-fit for each model developed in the present study. By comparison, almost a third (31.2%) of the 500 validation samples resulted in lack-of-fit of the SAPS 3 model, supporting the development of a model more suited to the SA ICU. In addition, Table 4 shows that the models developed in this study exhibited similar discrimination, although the SCI model had a marginally higher discrimination ability. Moreover, the discrimination ability of the SCI model was higher than that of the SAPS 3 model.
The mean BA, BM, and MK in Table 4 measured the performance of each model as a classifier. The BA measured the overall accuracy of each model by combining sensitivity (recall) and specificity into a single statistic. It is preferred over the classification accuracy when classes are imbalanced. The BM measured the model's ability to balance sensitivity and specificity, with MK defined similarly but measuring the model's ability to balance positive predictive value (precision) and negative predictive value. The results in Table 4 show that the models developed in this study exhibited similar classification abilities. However, the classification ability of the SCI model was marginally higher than the other models, including the SAPS 3 model.
Owing to its superior performance, the SCI model is proposed. In theory, a severity-of-illness score generated by the proposed scoring system ranges from zero to 230. Fig. 4 shows the probability of in-hospital mortality for all possible values of the score from zero to 230. It is evident from Fig. 4 that the proposed model gives a low probability to a low score, and as the score increases, the probability also increases. In addition, the risk of mortality during hospital stay is close to one for any patient with a score >130. In contrast, any patient with a score <40 has a probability of demise close to zero.
Tables 5 and 6 and Fig. 5 are a result of assessing the proposed model in a single validation sample. The proposed model exhibited good calibration according to both the H-L test and the flexible calibration curve. This is evident from the H-L test statistics of C=3.96 (p=0.9489) and H=4.16 (p=0.9399), and the calibration intercept close to zero with the calibration slope close to one. In addition, Fig. 6 shows that the proposed model exhibited good discrimination with the area under the ROC of 0.8561, and area under the precision-recall curve of 0.6685.
Study strengths and limitations
Firstly, to the best of the authors' knowledge, this is the first study to develop a model similar to the SAPS 3, using data collected in a SA hospital. Secondly, the literature provides support for the external validation of the SAPS 3 model, prior to its use in any ICU. Van der Merwe et al.[10] externally validated the SAPS 3 model in SSA, and showed that the SAPS 3 model can be used to describe case mix in a tertiary ICU in SA. The present study demonstrates that although the SAPS 3 model was found to be adequate, a model with superior discrimination and classification abilities exists, namely the SC1 model.
The SC1 model was developed using data collected in a single hospital. Therefore, to generalise use, the proposed model needs to be prospectively validated in other hospitals in SA.
Conclusion
The SAPS 3 model was developed without including data from Africa. This study developed a model similar to the SAPS 3 using data collected in a SA tertiary hospital. The proposed model exhibited good calibration with excellent ability to distinguish between survivors and non-survivors. Future research should include the prospective validation of the proposed model in other hospitals in SA.
Declaration. This study was done in partial fulfilment of requirements for a PhD degree (SP).
Acknowledgements. The authors would like to acknowledge Dr Ryan Aylward, Dr Robert Freercks, Dr Minnete van Niekerk, Dr Jason Ensor and Dr Debbie Baker for their involvement in the data collection.
Authors contributions. SP, GS and EVDM conceptualised and designed the study. SP analysed and interpreted the data, and wrote the manuscript. GS and EVDM revised the manuscript. All authors approved the final version of the manuscript for publication.
Funding. This work was supported by a grant from the National Research Foundation of South Africa (grant number 129558).
Conflicts of interest. None.
References
1. Vincent JL, Moreno R. Clinical review: Scoring systems in the critically ill. Crit Care 2010;14(2):207. https://doi.org/10.1186/cc8204 [ Links ]
2. Aylward RE, van der Merwe E, Pazi S, et al. Risk factors and outcomes of acute kidney injury in South African critically ill adults: A prospective cohort study. BMC Nephrol 2019;20(460):1-11. https://doi.org/10.1186/s12882-019-1620-7 [ Links ]
3. Moreno RP, Metnitz PGH, Almeida E, et al. SAPS 3 - From evaluation of the patient to evaluation of the intensive care unit. Part 2: Development of a prognostic model for hospital mortality at ICU admission. Intensive Care Med 2005;31(10):1345-1355. https://doi.org/10.1007/s00134-005-2763-5 [ Links ]
4. Nassar AP, Malbouisson LS, Moreno R. Evaluation of simplified acute physiology score 3 performance: A systematic review of external validation studies. Crit Care 2014;18(3):1-9. https://doi.org/10.1186/cc13911 [ Links ]
5. Melo FL, Gragnani A, de Oliveira AF, Ferreira LM. Predicting mortality for critically ill burns patients, using the Abbreviated Burn Severity Index and Simplified Acute Physiology Score 3. Injury 2022;53(2):453-456. https://doi.org/10.1016/j.injury.2021.11.027 [ Links ]
6. Zhu Y, Zhang R, Ye X, Liu H, Wei J. SAPS III is superior to SOFA for predicting 28-day mortality in sepsis patients based on Sepsis 3.0 criteria. Int J Infect Dis 2022;114:135-141. https://doi.org/10.1016/j.ijid.2021.11.015 [ Links ]
7. Dosi R, Jain G, Jain N, Pawar K, Sen J. The predictive ability of SAPS II, APACHE II, SAPS III, and APACHE IV to assess outcome and duration of mechanical ventilation in respiratory intensive care unit. Lung India 2021;38(3):236-240. https://doi.org/10.4103/lungindia.lungindia_656_20 [ Links ]
8. Kurtz P, Bastos LS, Salluh JI, Bozza FA, Soares M. SAPS-3 performance for hospital mortality prediction in 30 571 patients with COVID-19 admitted to ICUs in Brazil. Intensive Care Med 2021;47(9):1047-1049. https://doi.org/10.1007/s00134-021-06474-3 [ Links ]
9. Metnitz PG, Moreno RP, Fellinger T, Posch M, Zajic P. Evaluation and calibration of SAPS 3 in patients with COVID-19 admitted to intensive care units. Intensive Care Med 2021;47(8):910-912. https://doi.oig/10.1007/s00134-021-06436-9 [ Links ]
10. Van der Merwe E, Kapp J, Pazi S, et al. The SAPS 3 score as a predictor of hospital mortality in a South African tertiary intensive care unit: A prospective cohort study. PLoS ONE 2020;15(5):e0233317. https://doi.org/10.1371/journal.pone.0233317 [ Links ]
11. Pazi S, Clohessy CM, Sharp GD. A framework to select a classification algorithm in electricity fraud detection. S Afr J Sci 2020;116(9/10):1-7. http://dx.doi.org/10.17159/sajs.2020/8189 [ Links ]
12. Hosmer D, Lemeshow S. Goodness of fit tests for the multiple logistic regression model. Commun Stat Theory Methods 1980;9(10):1043-1069. https://doi.org/10.1080/03610928008827941 [ Links ]
13. Lemeshow S, Hosmer DW A review of goodness of fit statistics for use in the development of logistic regression models. Am J Epidemiol 1982;115(1):92-106. https://doi.org/10.1093/oxfordjournals.aje.a113284 [ Links ]
14. Hanley J, McNeil B. The meaning and use of the area under a receiver operating characteristic (ROC) curve. Radiology 1982; 14 3( 1 ):29- 36. https://doi.org/10.1148/radiology.143.1.7063747 [ Links ]
15. Van Calster B, McLernon DJ, Van Smeden M, Wynants L, Steyerberg EW. Calibration: the Achilles heel of predictive analytics. BMC Med 2019;17(1):1-7. https://doi.org/10.1186/s12916-019-1466-7 [ Links ]
 Correspondence:
SPazi
sisa.pazi@mandela.ac.za
Accepted 4 March 2022
Contributions of the study: This study is the first to develop a model similar to the SAPS III model, based on data collected in South Africa. In addition, this study provides a potential starting point for the development of a model that can be used nationally.

