


Serviços Personalizados
Artigo
 Inglês (pdf)
 Artigo em XML
 Referências do artigo
Indicadores

Links relacionados
-
 Citado por Google
 -
 Similares em Google
Compartilhar

 Permalink
Southern African Journal of Critical Care (Online)
versão On-line ISSN 2078-676X
versão impressa ISSN 1562-8264
South. Afr. j. crit. care (Online) vol.37 no.1 Pretoria Mar. 2021
http://dx.doi.org/10.7196/SAJCC.2021.v37i1.473
RESEARCH
Identifying ICU admission decision patterns in a '20-questions game' approach using network analysis
P D GopalanI, II; S PershadIII, IV
IMB ChB, FCA (SA), Cert Crit Care, PhD; Discipline of Anaesthesiology and Critical Care, School of Clinical Medicine, Nelson R Mandela School of Medicine, University of KwaZulu-Natal, Durban, South Africa OrcID 0000-0002-3816-1171
IIMB ChB, FCA (SA), Cert Crit Care, PhD; Intensive Care Unit, King Edward VIII Hospital, Durban, South Africa. OrcID 0000-0002-3816-1171
IIIB ChB, FCS (SA), Cert Crit Care Intensive Care Unit, Inkosi Albert Luthuli Central Hospital, Durban, South Africa
IVB ChB, FCS (SA), Cert Crit Care Discipline of Anaesthesiology and Critical Care, School of Clinical Medicine, Nelson R Mandela School of Medicine, University of KwaZulu-Natal, Durban, South Africa OrcID 0000-0002-3816-1171
ABSTRACT
BACKGROUND: The complex intensive care unit (ICU) admission decision process has numerous non-linear relationships involving multiple factors. To better describe and analyse this process, exploration of novel techniques to clearly delineate the importance and interrelationships of factors is warranted. Network analysis (NA), based on graph theory, attempts to identify patterns of connections within a network and may be useful in this regard.
OBJECTIVES: To identify patterns of ICU decision-making pertaining to patients referred for admission to ICU and to identify key factors, their distribution, connection and relative importance. The secondary aim was to compare subgroups as per decision outcomes and case labels.
METHODS: NA was performed using Gephi software package as a secondary analysis on a dataset generated from a previous study on ICU admission decision-making process using a 20-questions game approach. The data were standardised and coded up to a quaternary level for this analysis.
RESULTS: The coding process generated 31 nodes and 964 edges. Regardless of the measure used (centrality, prestige, authority and hubs), properties of the acute illness, progress of the acute illness and properties of comorbidities emerged consistently as among the most important factors and their relative rankings differed. Using different measures allowed important factors to emerge differentially. The six subgroups that emerged from the modularity measure bore little resemblance to traditional factor subgroups. Differences were noted in the subgroup comparisons of decision outcomes and case prognoses.
CONCLUSIONS: The use of NA with its various measures has facilitated a more comprehensive exploration of the ICU admission decision, allowing us to reflect on the process. Further studies with larger datasets are needed to elucidate the exact role of NA in decision-making processes.
Keywords: critical care; intensive care unit; ICU admission; network analysis; ICU decision-making; 20-questions game.
Decision-making is the cognitive process of identifying and choosing between a number of options of varying probabilities by sufficiently reducing their uncertainty according to one's preferences, values and goals, with a resultant outcome that always involves risk.[1-4] In critical care environments, decision-making is usually high-stress, high-stakes and time-sensitive. Decisions on admitting patients to the intensive care unit (ICU) at referral are particularly difficult, as practitioners strive to balance a high demand against a restricted resource.[5] Analysing and understanding the decision-making process may help to make such daunting decisions more manageable, appropriate and fair. It would also allow for more effective reflection that is essential for attempts to improve such processes.
Novel approaches may better elucidate the complexities of the decision-making process compared with traditional methods. We have previously used a modified 20-questions game approach to better explore this complex process.[6] Twenty-questions is a spoken game in which a player chooses an 'object' that others need to guess through a series of strategic questions and the game is won if a correct guess is made within 20 questions.[7] The rationale for using the game centred around: (i) the game's ability to promote deductive reasoning while limiting information acquired to only that considered vital as per Ashby's law;[8] and (ii) the game's propensity to allow the clinical case to be reframed from the perspective of the receiver (critical care practitioner) rather than the sender (referring doctor).[9]
Decision science as applied to medicine has focussed primarily on clinical decision-making, with emphases on diagnostic and management decisions. In practice, however, a series of decisions in other domains, including system-related decisions, are also key in ensuring appropriate patient care. Operational research methods may be considered in these situations. Operational research is a scientific approach using advanced analytics to the solution of problems in managing complex systems that often involve considerable uncertainty.[10] Problems are initially broken down into basic components and then solved in defined steps by mathematical analytical methods that include logic, simulation, network analysis (NA),[11] queueing theory[12] and game theory.[13] To explore ICU admission decision-making holistically, a combination of traditional models and operations research may be necessary.
The ICU admission decision process is complex, with numerous non-linear relationships between multiple factors. Identifying and analysing this process warrants the exploration of novel techniques to better describe such inter-relationships. One means of doing this is via NA.[11] This analysis is based on graph theory[14] and attempts to identify patterns of connections within a network. NA has been used for social and semantic networks in numerous contexts such as aviation,[15] social and friendship networks,[16] linguistics,[17] doctor networks in health systems,[18] genome analysis,[19] and risk identification in healthcare.[20]
There has been limited use of NA in critical care environments. It has been used to depict information use patterns among ICU nurses,[21] describe patterns and methods of communication during patient handoffs,[22] and explore research topics and trends in nursing-related communication in ICU.[23] NA use has been even more limited in ICU decision-making. It has been used to explore implementation of evidence-informed decision-making interventions,[24] evaluate decision-making under risk using functional MRI,[25] and identify nursing diagnosis patterns in ICU.[26]
Application of a NA model to ICU decision-making may help in identifying key factors that contribute to the decision to admit or refuse a patient referred to ICU. The inter-relationships among factors may be described with emerging patterns better elucidating the complexities of these decision-making processes and describing how doctors work through these processes.
We aimed to identify patterns of ICU decision-making using NA on decision-making process data generated by a 20-questions game approach so as to identify key factors, their distribution, connection and relative importance. The secondary aim was to compare subgroups as per decision outcomes and case prognoses.
Methods
Dataset
The present study was a secondary analysis of a dataset created from a previous study (20-questions study) where the methods were fully described.[6] Twenty-nine critical care practitioners affiliated to the Discipline of Critical Care at the University of KwaZulu-Natal and responsible for ICU admission and triage decisions were telephonically interviewed to make admission decisions on two hypothetical ICU case referrals created as generic representations for general ICU outcome prognostication. SP posed as the referring doctor for all participants while PDG acted as administrator and tracked the questions. The cases were designed with one (case A) with a poorer prognosis and thus aimed at more likely refusal into ICU, and the other (case B) with a better prognosis and thus aimed at more likely acceptance into ICU. Participants were told that they were being called for an ICU referral with no further patient information volunteered. Participants then posed a series of up to 20 questions seeking specific data to allow them to accumulate information to make a decision on whether the patient should be accepted or refused into the ICU. Each question posed was answered as fully as possible. The participant was able to make an admission decision at any point in the interview. All interviews were voice recorded. The process was repeated for each of the two cases during the same telephone call.
The recorded interviews were analysed and coded independently by PDG and SP. During case interviews, the following were recorded: case allocation (A or B); each query; number of queries; each question posed; number of questions; and decision made (accept or refuse). A question, defined as an enquiry on a specific factor or aspect of a factor, was counted for 20 questions. A query was defined as any enquiry expressing doubt or requesting further information to establish the validity or accuracy of a question or factor. This may have been an elaboration to add more detail concerning what had already been said or a clarification attempting to make a statement more comprehensible. All coded queries and questions were used for this analysis.
Network analysis
Analysis was conducted using Gephi version 0.9.2 (www.gephi.org; Gephi, France), an open-source, multi-platform network analysis and visualisation software package.[27] Gephi graphical interface makes it relatively easy to use and allows for broad access to, and exploration of, networks via a real-time graphics rendering process, giving it advantages over other NA software.[28]
Pre-processing
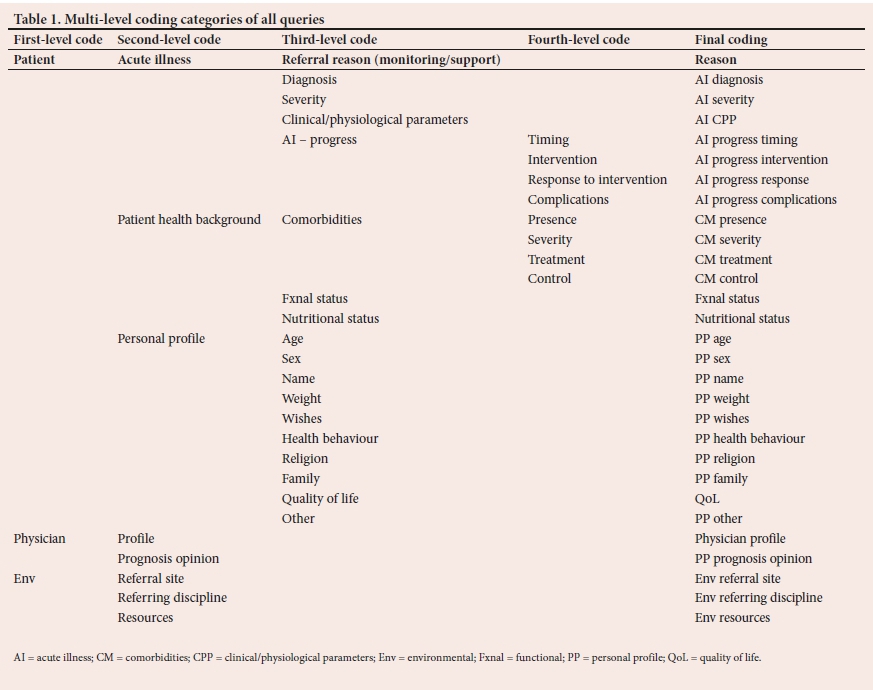
Data from a previous study[6] were standardised for this analysis. Every enquiry (query or question) was included. Forty-two clarifications from the previous analysis were recoded as per the query to which they referred. The queries posed were coded into the primary groups of patient-related, physician-related and environment-related (Table 1). Patient-related factors were subcoded into the following secondary groups: acute illness, patient health background and patient profile (PP). These were further classified into tertiary and quaternary groups. The final coding for each query is also recorded in Table 1. All coded queries from the 58 case decisions by 29 practitioners were utilised. A total of 965 queries involved in decision-making were considered as nodes. Duplicates were removed. The movement from one query to the next was considered as an edge.
Modelling assumptions
Various assumptions were made during modelling. Networks may be directed or undirected.[29] A directed graph contains an ordered pair of nodes and there is a direction associated with the edges that connect the nodes. Undirected graphs have disordered nodes and no direction associated with edges. We opted to use directed graphs as the queries posed in the 20-questions game were considered to be sequential to the order of the participants' questioning. However, this may not necessarily be true in terms of how questions get processed in the minds of the participants and may be more seemingly undirected. We did not consider each individual's networks separately but rather as a composite of all. We did not create an edge from each individual's last node to the first node of the subsequent participant as we considered these to be unconnected. There was also no edge from the last node of a participant's first case and the first node of their second case. It may be argued that these could well have been connected, as the participant's first decision may impact on the second case. However, as we had a break between the cases during the interviews, we felt it better to consider them separately.
We applied specific conditions on the Gephi programme.[27] Time representations were intervals with self-loops allowed. Parallel edges were not merged. Statistical analysis was used to determine the following measures: degree centrality, harmonic closeness centrality, betweenness centrality, in-degree prestige, hyperlink-induced topic search (HITS) for authority and hubs, modularity (with a resolution of 0.5) and clustering coefficient.
Measuring centralities
We used three centrality indices to identify the relative importance of individual nodes in the network: degree centrality (number of edges connected to a node); betweenness centrality (number of times a node is present in the shortest path between two other nodes); and closeness centrality (average length of the shortest path from the node to all other nodes).[30] A higher degree centrality reflects greater shared links with other nodes.[31] Betweenness centrality indicates that an important node lies on the paths between two other nodes and is a good representation of its influence in the network.[32] Nodes lying most frequently on these shortest paths have a higher betweenness centrality score. Nodes with the shortest distances to all other nodes will generate a high closeness centrality score. Harmonic centrality is a variant of closeness centrality that deals with infinite values. Rather than summing the distances of a node to all other nodes, the harmonic centrality algorithm sums the inverse of those distances.[33] All centrality indices identify the most important nodes in the network.
Prestige
Prestige is an alternative means of evaluating the importance of a node by assessing the importance of neighbouring nodes. In a directed graph, in-degree prestige estimates the importance of a node by the number of edges coming into the node.[30] A higher in-degree prestige value indicates greater importance.
Hyperlink-induced topic search
The HITS function in Gephi analysis generates two measures, the authority of a node and hub.[27] The authority of a node is a measure of the value of information stored at that node. A higher authority value indicates a greater value of information. Hub measures the quality of the node's links by estimating the value of the links outgoing from the node.[34 A higher hub value indicates a greater quality of the node's links.
Modularity
Modularity allows for subgroups of nodes to emerge by applying a community detection algorithm in NA.[35] The cohesion between the various nodes via the relative density of direct linkages, allows for closely interrelated subgroups or communities to be partitioned.[31] A good group (i.e. nodes strongly connected) has a higher density of edges within groups than between groups.[33
Clustering coefficient
The clustering coefficient measures the degree to which nodes in a graph tend to cluster together. Two versions exist: global and local. The global measure gives an overall indication of clustering in the network. The local measure gives an indication of the embeddedness of each node.[36]
Subgroup analysis
We subjected the predetermined subgroups to NA to identify differences between them. We compared measures between admit and refuse decision outcomes and between the different prognoses of case
A and B.
Ethical considerations
Ethical approval of the original study was granted by the Biomedical Research Ethics Committee at the University of KwaZulu-Natal (ref. no. BE 337/18).[6] The data were extracted with all identifying information removed. The dataset used in the study contains no personal identifiers of participants.
Results
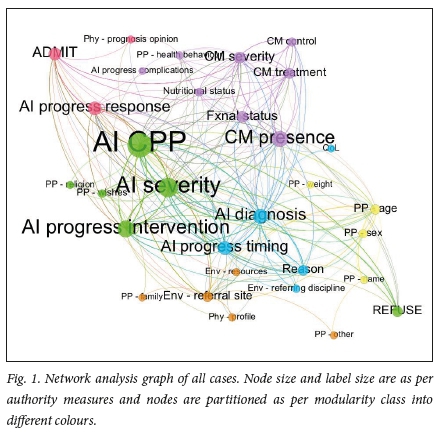
In total, 965 queries were posed by 29 participants across 58 patient cases resulting in a mean (standard deviation (SD)) of 16.64 (6.96) queries per case. A total of 31 nodes and 964 edges were generated from the coding process.
Node and label size were as per authority measures and nodes were partitioned as per modularity class into different colours in all graphs.
NA measures for all nodes and edges of all patient cases considered together are reflected in Table 2. The modularity measure allowed six subgroups to emerge. Graphical representation of the nodes and edges is shown in Fig. 1. Network analyses of predetermined subgroups for admit v. refuse are reflected in Table 3 and Fig. 2 and for case A v. case B in Table 4 and Fig. 3, respectively.
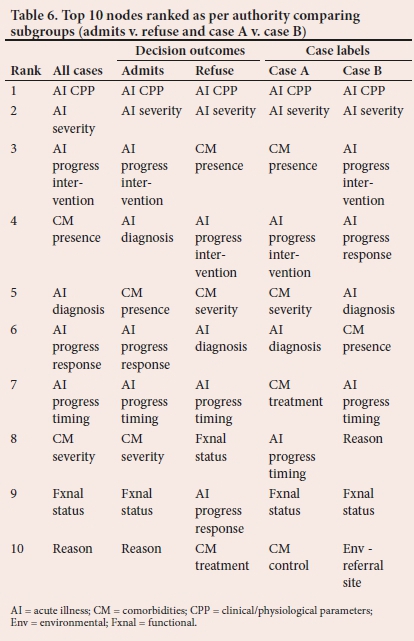
The 10 most important nodes that emerged when ranked against each NA measure for all cases combined are summarised in Table 5 and the 10 most important nodes from each analysis of the subgroups (admit v. refuse and case A v. case B) when ranked by authority are shown in Table 6. The admit and refuse nodes were excluded from the rankings as they were seen as final decision outcomes (Tables 5 and 6).
Discussion
To our knowledge, this is the first study to use NA to explore ICU admission decisions to identify key factors, their distribution, connection and relative importance. We were only able to do this as a result of data generated from a previous study that used the 20-questions game.[6]
Assumptions are mandatory for modelling. We chose to use directed graphs as queries in the 20-questions game were thought to be sequential as part of the participants' deductive reasoning. Questioning during referrals often appears to be directed even though the thought process may be more complex. An argument may thus be made for undirected networks. This was verified by separately running the analysis for all cases as an undirected network and similar factors emerged as the most important. The absence of an edge from the last node of a participant's first case and the first node of the second case, may also be questioned as one decision-making process, invariably affecting the subsequent node.[37,38] We, however, considered it better to view the cases separately as we had attempted to create a clear break between the cases during the interviews in the 20-questions study[16]
We sought to describe two main issues: (i) the relative importance of the nodes (emergent factors); and (ii) their relationship/connection with each other. The best measures to evaluate these two issues remain controversial. As no single measure may be considered ideal to establish the relative importance of nodes, we ran the analysis using measures of centrality prestige, authority and hubs. Regardless of the measure used, properties of the acute illness (diagnosis, severity, and clinical and physiological parameters (CPP)), progress of the acute illness (intervention/ response/timing) and properties of comorbidities (presence and severity) appeared consistently. However, the relative rankings of these factors differed. In addition, functional status and patient age variably emerged in four of the six measures. It was unsurprising that patients' functional status (defined by activities of daily living) emerged as important, as it has been previously found to impact admission decisions in traditional studies in the field describing frequencies.[39-41] The emergence of age as an important factor is controversial. A recent review was inconclusive, with some studies contradicting others that found patient age to be significant, with the suggestion that physiological age or an assessment of frailty, may be more important than chronological age.[42] The referral site emerged as an important factor when harmonic closeness centrality and betweenness centrality was used. The reason for admission emerged only when authority and hub were used. The patient name emerged as important only when betweenness centrality was used. This may have emerged as an important node, as it is often sought by receiving practitioners for administrative purposes and is often asked out of habit. Overall, using various measures identified different factors as important,
The 10 most common factors emerging from the previously conducted frequency analysis study[6] are also reflected in Table 5. Differences are noted with each NA measure in terms of the emergent factors (nodes) and their relative rankings. Of the six measures used, the hub list most closely resembles the frequency list, with the same 10 nodes emerging with a minor change in their relative ranking. It may thus be recommended that in analyses such as these, multiple measures of node importance must be utilised.
Modularity was used to describe relationships among nodes with six communities emerging (Table 2). The communities bear little resemblance to the various groups of codes in Table 1. The implication of this is that the nodes within a community are more tightly connected to each other than with nodes outside the community. The PP factors are widely distributed among the communities, with patient's age, sex, weight and name in Community 4 and patient wishes and religion in Community 2. This may suggest that the way factors (nodes) have been traditionally subgrouped (Table 1) may need to be reconsidered, with different subgroups/communities being partitioned to better reflect the connection of these nodes in the thought processes of decision makers rather than in classic algorithms.
The secondary aim was to compare subgroups as per decision outcomes (admit v. refuse) and case labels (case A v. case B) (Table 6). The admit and refuse subgroups were largely similar in respect of the 10 most important nodes ranked by authority, with only the reason for admission being replaced by comorbidity treatment. The relative rankings of the nodes were considered to be only slightly different. In the complete list of nodes for each subgroup, 5 nodes (AI progress complications, env resources, physician profile, PP family, QoL) appeared exclusively in the admit subgroup, while PP other, PP religion, PP weight were exclusively in the refuse subgroup (Table 3). The admit subgroup was partitioned into 6 communities and the refuse subgroup into 7 communities, with nodes differentially associated. The significance of the above differences, while not totally clear, may suggest that the thought processes for the two decision outcomes may be different. In the 20-questions study analysis, a longer time taken for refusals was noted, with no significant differences in the number of queries and questions.[6]
Three of the 10 most important nodes (ranked by authority) were entirely different between case A and case B by comparing NA (Table 6). Three nodes (env referring discipline, env resources, PP weight) appeared exclusively in the case A subgroup while 5 (AI progress complications, PP family, PP other, PP religion, QoL) appeared exclusively in the case B subgroup in the complete list of nodes (Table 4). Case A subgroup was partitioned into 5 communities and the case B subgroup was partitioned into 8 communities with nodes differentially associated. In contrast, no significant differences were found between the subgroups in the 20-questions study.[6]
Study limitations
The main limitation of this study was the relatively small dataset of 965 queries. However, as such an analysis has not been previously conducted in this context, we opted to use the available data for analysis. Further, we used data that were extracted from a previous study.[6] The novel use of the 20-questions game approach[6] as a method to collect data has not been validated. Such an artificial construct may be different from the clinical setting, where a large amount of standardised information would be routinely provided. The assumption that the decision-making process will be similar in both circumstances may thus be questioned. Additionally, the assumption that questions were posed sequentially may also be questioned, as thought processes involved in decision-making may not necessarily follow sequentially. Nevertheless, we opted to test if the comparison could potentially reveal insights into the decision-making process, accepting that any results would need to be interpreted with caution.
An additional limitation of this study is the generalisability of the results as the extracted data were limited to one local group of practitioners, whose admission decision thought processes may be contextual. Assumptions needed to allow for modelling may also act as limitations. Furthermore, the analysis was subject to the algorithms of the Gephi software.[27] Different software packages may have variations in how some of the analyses are conducted.
Finally, although the results of the study yield important information regarding patient data required for admission decision-making, it is important to note that this is only one aspect of a complex admission decision-making process. Other aspects contributing to the admission decision-making process should be explored using non-traditional research approaches.
Conclusion
To better describe and analyse the complex ICU admission decision process, exploration of novel techniques is warranted so that the importance and interrelationships of contributory factors are more clearly delineated. The use of network analysis with its various measures has facilitated a more comprehensive exploration of the ICU admission decision, allowing us to reflect on this often difficult, high-stakes, high-stress and time-sensitive process. Further studies with larger datasets are needed to better elucidate the exact role of network analysis in decision-making processes.
Declaration. None.
Acknowledgements. None.
Author contributions. PDG and SP contributed equally.
Funding. None.
Conflicts of interest. None.
References
1. Evans JS, Over DE, Manktelow KI. Reasoning, decision-making and rationality. Cognition 1993;49(1-2):165-187. https://doi.org/10.1016/0010-0277(93)90039-x [ Links ]
2. Baker D, Bridges D, Hunter R, et al. Guidebook to decision-making methods. Department of Energy, USA, 2002. http://emiweb.inel.gov/Nissmg/Guidebook_2002.pdf (accessed 25 September 2017). [ Links ]
3. Harris R. Introduction to decision-making. 2012. VirtualSalt. http://www.virtualsalt.com/crebook5.htm (accessed 25 September 2017). [ Links ]
4. Hansson SO. Decision-making under great uncertainty. Philos Soc Sci 1996;26(3):369-386. https://doi.org/10.1177/004839319602600304 [ Links ]
5. Starcke K, Brand M. Decision-making under stress: A selective review. Neurosci and Biobehavio Rev 2012;36(4):1228-1248. https://doi.org/10.1016/j.neubiorev.2012.02.003 [ Links ]
6. Gopalan PD, Pershad S, Pillay BJ. Decision-making in ICU: An analysis of the ICU admission decision-making process using a '20 questions' approach. S Afr J Crit Care 2020;36(1):28-34. https://doi.org/10.7196/SAJCC.2020.v36i1.398 [ Links ]
7. Walsworth MT. Twenty questions: A short treatise on the game to which are added a code of rules and specimen games for the use of beginners. New York: Holt, 1882:1-40. [ Links ]
8. Ashby WR. An introduction to cybernetics. London: Chapman & Hall Ltd, 1956:202-216. [ Links ]
9. Tversky A, Kahneman D. The framing of decisions and psychology of choice. Science 1981;211(4481):453-558. https://doi.org/10.1126/science.7455683 [ Links ]
10. The Operational Research Society. What is Operational Research? https://www.theorsociety.com/about-or/ (accessed 10 November 2020). [ Links ]
11. Borgatti SP, Mehra A, Brass DJ, Labianca G. Network analysis in the social sciences. Science 2009;323(5916):892-895. https://doi.org/10.1126/science.1165821 [ Links ]
12. Glen S. Queuing theory: Simple definition, notation and terminology. Statistics How To. https://www.statisticshowto.com/queuing-theory/ (accessed 7 July 2019). [ Links ]
13. Myerson RB. Game theory - analysis of conflict. Cambridge: Harvard University Press, 1991. [ Links ]
14. Biggs N, Lloyd E, Wilson R. Graph theory, 1736-1936. Oxford: Clarendon Press, 1998. [ Links ]
15. Song MG, Yeo GT. Analysis of the air transport network characteristics of major airports. Asian J Shipp Logist 2017;33(3):117-125. https://doi.org/10.1016/j.ajsl.2017.09.002 [ Links ]
16. Mutoh A, Imura Y, Kato R, Matsui T, Inuzuka N. A model of friendship networks based on social network analysis. Artif Life Robot 2016;21(2):165-170. https://doi.org/10.1007/s10015-016-0275-8 [ Links ]
17. Lee P, Su H. Investigating the structure of regional innovation system research through keyword co-occurrence and social network analysis. Innovation 2010;12(1):26-40. https://doi.org/10.5172/impp.12.1.26 [ Links ]
18. Chambers D, Wilson P, Thompson C, Harden M. Social network analysis in healthcare settings: A systematic scoping review. PLoS ONE 2012;7(8):e41911. https://doi.org/10.1371/journal.pone.0041911 [ Links ]
19. Melak T, Gakkhar S. Comparative genome and network centrality analysis to identify drug targets of Mycobacterium tuberculosis H37Rv. BioMed Res Int 2015;212061:1-10. https://doi.org/10.1155/2015/212061 [ Links ]
20. Franchini M, Pieroni S, Fortunato L, Knezevic T, Liebman M, Molinaro S. Integrated information for integrated care in the general practice setting in Italy: Using social network analysis to go beyond the diagnosis of frailty in the elderly. Clin Transl Med 2016;5(1):24. https://doi.org/10.1186/s40169-016-0105-6 [ Links ]
21. Moss J, Elias B. Information networks in intensive care: A network analysis of information exchange patterns. AMIA Annu Symp Proc 2010;2010:522-526. [ Links ]
22. Benham-Hutchins MM, Effken JA. Multi-professional patterns and methods of communication during patient handoffs. Int J Med Inform 2010;79(4):252-267. https://doi.org/10.1016/j.ijmedinf.2009.12.005 [ Links ]
23. Son Y-J, Lee, S-K, Nam SJ, Shim JL. Exploring research topics and trends in nursing-related communication in intensive care units using social network analysis. Comput Inform Nurs 2018;36(8):383-392. https://doi.org/10.1097/cin.0000000000000444 [ Links ]
24. Nooraie RY, Lohfeld L, Marin A, Hanneman R, Dobbins M. Informing the implementation of evidence informed decision-making interventions using a social network analysis perspective: A mixed-methods study. BMC Health Serv Res 2017;17(1):122. https://doi.org/10.1186/s12913-017-2067-9 [ Links ]
25. Minati L, Grisoli M, Seth AK, Critchley HD. Decision-making under risk: A graph-based network analysis using functional MRI. Neuro Image 2012;60(4):2191-2205. https://doi.org/10.1016/j-neuroimage.2012.02.048 [ Links ]
26. Moon M. Identifying nursing diagnosis patterns in three intensive care units using network analysis. Int J Nurs Knowl 2018;30(3):137-146. https://doi.org/10.1111/2047-3095.12226 [ Links ]
27. Gephi. https://gephi.org/users/download/ (accessed 25 February 2019). [ Links ]
28. Kim BJ, Park HG, Chung JB. Social network analysis of the Korean disaster-safety industry Disaster Prev Manag 2018;27(1):28-42. https://doi.org/10.1108/dpm-08-2017-0212 [ Links ]
29. Basics of social network analysis. https://us.sagepub.com/sites/default/files/upm-binaries/78651_Chapter_1.pdf (accessed 12 May 2019). [ Links ]
30. Newman MEJ. Networks. An introduction. 1st ed. Oxford: Oxford University Press, 2010. [ Links ]
31. Kim Y, Choi TY, Yan T, Dooley K. Structural investigation of supply networks: A social network analysis approach. J Oper Manag 2011;29(3):194-211. https://doi.org/10.1016/j.jom.2010.11.001 [ Links ]
32. Wasserman S, Faust K. Social network analysis: Methods and applications. Cambridge, England: Cambridge University Press, 1994. [ Links ]
33. The harmonic centrality algorithm. https://neo4j.com/docs/graph-algorithms/current/algorithms/harmonic-centrality/ (accessed 12 May 2019). [ Links ]
34. Kleinberg J. Authoritative sources in a hyperlinked environment. JACM 1999;46(5):604-632. https://doi.org/10.1145/324133.324140 [ Links ]
35. Blondel VD, Guillaume J-L, Lambiotte R, Lefebvre E. Fast unfolding of communities in large networks. J Stat Mech 2008;P10008. https://doi.org/10.1088/1742-5468/2008/10/p10008 [ Links ]
36. Masuda N, Sakaki M, Ezaki T, Watanabe T. Clustering coefficients for correlation networks. Front Neuroinform 2018;12:7. https://doi.org/10.3389/fninf.2018.00007 [ Links ]
37. Raeva D, van Dijk E, Zeelenberg M. How comparing decision outcomes affects subsequent decisions: The carry-over of a comparative mind-set. Judgm Decis Mak 2011;6(4):343-350. https://journal.sjdm.org/11/101216/jdm101216.pdf [ Links ]
38. Xu AJ, Wyer RS Jr. The comparative mind-set: From animal comparisons to increased purchase intentions. Psychol Sci 2008;19(9):859-864. https://doi.org/10.1111/j.14679280.2008.02169.x [ Links ]
39. Escher M, Perneger TV, Chevrolet J-C. National questionnaire survey on what influences doctors' decisions about admission to intensive care. Br Med J 2004;329(7463):425-429. https://doi.org/10.1136/bmj.329.7463.425 [ Links ]
40. Garrouste-Orgeas M, Tabah A, Vesin A, et al. The ETHICA study (part II): Simulation study of determinants and variability of ICU physician decisions in patients aged 80 or over. Intensive Care Med 2013;39(9):1574-1583. https://doi.org/10.1007/s00134-013-2977-x [ Links ]
41. Ramos JGR, Perondi B, Dias RD, et al. Development of an algorithm to aid triage decisions for intensive care unit admission: A clinical vignette and retrospective cohort study. Crit Care 2016;20:81. https://doi.org/10.1186/s13054-016-1262-0 [ Links ]
42. Gopalan PD, Pershad S. Decision-making in ICU - a systematic review of factors considered important by ICU clinician decision makers with regard to ICU triage decisions. J Crit Care 2019;50:99-110. https://doi.org/10.1016/j.jcrc.2018.11.027 [ Links ]
 Correspondence:
P D Gopalan
gopalan@ukzn.ac.za
Accepted 19 January 2021
Contribution of the study. We performed a novel analysis of a complex decision-making process that allowed for comparison with traditional analytic methods. It allowed for identification of key factors, their distribution, connection and relative importance. This may subsequently allow for reflection on difficult decision-making processes, thereby leading to more appropriate outcomes. Moreover, this may lead to new considerations in developing decision support systems such as the formulation of pro-forma data-capture tools (e.g. referral forms). Further, the way factors have been traditionally subgrouped may need to be reconsidered, with different subgroups being partitioned to better reflect their connection. This study offers a good basis for more advanced future studies in this area to use a new variety of analytical tools.

