


Services on Demand
Article
 English (pdf)
 Article in xml format
 Article references
Indicators

Related links
-
 Cited by Google
 -
 Similars in Google
Share

 Permalink
Southern African Journal of Critical Care (Online)
On-line version ISSN 2078-676X
Print version ISSN 1562-8264
South. Afr. j. crit. care (Online) vol.30 n.1 Pretoria Aug. 2014
http://dx.doi.org/10.7196/SAJCC.166
ARTICLES
Paediatric Index of Mortality scores: An evaluation of function in the paediatric intensive care unit of the Red Cross War Memorial Children's Hospital
L J SolomonI; B M MorrowII; A C ArgentII, III
IMMed (Paed), Cert. Critical Care (SA) (Paed); Department of Paediatrics and Child Health and Paediatric Intensive Care Unit, School of Medicine, Faculty of Health Sciences, University of the Free State, and Universitas Academic Hospital, Bloemfontein, South Africa
IIPhD; Division of Paediatric Critical Care and Children's Heart Disease, School of Child and Adolescent Health, University of Cape Town, South Africa
IIIMD, FCPaed (SA); Paediatric Intensive Care Unit, Red Cross War Memorial Children's Hospital, Cape Town, South Africa
ABSTRACT
BACKGROUND: Paediatric Index of Mortality (PIM) and PIM 2 scores have been shown to be valid predictors of outcome among paediatric intensive care unit populations in the UK, New Zealand, Australia and Europe, but have never been evaluated in the South African context.
OBJECTIVE. To evaluate the PIM and PIM 2 as mortality risk assessment models.
METHOD: A retrospective audit of case records and prospectively collected patient data from all admissions to the Paediatric Intensive Care Unit (PICU) of Red Cross War Memorial Children's Hospital, Cape Town, during the years 2000 (PIM) and 2006 (PIM 2), excluding premature infants, children who died within 2 hours of admission, or children transferred to other PICUs.
RESULTS: For PIM and PIM 2 there were 128/962 (13.3%) and 123/1113 (11.05%) PICU deaths with expected mean mortality rates of 12.14% and 12.39%, yielding standardised mortality risk ratios (SMRs) of 1.1 (95% confidence interval (CI) 0.93 - 1.34) and 0.9 (95% CI 0.74 - 1.06), respectively. Receiver operating characteristic analysis revealed area under the curve of 0.849 (PIM) and 0.841 (PIM 2). Hosmer-Lemeshow goodness of fit revealed poor calibration for PIM (χ2=19.74; p=0.02) and acceptable calibration for PIM 2 (χ2=10.06; p=0.35). SMR for age and diagnostic subgroups for both scores fell within wide confidence intervals.
CONCLUSION: Both scores showed good overall discrimination. PIM showed poor calibration. For PIM 2 both discrimination and calibration were comparable to the score derivation units, at the time of data collection for each. Calibration in terms of age and diagnostic categories was not validated by this study.
In order to assesstne quality of care offered by paediatric intensive care units (PICUs), it is important to measurenowwe they perform at their core function, namely preventing death in critically ill or injured children. To facilitate this, it is necessary to measure the risk of dying in PICU for all children admitted to PICU. A variety of mortality risk assessment scores have been devised, of which the most commonly used are the Paediatric Risk of Mortality (PRISM)[1] and the Paediatric Index of Mortality (PIM)[2] scores and their derivatives.These scores have been derived in specific populations over specific periods of time. Before these scores can be applied in different environments, it is important to evaluate their performance. They need to be demonstrated to perform well across a wide variety of mortality risk categories and in different 'case mix' scenarios. The PIM[2] and the updated PIM 2[3] scores are validated mortality risk assessment scores that have been evaluated outside oftheir derivation environments (UK, Australia and New Zealand)[4-6] but not in South Africa (SA).
The Red Cross War Memorial Children's Hospital (RCWMCH) is the only children's hospital in sub-Saharan Africa that provides tertiary and quaternary services exclusively for children. The intensive care unit (ICU) has a turnover of between 1 100 and 1 200 children per annum.
The PIM was introduced as a mortality risk assessment model at RCWMCH in January 2000 and used until 2003, when the PIM 2 was introduced and subsequently used. This, therefore, represented an ideal setting in which to evaluate these scores.
The objective of this study was to evaluate the utility of the PIM and PIM 2 as PICU mortality risk assessment models in the RCWMCH and to compare the population characteristics of the RCWMCH PICU with those of the units in which they were derived.
Method
Setting
The RCWMCH is a tertiary academic hospital with a multidisciplinary PICU, which, together with the PICU at Tygerberg Hospital (which admits medical emergencies and some elective surgical patients), offers care to all children needing intensive care in the public health system of the Western Cape Province of SA. It also serves as a national referral centre for services such as organ transplantation.
Population
This was a retrospective audit of case records and patient data kept on an electronic database (MS Access) of all children admitted to the PICU during 2 calendar years: 2000 for PIM, and 2006 for PIM 2. We included all children admitted to PICU during the above time periods. We excluded premature infants, children who died within 2 hours of ICU admission and transfers to other ICUs. Data collection was done during the year 2007. Only deaths in the PICU were recorded, and no patient deemed to have a poor prognosis was discharged to the ward for terminal care.
Data collection
The abovementioned database, designed and maintained by the lead intensivist at RCWMCH, was used prospectively to record data from each admission to the PICU. For each admission, demographic, clinical and outcome data were recorded, which included data necessary for the calculation of the PIM or PIM 2 scores. The data were typically entered by the registrar responsible for admission of any child to the PICU. At the end of a child's ICU stay, a summary was prepared by the discharging registrar, and outcome data recorded in terms of PICU survival or mortality. The integrity of the data in the database was checked by the attending intensivist consultants on a regular basis.
For both scores, the following data for each patient admission were extracted from database and entered into a spreadsheet (MS Excel): demographic data, diagnostic category, outcome (PICU mortality or survival), length of PICU stay and risk of mortality score.
For records that were missing data needed for PIM or PIM 2 calculation, the associated medical records (files) were accessed and the necessary data were retrieved. Similarly, suspected erroneous data on the database were cross-checked with patient medical records and corrected on the spreadsheet when necessary.
Data analysis
A chart review of 20 randomly selected records for each period was done to control for inter-rater bias. Randomly selected records, stratified by mortality risk, were reviewed and PIM and PIM 2 scores were recalculated by two different raters. The difference in probability of death as calculated from rater-chosen PIM and PIM 2 variables was plotted against the mean probability using the Bland Altman tech-nique.[7] The mean difference in probability represented the bias in predicting mortality attributable to data collection errors. Limits of agreement between the raters, and 95% confidence interval (CI) for bias and upper and lower limits of agreement were calculated to determine the accuracy of the estimates of agreement between the raters.
Descriptive statistics were determined for the PICU population as a whole, and then for both diagnostic and age categories. Performance of the scores was assessed in terms of discrimination (receiver operating characteristic (ROC) analysis) and calibration (Hosmer-Lemeshow test) for the PICU population as a whole.
The performance of the regression equations of these mortality risk assessment scores was tested in terms of discrimination between outcomes, namely PICU death or survival. For this, the area under the (ROC) curve (AUC) - a graph of truly predicted non-survivors v. falsely predicted non-survivors for each value of the score - was determined for the PICU population as a whole. A perfect score would yield an AUC of 1.0 while an AUC of 0.5 would be expected by chance. Discrimination was deemed to be acceptable if the AUC was between 0.70 and 0.79, good if between 0.80 and 0.89, and excellent if AUC was >0.9.[8]
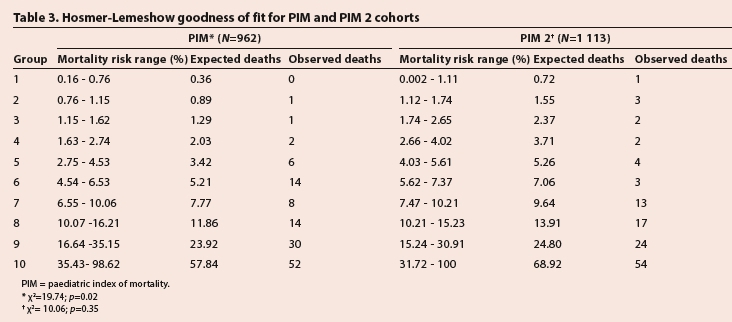
Score calibration was assessed across 10 mortality risk strata, as is commonly determined by the Hosmer-Lemeshow goodness of fit test, which yields a χ2-type statistic and a p-value. Good fit is indicated by p>0.05, while p<0.05 indicates lack of fit.
The standardised mortality risk ratio (SMR) (observed/expected deaths) with 95% CI was determined for the patient population as a whole, and for diagnostic and age categories.
Ethical approval
Full approval was obtained from the Human Research Ethics Committee of the Faculty of Health Sciences, University of Cape Town, SA, before initiating this study (REC ref: 231/2007). Patient confidentiality was maintained throughout. No reference has been made to any patient identification in the reporting of this study. This research adheres to the requirements stated in the Declaration of Helsinki (2008).[9]
Results
Inter-rater bias
For the PIM, inter-rater bias was -0.0013 (95% CI -0.0062 - 0.0036), upper limit of agreement was 0.0198 (95% CI 0.0113 - 0.0284) and lower limit of agreement was -0.0224 (95% CI -0.031 - -0.0138).
For the PIM 2, inter-rater bias was -0.0019. (95% CI -0.0087 -0.0049), the upper limit of agreement was 0.0272 (95% CI 0.0154 - 0.0390) and lower limit of agreement was -0.0310 (95% CI -0.0428 - -0.0192).
Patient characteristics
For the PIM in 2000, there were 962 admissions (561 (58.3%) male; median (range) age 6.5 (0 - 198) months). For the PIM 2 in 2006, there were 1 113 admissions (692 (62%) male; median (range) age 9 (0 - 221) months). Notably, during both periods more than 50% of the population was aged <1 year.
Outcome
PICU deaths were 128 (13.31%) in the PIM cohort and 123 (11.05%) in the PIM 2 cohort. Mean and median (range) mortality risks for the PIM and PIM 2 cohorts were 0.12 and 0.0459 (0.0016 - 0.9862) and 0.1239 and 0.0563 (0.0000 - 1.0000), respectively. Therefore, expected mean mortality rates were 12.14% and 12.39% for the PIM and PIM 2 cohorts, respectively, with respective SMRs of 1.10 (95% CI 0.93 - 1.34) and 0.90 (95% CI 0.74 - 1.06).
PICU length of stay (LOS) for the PIM cohort (data available for 952 patients) ranged from <24 hours to 109 days (one patient) with mean and median LOS of 5.44 and 3 days respectively.
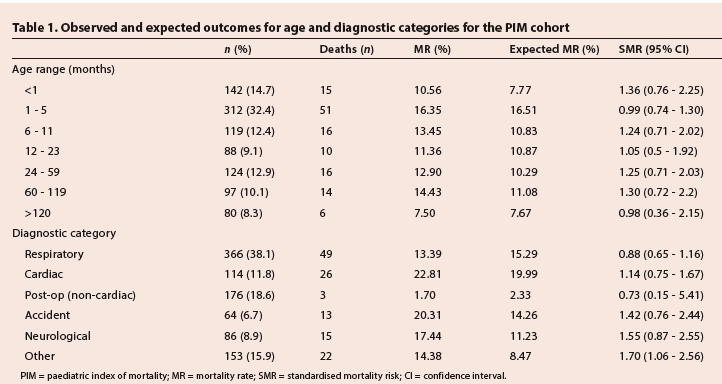
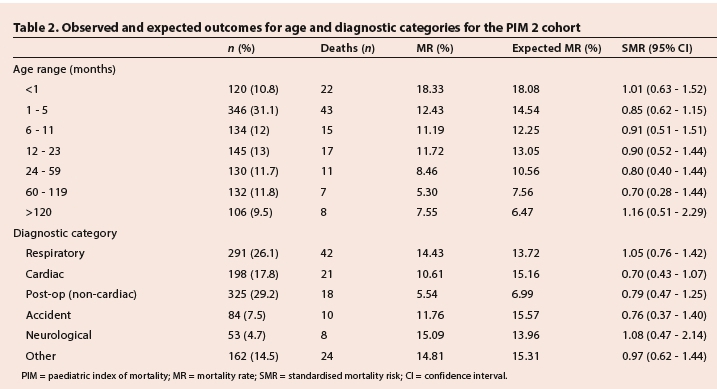
In the PIM 2 cohort, PICU LOS ranged from <24 hours to 324 days (one patient) with mean and median LOS of 4.81 and 2 days respectively. The distribution across age and diagnostic categories, observed and expected outcomes and SMR for each score are presented in Table 1 (PIM) and Table 2 (PIM 2).
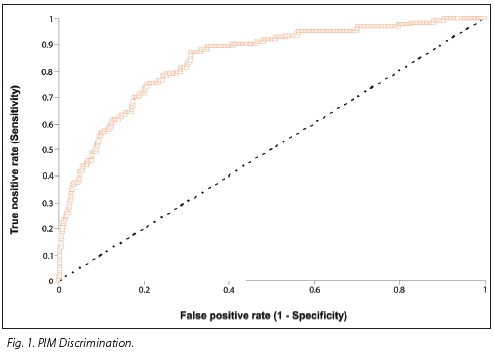
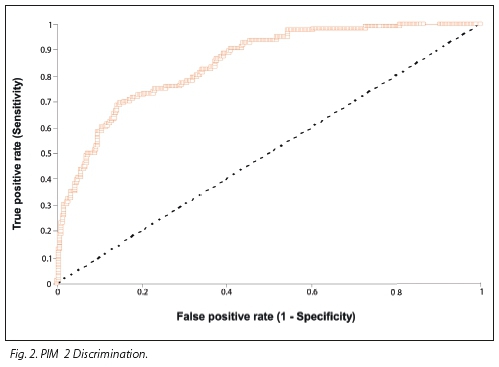
ROC analyses for the PIM and PIM 2 revealed an AUC of 0.849 and 0.841, respectively, indicating good overall discrimination (Figs 1 and 2).
Hosmer-Lemeshow goodness of fit revealed poor calibration for the PIM (χ2=19.74; p=0.02) and good calibration for PIM 2 (χ2= 10.06; p=0.35) across the range of 10 mortality risk strata (Table 3).
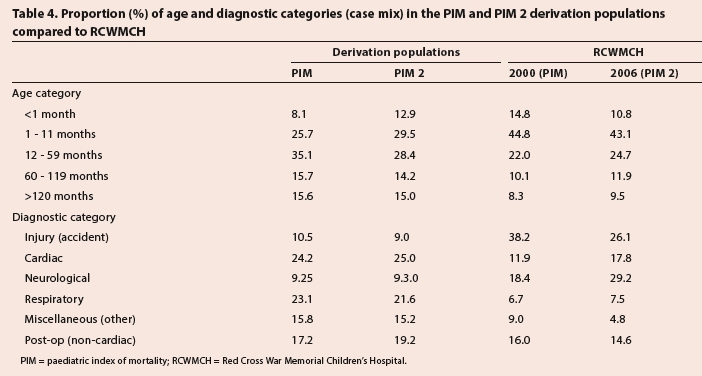
Comparison with derivation units
At the RCWMCH in 2000, the children were generally younger and presented with a greater proportion of injury and neurological diagnostic categories and a smaller proportion of cardiac, respiratory, postoperative and miscellaneous diagnostic categories than the PIM derivation units. In 2006 the RCWMCH unit population was younger than the PIM 2 derivation population with similar proportions of diagnostic categories as in 2000 (Table 4).
Discussion
Mortality risk assessment models can be applied to PICU populations for the purpose of benchmarking quality of care measured in terms of risk-adjusted mortality rates. Although Randolph[10] asserts that using an infrequent event such as death in an ICU may not be the most appropriate approach to measuring quality of care, because morbidity issues and ICU utilisation in terms of LOS are not addressed in this way, these models do give an indication of how well PICUs function at their core purpose, namely preventing death in critically ill children. They provide a standardised way of comparing the performance of ICUs with themselves over time and with national and international benchmarks, and are useful tools to track the level of care across diagnostic groups, though careful thought should be given to calibration within diagnostic subgroups.
These scoring systems do not prognosticate reliably at an individual patient level. They are therefore not accurate enough to be used as screening tools to allow clinicians to decide whether a child is too ill or too well for ICU admission.
PIM and PIM 2 have been found to have good discrimination and calibration in the units in which they were derived,[2,3] however in the UK, only PIM 2, together with PRISM III-12 and PRISM III-24, has been validated.[11] Subsequent single-centre score evaluation studies have had varying results based on locality and case mix.[4-6,12] Single-centre studies have assessed performance of the PIM 2. A study from India[4] was hampered by small numbers and unit-specific issues with regard to quality of care and patient mix, i.e. limited access to adequate nursing and medical staff, a high percentage of underweight and wasted children admitted and no postoperative patients. An Argentinean single-unit study[5] that had greater numbers (approximately 1 500) demonstrated good discrimination, but poor calibration. Calibration was considered adequate after clinical evaluation of the Hosmer-Lemeshow table cells and having taken into consideration the consistent SMR of <1 across categories of risk. However, 95% CIs for SMR were wide. A prospective cohort study from Japan among 2 536 patients admitted to the largest central academic PICU in Tokyo demonstrated a mortality rate of 2.6%, attributed to the high number of low-risk patients admitted. Excellent discrimination and calibration were demonstrated. The SMR for the whole population was 0.77
(95% CI 0.59 - 0.96).[6] A small study from Trinidad and Tobago of 217 patients in ICUs caring for both adults and children found that among children, the PIM 2 did not show good discrimination, with AUC=0.62, a Hosmer-Lemeshow p-value of 0.69, which showed good fit, and a lower observed mortality rate (30%) than expected (34%).[12]
The population characteristics of the PIM and PIM 2 derivation units are shown in Table 4. The age and diagnostic category distribution remained similar between the periods of study for the PIM and PIM 2 derivation units. It is not clear from the original reports of the PIM or PIM 2 what the proportion of emergency v. elective admissions was, what the nutritional status of the patients was on admission or what the incidence of HIV infection was; however, at the time and units of the derivation of these scoring systems, the incidence of HIV infection among children was low. The low HIV prevalence among score derivation populations needs to be considered when these scores are applied in areas of high prevalence of communicable disease, HIV, malnutrition and trauma, as in SA.
The performance of any PICU in which these scores are applied has often been determined by the SMR, which compares the actual number of deaths in the PICU to the number of score-predicted deaths as a ratio of observed/expected deaths. Care provided in the unit in which the score is applied is deemed to be better (SMR <1) or worse (SMR >1) than the units in which it was derived, at the time that it was derived. Ninety-five per cent CIs for an SMR must be narrow for it to be of any significant value. This depends on the number of recorded deaths. Ninety five per cent CIs will be wide if <50 deaths are recorded.[8] The results of this study showed that both the PIM and PIM 2 performed well in terms of discrimination, but that calibration was better for the PIM 2. However, when we assessed the SMR and 95% CI as applied to age and diagnostic categories, there was no consistent SMR, and particularly for the PIM, the 95% CI were wide. This related to the few deaths recorded per category. For SMR estimates to be accurate, i.e. within a 95% CI range of 0.2 around the estimate, about 200 deaths per sample need to be recorded, since the width of the 95% CI for the SMR varies with the reciprocal of the square root of the number of deaths (personal correspondence with F Shann, 1 April 2012).
Overall, SMR estimates for both the PIM and PIM 2 fell within 95% CI ranges that were wider than 0.2. This means that the apparent parity of quality of care offered by the RCWMCH PICU, and the PIM and PIM 2 derivation populations need to be confirmed by larger data sets. Very wide 95% CIs across the diagnostic and age subgroups for the SMR made a statistically meaningful comparison between observed v. actual deaths in each subcategory difficult. The PIM and PIM 2 performance in these subcategories could therefore not be assessed from these limited data.
The limited timeframe for data collection represents a weakness of this study. A larger study over a longer period of time in this PICU would yield better estimates of SMR for the PIM 2. If this confirms the SMR <1 within a 95% CI range of <0.2 around the estimate, then the PIM 2 may need to be recalibrated in this setting. However, a recalibrated score would no longer be useful for benchmarking against the original derivation population. It would, however, set a standard for this unit in order to track its risk-adjusted mortality-based quality of care assessment over time.
The inter-rater bias assessments for the data under study showed reasonable inter-rater agreement for the PIM, and wider limits of agreement for the PIM 2. Nevertheless, for the PIM 2 this means that raters agreed with an average difference in mortality risk of 0.2%, the limits of agreement being about 3% on either side of this mean difference. The PIM 2 sample had one outlier out of 20, most likely due to different data chosen by the raters for the calculation of mortality risk for that outlier. If extrapolated to the daily application of the score, it may mean a potential variance of 3% above or below the mean risk of mortality for the population. Therefore for the PIM 2, the SMR estimate would range between 0.72 and 1.77, a larger range than the 95% CI for the PIM 2 SMR (0.74 - 1.06).
Training for those applying the score is important, as borne out by a Dutch study[13] that demonstrated better inter-rater agreement after a specific period of training than before, among a group of intensive-care practitioners that included intensivists, fellows and residents. In this study, however, no specific training was offered for the application of the PIM or PIM 2 in the PICU under study, though instructions for use were available. The inter-rater bias demonstrated for the PIM 2 bears this out as a potential weakness of this study.
This study did not compare the two scores with each other over the same period of time, so it is not possible to comment about the comparative utility of these scores at the RCWMCH PICU during any time period.
If one applies to this study Shann's[8] suggestion that a scoring system is appropriate in any unit if ROC AUC >0.7 and similar numbers of observed v. expected rates are found across all ten deciles of risk, in terms of ROC AUC and Hosmer-Lemeshow goodness of fit for mortality risk deciles, the PIM 2 is appropriate for use in this context.
The PIM showed poor goodness of fit. It should be borne in mind, however, that score calibration as determined by Hosmer-Lemeshow goodness of fit is affected by the numbers of subjects in each decile of risk, such that poor calibration will be seen with smaller numbers in each risk decile. This characteristic of the Hosmer-Lemeshow test applied to the RCWMCH populations in this study may contribute to the difference in calibration of the PIM and PIM 2 compared with the much larger derivation populations.
Conclusions
Both the PIM and PIM 2 performed reasonably well as discriminators of death v. survival in the RCWMCH PICU. Our findings were comparable to the Argentinian study[5] quoted, and the setting similar, at least in terms of resource availability. Calibration across mortality risk strata for the PIM 2 was good. For age and diagnostic subcategories, the 95% CI for the SMR was wide, and therefore one cannot interpret the SMR for age and diagnostic groups.
This study has found the PIM 2 to be an appropriate mortality risk assessment score in the context of an academic PICU in SA. The ease of use and the fact that the regression equation is in the public domain make the PIM 2 an attractive mortality risk assessment tool for resource-constrained environments.
Further studies with larger datasets from this particular PICU, or from multiple PICUs in SA, are needed to evaluate the use of the PIM 2 in the SA context, also in terms of calibration across age and diagnostic categories.
Acknowledgments. Thanks to Prof. G Joubert, head of the Department of Biostatistics at the University of the Free State, for valuable statistical analysis, advice and support, and Prof. F Shann for his critical appraisal of the work on which this paper is based.
References
1. Pollack MM, Ruttimann UE, Getson PR. Pediatric risk of mortality (PRISM) score. Crit Care Med 1988;16(11):1110-1116. [ Links ]
2. Shann F, Pearson G, Slater A, Wilkinson K. Paediatric Index of Mortality (PIM): a mortality prediction model for children in intensive care. Intensive Care Med 1997;23:201-207. [ Links ]
3. Slater A, Shann F, Pearson G. PIM 2: A revised version of the Paediatric Index of Mortality. Intensive Care Med 2003;29:278-285. [http://dx.doi.org/10.1007/s00134-002-1601-2] [ Links ]
4. Thukral A, Lodha R, Irshad M, Arora NK. Performance of Pediatric Risk of Mortality (PRISM), Pediatric Index of Mortality (PIM), and PIM 2 in a pediatric intensive care unit in a developing country. Pediatr Crit Care Med 2006; 7(4):356-361. [http://dx.doi.org/10.1097/01.PCC.0000227105.20897.89] [ Links ]
5. Eulmesekian PG, Pérez A, Minces PG, Ferrero H. Validation of Pediatric Index of Mortality 2 (PIM 2) in a single pediatric intensive care unit of Argentina. Pediatr Crit Care Med 2007;8(1):54-57. [http://dx.doi.org/10.1097/01.pcc.0000256619.78382.93] [ Links ]
6. Imamura T, Nakagawa S, Goldman RD, Fujiwara T. Validation of pediatric index of mortality 2 PIM2) in a single pediatric intensive care unit in Japan. Intensive Care Med 2012;38(4):649-654. [http://dx.doi.org/10.1007/s00134-011-2460-5] [ Links ]
7. Bland JM, Altman DG. Statistical methods for assessing agreement between two methods of clinical measurement. Lancet 1986;1(8476):307-310. [ Links ]
8. Shann F. Are we doing a good job: PRISM, PIM and all that. Intensive Care Med 2002;28(2):105-107. [http://dx.doi.org/10.1007/s00134-001-1186-1] [ Links ]
9. World Medical Association. Declaration of Helsinki: Ethical Principles for Medical Research Involving Human Subjects. Amended by 55th WMA General Assembly. Seoul, South Korea: World Medical Association, October 2008. http://www.wma.net/en/30publications/10policies/b3/17c.pdf (accessed XXX). [ Links ]
10. Randolph AG. Paediatric index of mortality (PIM): Do we need another paediatric mortality prediction score? Intensive Care Med 1997;23(2):141-142. [ Links ]
11. Brady AR, et al. Assessment and optimization of mortality prediction tools for admissions to pediatric intensive care in the United Kingdom. Pediatrics 2006;117(4);e733. [http://dx.doi.org/10.1542/peds.2005-1853] [ Links ]
12. Hariharan S, Merritt-Charles L, Chen D. Risk-adjusted outcome evaluation in a multidisciplinary intensive care unit. West Indian Med J 2007;56(3):240-245. [http://dx.doi.org/10.1590/S0043-31442007000300010] [ Links ]
13. van Keulen JG, Gemke RJ, Polderman KH. Effect of training and strict guidelines on the reliability of risk adjustment systems in paediatric intensive care. Intensive Care Med 2005;31(9):1229-1234. [http://dx.doi.org/10.1007/s00134-005-2716-z] [ Links ]
Correspondence: L J Solomon (solomonlj@ufs.ac.za)

