


Serviços Personalizados
Artigo
 Inglês (pdf)
 Artigo em XML
 Referências do artigo
Indicadores

Links relacionados
-
 Citado por Google
 -
 Similares em Google
Compartilhar

 Permalink
Journal of Energy in Southern Africa
versão On-line ISSN 2413-3051
versão impressa ISSN 1021-447X
J. energy South. Afr. vol.33 no.4 Cape Town Dez. 2022
http://dx.doi.org/10.17159/2413-3051/2022/v33i4a13162
ARTICLES
Trend analysis and inter-annual variability in wind speed in South Africa
M. Chauke*
Energy Centre, Smart Places Cluster, Council for Scientific & Industrial Research (CSIR), Pretoria, South Africa
ABSTRACT
Reliable forecasts of long-term longitudinal wind speed patterns may help predict air circulation changes. They are also essential for the planning and financing of wind projects for Independent Power Producers (IPPs). Long-term wina speed trends and variations in historical mean wind speed data were examined using Mann Kendalls test and calculating inter-annual variability (IA V). The Wind Atlas for South Africa (WASA) provides high resolution quality wind data for research and applications locally. WASA has 19 meteorological stations in South Africa. The WASA project began in 2009 with the aim of mapping South Africa's wind resource, allowing stakeholders in the wind energy sector ana industry to explore and prepare for utility-scale wind power generation. For the past ten years, WASA has been measuring and providing data. The results showed an increasing trend at WM01 and a decreasing trend at WM08. There was no clear trend at other wind masts. Satellite data was used to validate results and no trends were observed at most of the stations. IAV values for this study ranged between 1.088% and 3.353% which is relatively low compared to the commonly found IAV values of 5-6%, implying that mean annual wind speed variation at these stations is low. To confirm a clear trend in wind speed, it is recommended that further work be done with long term periods and substantiate our finding with the use of historical simulation and climate change scenarios.
Keywords: WASA, Wind Analysis, Inter-annual variability, Trend analysis, Mann-Kendells test
Introduction
Despite a worldwide recession and financial crisis, the wind power sector has continued to mature and flourish, demonstrating the technology's fundamental attraction. Wind energy is safe for the environment, dependable, and easily installed. Wind energy is the best modern electricity production technology in the battle against climate change, assisting to enhance energy security, keep electricity costs stable, reduce pollution, and create a large number of high-paying manufacturing jobs. The Global Wind Energy estimate of a 12 percent gain in the wind sector was met with little doubt, showing that wind power is swiftly becoming the best energy technology (Rehman, 2013).
A precise wind analysis is crucial and important to the wind industry since the analysis helps wind industries with their planning and development of wind farms. Trend analysis and inter-annual variability are used to check how wind speed varies from year to year. Although wind seems present everywhere and intermittently throughout the day, wind resources are rarely steady, and fluctuate throughout the day, seasons of the year, year to year, elevation and roughness. Careful and full research should therefore be carried out.
Earlier research shows that the annual mean wind speed varies from year to year but is within 10% of the long-term average (Ko, et al., 2010). Because a 10% difference in the mean wind speed results in a 30% difference in wind energy, it is important to verify variations in the annual a wind mean speed in order to measure wind energy. Trend analysis in historic long-term annual mean wind speed is helpful in knowing whether mean annual wind speed will increase or decrease based on trends detected in historic wind data.
Wright and Grab (2017) did a study on characteristics of wind speed and its implication on wind generation and the Cape region in South Africa using data from the South African Weather Service. In their study they investigated the trend in wind speed as well as inter-annual variability. Out of 19 stations they investigated, only four stations recorded statistically significant trends at the significance level of 0.05. Of these four stations, 75% recorded decreasing trends. When looking at trends in seasonal wind speeds, decreasing trends were recorded in summer and spring and increasing trends were recorded in winter and autumn (Wright & Grab, 2017). The mean inter-annual variability at all 19 stations over period of 20 years was 3.11 % which is relatively low compared the commonly used IAV from previous studies. Behrens and Pullinger (2016) also performed a study on inter-annual variability of wind speed in South Africa. The study was undertaken using a total of 26 ground stations and corresponding MERRA and ERA-I datasets. After screening each of the ground station datasets and restricting the data period, it was found that IAV ranged from 2.0% to 6.6%. An overall country IAV of 4.3% was determined using a mean of all ground station datasets. Overall, concurrent MERRA data was the closest of the two reanalysis datasets in estimating IAV with a mean of 4.0%. MERRA IAV ranged from 2.3% to 6.0% and ERA-I ranged from 2.2% to 4.6%.
Nonetheless, as Behrens and Pullinger (2016) suggested, further work on the topic of IAV should cover the following areas: addition of further data sources in South Africa, especially from long-term tall meteorological masts; the testing of the application of their studys approach to other regions of the world, how long-term weather patterns or recurring climatic events are accounted for in IAV calculations should IAV be considered purely as an uncertainty or should a bias be considered in some cases; further investigation into whether ground stations are representative of wind power project locations which experience greater exposure and higher wind speeds. This paper will endeavour to address the first of the gaps identified by Behrens and Pullinger (2016). The aim of this study is to analyse mean annual wind speed at 19 meteorological masts in the coastal regions as recorded by Wind Atlas of South Africa (WASA).
Data
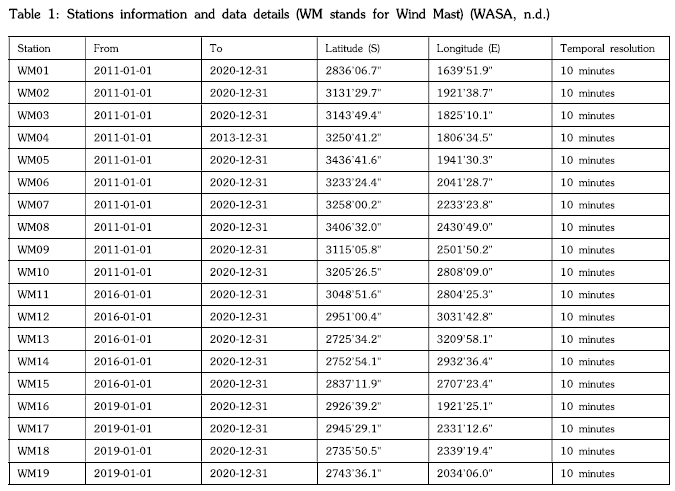
Wind speed data from the Wind Atlas for South Africa (WASA) was used for this study. WASA provided wind data from 19 locations in South Africa. The details and information of wind stations are shown in Table 1. WASA data includes average wind speed, minimum wind speed, maximum wind speed, and wind direction at four different heights, namely: 62m, 60m, 40m and 20m. The WASA project was launched in 2009 with the objective of mapping South African wind resources, which, in turn, will enable stakeholders in the wind energy sector and industry to investigate and plan the for utility-scale exploitation of wind power for electricity generation.
WASA has been collecting data for the past ten years. It has had three project phases, namely: WASA 1, WASA 2 and WASA 3. WASA 1 included ten meteorological stations in Northern Cape, Western Cape and Eastern Cape. WASA 2, phase two of WASA project, included five meteorological stations in KwaZulu-Natal, Free State and Eastern Cape. Currently, WASA is in phase 3 which includes four meteorological stations in north-western part of South Africa. All stations are shown in Figure 1.
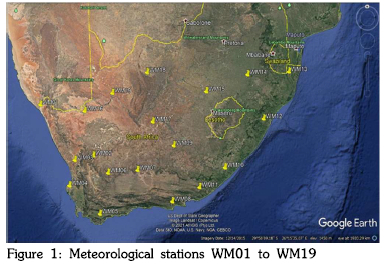
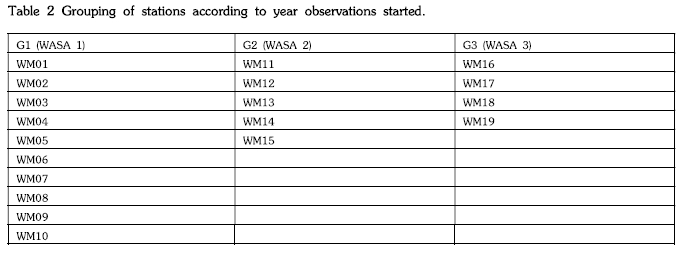
Stations are grouped according to the year in which data observation began at that specific station and number of samples, for accuracy of results. The stations are organized into 3 categories. The first group is Gl, which are part of the WAS A 1 project and encompasses of wind stations where data observation began in 2010 The second G2 group are part of the WASA 2 project and comprises of wind stations where data observation began in 2015. Lastly G3 includes stations that are part of the WASA 3 project. At these stations data observation started in 2018. These groups are shown in Table 2. WM04 will not be considered in the analysis because data recording stopped in 2013 so it only has approximately 2 years of data.
Methodology
A Python tool was used to conduct all the calculations and plot the graphs. The non-parametric Mann-Kendell test was used to detect patterns in mean wind speed. The reason for using the non-parametric Mann-Kendell test is that, in cases of non-normality of distribution, it has been shown to have higher statistical power as it is robust against outliers and missing data. The Mann-Kendell test, however, is unable to provide an estimation of the trend magnitude as it only detects trends (Amadi, 2015). Studies of (Rehman, et al., 2012) and (Amadi, 2015) used linear regression and Sens slope, respectively. The method of linear regression is based on the calculation of the slope of a regression line that matches a collection of data elements (x, y) based on an approximation of least squares. For data elements that do not suit a straight line and are also responsive to outliers, this method is inaccurate. Sens slope is a non-parametric slope estimator and is said to be robust against outliers (Zaiontz, n.d.). The Mann-Kendall test compares time series data values with the preceding values in the sequence. Additionally, the test uses the statistical term Z for n>10, which is defined as follows:
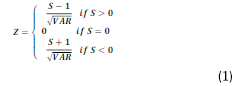
S is the statistical term defined in Equation (2) and VAR is the variance of S as defined in Equation (3). The Z value is used to analyze the frequency of a statistically significant pattern. A positive Z value denotes an upward trend, while a negative Z value denotes a downward trend. The null hypothesis (H_o), which asserts that there is no trend, is rejected if I Z I is greater than the critical Z value, Z_, which is obtained from the cumulative standard normal distribution table. The table can be obtained from Gilbert (Gilbert, 1987). S is the statistical term defined as follows:
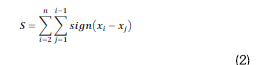
x_i and xj are the sequential data for the i th and j th term, respectively. For n>10, S is approximately normally distributed. S is the result of subtracting the number of positive differences from negative differences. When S is positive, there is an increasing trend and when S is negative, the trend is of decreasing nature. VAR is the variance, and it is defined as:
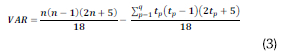
VAR is the variance of S where q is the number of connected groups and t_p is the number of connections to the p th value. For example, in the sequence of measurements in time [33,34,39,5,39,34,34,39,33], the number of connected groups is three for which t_l=2 for a connected value 33, t_2=3 for a connected value 34, and t_3=3 for a connected value 39. For 4nl0, the conclusion of rejecting or accepting the null hypothesis is based on the statistical term S only. If the probability (p-value) at S is less than the significance level, the null hypothesis is rejected and if S is greater than the significance then the null hypothesis is accepted (Rehman, et al., 2012). However, the Mann-Kendells test cannot provide an approximate trend magnitude; it only detects trends. The trend magnitudes are quantified by a Sens slope for a set of pairs (i,x_i ) where x_i is the mean wind speed. Sens slope is defined as follows:
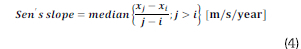
x_i and xj are the sequential data for the i th and j th term, respectively. Sen ' s slope is the magnitude of the trend. The larger the absolute value of the Sens slope, the more obvious the variation trend is. The inter-annual variability (IAV) of mean wind speed gives confidence in the long-term availability of wind intensity and thus helps to obtain reliable wind energy estimates from wind turbines. IAV is a calculation of the degree to which wind speeds differ yearly (Behrens & Pullinger, 2016). IAV is specified as the standard deviation over several years of annual mean wind speed and is usually represented as a percentage. The variance in wind speeds is proportional to the variance in energy yield, and the IAV value is therefore a significant input for a wind farm to determine confidence in an energy yield forecast (Behrens & Pullinger, 2016).
The IAV of wind speed is calculated using calendar years and is defined as the ratio of the annual mean wind speed standard deviation to the mean long term wind speed. It is calculated as follows:
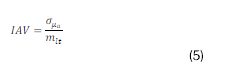
where:
σμa - annual mean wind speeds standard deviation
Mlt= long-term mean wind speed
Results and discussion
The findings of this study could be useful for wind energy industry stakeholders, including analysts of wind resources, developers, owners, operators, meteorologists, research institutes, and financial investors. Wind speed at the height of 62m was used because is the maximum height and the objective is to get as close to the turbine hub heights as possible. Only Gl and G2 data were used for trend analysis and IAV calculations because the term is greater than four. 10-year and 5-year time periods are not sufficient to establish conclusive changes in wind speeds (particular from the long-term climate variability regime shift or climate change perspective), but the record can still provide a preliminary assessment of the data sets and indicate mean wind speed variance and trends over the last 10 and 5 years. Wind speed statistics
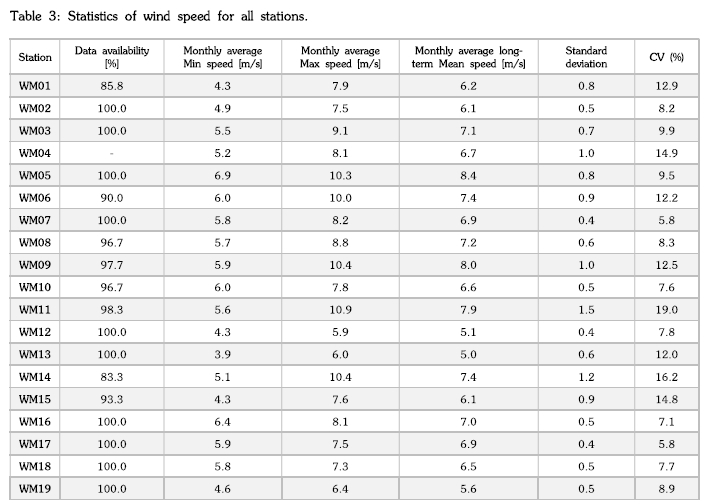
The long-term average, maximum, standard deviation and coefficient of variation (CV) values of wind speed for Gl, G2 and G3 stations are summarized in Table 3. CV is a statistical estimate of the distribution of data points across the mean in a data sequence. CV is the ratio of the standard deviation to the mean, and it is a useful metric for comparing the degree of variation from one data series to another, even though the means vary significantly from each other (Hayes, 2021).
From Table 3, it is evident that the CV varies considerably with location. CV values across stations are low compared to those found in the study of (Krakauer, 2017). Low CV indicates low wind speed variability. Across all 19 stations, CV value ranged between 5.8% and 19%, where the lowest was recorded at WM07 and WM17and the highest at WM11. The windiest stations are WM05, WM09 and WMllwith annual mean wind speed of 8.4 m/s, 7.9 m/s, and 8.0 m/s, respectively. Low annual mean wind speed is recorded at WM12 and WM13 with mean wind speed of 5.1 m/s and 5 m/s, respectively. There are variety of possible triggers varying from orographic and topographic characteristics as to why wind speed varies from station to station. Data availability at WM01, WM06, WM08, WM09, WM10, WM11, WM14 and WM15 is not 100%. There are months where data was not available. Data for these months where data was missing, was removed from other stations to guarantee the same number of samples and accuracy of the results.
Annual trends
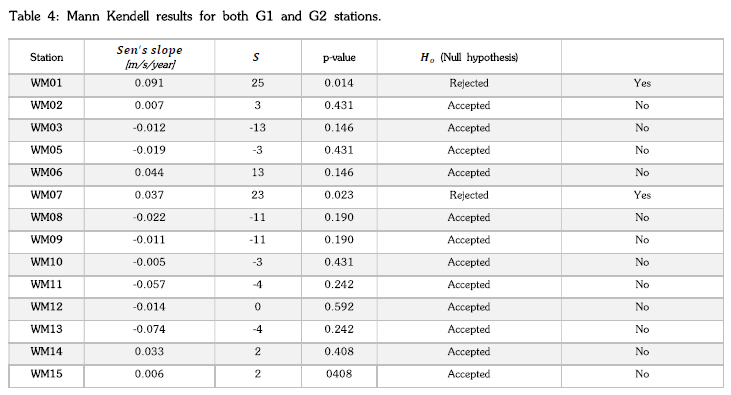
Annual trends in wind speed were examined using the Mann-Kendall test and graphs. The Mann-Kendalls results, for both Gl and G2 stations, are shown in Table 4. Annual trends in annual mean wind speed at G3 stations were not performed because G3 stations have two complete years of data, yet the Mann-Kendalls test requires a minimum of four complete years. WM04 was also not considered as it has only two complete years. Inter-annual variability will also not be done for these stations. If null hypothesis is rejected, then there is an annual trend. The significance level describes how much proof we need to reject the null hypothesis in favour of the alternative hypothesis. For research, the default commonly used significance level is 0.05. Thus, significance level of 0.05 was used. The term for both Gl and G2 is less than ten so the statistical term S was used to detect trends.
From Table 4, it is evident that a significant annual trend exists at WM01 and WM07 because the p-value is less than 0.05 and therefore the null hypothesis is rejected. Both at WM01 and WM07, an increasing trend is detected. The magnitudes at which wind speed changes annually are also shown in Table 4. These magnitudes are small, showing that the mean wind speeds across these stations do not vary much from year to year. About 57% of stations recorded mean decreasing wind speed ranging from -0.005 m/s/year to -0.074 m/s/year where the smallest is recorded at WM10 and largest at WM13. The remaining stations (43% of the stations) recorded mean increasing wind speed ranging from 0.006 m/s/year to 0.091 m/s/year where the smallest is recorded at WM15 and largest at WM01. The Mann Kendells results are validated by graphs shown in figure 2 and 3.
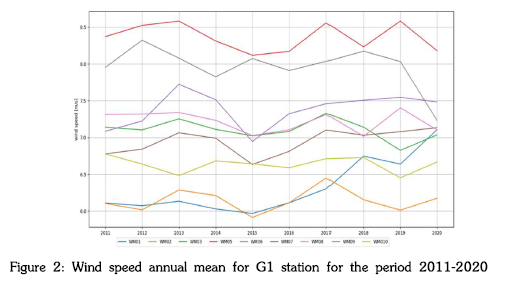
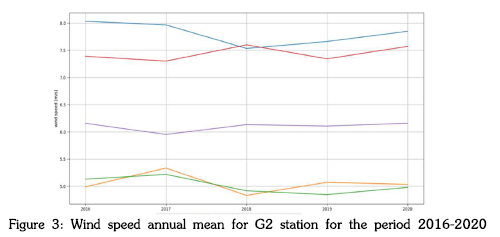
From Figure 2, it is seen that there is no clear trend in annual mean wind speed in most of the stations except at WM01 and WM07, thus verifying trend analysis results. At WM01, from 2011 to 2013 the mean wind speed is around 6.1 m/s then slightly decreases to approximately 6 m/s in 2014 and 2015. Then increases from 6 m/s to 6.8 m/s from 2015 to 2018 showing an increasing trend which was detected by the Mann-Kendalls test. At WM07, the annual mean wind speed starts from 6.8 m/s in 2011 and increases to 7.1 m/s in 2013 then slightly decreases to 6.7 m/s in 2015 and increases again to 7.2 m/s. At other stations, the mean wind speed fluctuates with no distinctive trends. There is no distinctive trend observed in annual mean wind speeds in G2 stations. This is evident from Figure 3. Trend analysis results using Mann Kendell test are thus confirmed.
Inter-annual variability
Inter-annual variability in wind speed is an important factor to consider when considering wind power. IAV values for Gl and G2 stations are shown in Table 5. The IAV values range between 1.1% and 3.4%. To verify results, ERA 5 dataset was also used. Using ERA 5 dataset at 100m above the ground, the IAV ranges from 1.5% to 3.9%. This is lower than the commonly used IAV of 5.4% (Krakuaer & Cohan, 2017). In previous studies that were conducted in South Africa by (Behrens & Pullinger, 2016) and (Wright & Grab, 2017), IAV ranged between 2% and 6%; However, this range was obtained using MERRA dataset, ERA-I datasets and data from the South African Weather Service, not the WASA data that were used in this study. The lowest IAV is recorded in WM15 while the highest is recorded in WM06.
Conclusion
The aim of this study was to examine patterns and variations in historical mean wind speeds. Trend analysis and the calculation of IAV values for wind speeds were conducted at Gl and G2 as they have at least four years of data, which is a requirement for the Mann-Kendalls test used to detect trends. Annual mean wind speed at all stations (WM01-WM19) ranged between 5.0 m/s and 8.4 m/s with the highest at WM05 and the lowest at WM13. After conducting a Mann-Kendalls test, there was no significant annual trend at most of the stations. The only stations that showed significant trends were WM01 and WM07 and at both stations, an increasing trend was found with a slope magnitude of 0.091 m/s/year (1.47 %/year) and 0.037 m/s/year (0.54 %/year), respectively. The reason for not having significant trends in 87% of the stations may be because the term in this study is low compared to the term normally used in most of the previous studies. It may also be simply because there is no significant trend in South Africas wind speed albeit the data used in this study is too limited to make the finding conclusive. It is thus recommended that further work be done using other sources of long-term historical observed wind speed data such as the Climate Research Unit (CRU TS v. 4.04; Harris et al., 2020) to establish whether the problem is the low term, or if there is simply no trend. It is furthermore recommended to substantiate our findings with the use of historical simulation and climate change scenarios under different global temperature goals.
The IAV values ranged from 1.1% to 3.4% using WAS A data and from 1.5% to 3.9% using ERA5 dataset. This is lower than the commonly used value of IAV (5.4%) implying that mean annual wind speed variation at these stations is low. For South Africa, using satellite data (MERRA and ERA-I datasets), it was shown that the IAV ranged between 2% and 6% (Behrens & Pullinger, 2016). WM01, WM02, WM03, WM05, WM06, WM07, WM09, WM11, WM12 and WM13 (71% of the stations) proved to have IAV values that fall within this range. Having low IAV values is good, because it shows that there is not much variation in wind speed and consequently, little variation in wind energy output.
References
Amadi, S. U. S., 2015. Analysis of Trends and Variations of Monthly Mean Wind Speed Data in Nigeria. Journal of Applied Physics, 7(4), pp. 31-41. [ Links ]
Behrens, M. & Pullinger, D., 2016. Inter-annual Variability of Wind Speed in South Africa, South Africa: Wind Prospect Ltd. [ Links ]
Gilbert, R. O., 1987. Table A18. In: Statistical Methods for Environmental Pollution Monitoring. New York: Van Nostrand Reinhold Company Inc., p. 272. [ Links ]
Hayes, A., 2021. Coefficient of Variation (CV). [Online] https://www.investopedia.eom/terms/c/coefficientofvariation.asp#::text=Key%20Takeaways-,The%20coefficient%20of%20variation%20(CV)%20is%20a%20statistical%20measure%20of,of%20return%20expected%20from%20investments [ Links ]
Ko, K., Kim, K. & Huh, J., 2010. Variations of Wind Speed in Time on Jeju Island, Korea. Energy (Oxford), 35(8), pp. 3381-3387. [ Links ]
Krakauer, N. a. C. D., 2017. Interannual variabilty and Seasonal Predictability of Wind and Solar Resource. Resources, 6(3), p. 29. [ Links ]
Krakauer, N. & Cohan, D., 2017. Interannual Variability and Seasonal Predictability of Wind and Solar Resources. Resources, 6(3), p. 29. [ Links ]
Krakuaer, N. & Cohan, D., 2017. Interannual Variability and Seasonal Predictability of Wind and Solar Resources. Resources, 6(3), p. 29. [ Links ]
Rehman, S., 2013. Long Term Wind Speed Analysis and Detection of its Trends Using Mann-Kendall Test and Linear Regression Method. Arab J Sci Eng, 38(2), pp. 421-437. [ Links ]
Rehman, S., Alam, M., Meyer, J. P. & Al-Hadhrami, L., 2012. Long-term Wind Speed Trends Over Saudi Arabia. Dublin, World Congress on Water, Climate and Energy. [ Links ]
Rehman, S., Alam, M., Meyer, J. P. & Al-Hadhrami, L., 2012. Long-Term Wind Speed Trends over Saudi Arabia. S.I., s.n. [ Links ]
WASA, n.d. [Online] Avallable at: http://wasadata.csir.co.za/wasal/WASAData [ Links ]
Wright, M. A. & Grab, S. W., 2017. Wind Speed Characteristics and Implications for Wind Power Generation: Cape Regions, South Africa. South African Journal of Science, 113(7/8). [ Links ]
Zaiontz, C, n.d. Sen's Slope. [Onllne] Available at: https://www.real-statistics.com/time-series-analysis/time-series-miscellaneous/sens-slope/ [ Links ]
* Corresponding author: Email: mamellochauke1@gmail.com

