


Services on Demand
Article
 English (pdf)
 Article in xml format
 Article references
Indicators

Related links
-
 Cited by Google
 -
 Similars in Google
Share

 Permalink
Journal of Energy in Southern Africa
On-line version ISSN 2413-3051
Print version ISSN 1021-447X
J. energy South. Afr. vol.33 n.3 Cape Town Aug. 2022
http://dx.doi.org/10.17159/2413-3051/2022/v33i3a10441
ARTICLES
Socio-economic analysis of solar photovoltaic-based mini-grids in rural communities: A Ugandan case study
Richard CartlandI, *; AI-Mas SendegeyaII; Jean de Dieu Khan HakizimanaI
IAfrican Center of Excellence in Energy for Sustainable Development, College of Science and Technology, University of Rwanda
IIDepartment of Electrical and Electronics Engineering, Faculty of Engineering and Technology, Kyambogo University, Uganda
ABSTRACT
The provision of electricity in rural areas has been an outstanding need in trying to achieve the United Nations sustainable development goals (SDGs) by 2030. However, most sub-Saharan countries have found this difficult due to financial constraints. Uganda tried to increase rural electrification to more than 20% of its population by 2020 through Rural Electrification Agency programmes. In an attempt to realise SDGs and the National Vision by 2040, Uganda is investing more in renewable energy sources, especially solar photovoltaic mini-grids to ensure that rural areas access affordable, reliable, and sustainable modern energy. This paper assesses the operation, causes of failure, causes of discomfort for mini-grid connected customers, and customer behavior of two solar photovoltaic mini-grids located in Kyenjojo District in western Uganda. It was found that the current energy demand exceeds the generation supply and that the systems need phase upgrades and clustering to remain economically viable and sustainable. The methodology involved re-sizing the existing load demand of the connected users, well-designed and administered questionnaires, analysis of published literature, review of the existing records, and interviews. Analysis was done in an Excel software program. The paper concludes by identifying the benefits and challenges of solar photovoltaic mini-grids in Kyenjojo District.
Keywords: Electricity; rural electrification; Uganda vision; renewable energy sources; mini-grids
1. Introduction
Only about 28% of the African population is connected to electricity leading to energy poverty and slowed economic development in the affected countries. This has brought attention to investment in both off-grid and on-grid solutions (Mugagga and Chamdimba 2019). In Sub-Saharan Africa, it is estimated that 675 million people have no access to electricity, mostly in rural areas (Trotter, Cooper, and Wilson 2019). This prompted the intervention of key stakeholders, including development partners and governments, to provide modern energy services, especially in remote areas, hence fulfilling the United Nations Sustainable Development Goal (SDG) 7, which requires access to affordable, reliable sustainable, and modern energy for all (Madriz-vargas et al. 2014)
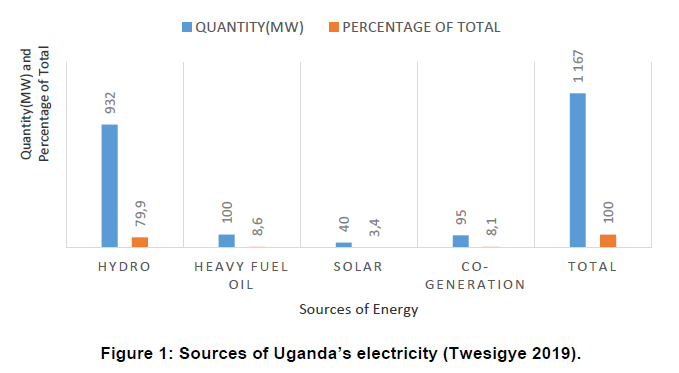
Uganda the energy challenges of the region. The country is, however, highly endowed with renewable energy resources, dominated by solar, hydro, and biomass (Kavuma, Sandoval, and Jean de Dieu 2021). Uganda's present generation is mainly from hydro, supplemented by solar, heavy fuel and co-generation, as shown in Figure 1.
Although there is limited data to show the statistical contribution of these resources to the national energy balance, the available information indicates that about 20% of Uganda's population has access to electricity (UOMA 2019). The percentage of the population accessing electricity is higher in urban areas, and drops to about 10% outside urban centres. In June 2016, the Uganda Bureau of Statistics estimated that 20% of Ugandans had access to Electricity. The low electrification rate in the country is among the major barriers to economic development and poverty reduction. Most rural communities are characterised by sparse population density, dominated by domestic consumers with low electricity demand. This makes it financially challenging to bring national grid extension. Electrifying such communities attracts the use of decentralised power systems such as solar home systems, and mini-grids in communities with clustered settlements (Kaygusuz, 2011). Rural electrification targets dependence on kerosene and diesel generator sets, aiming to enable income-generating activities and increase employment among rural communities. The approach contributes to the government's development goal to reduce poverty by improving health and education, and so helps it to realise Vision 2040(A Transformed Ugandan Society from a Peasant to a Modern and Prosperous Country within 30 years) and SDGs 3(Good health and well being), 4(Quality Education) and 7(Affordable clean Energy) (MEMD 2015).
Some studies in Uganda indicate that solar pho-tovoltaics (PV) energy has immense potential to provide clean energy and address poverty alleviation issues, thereby fostering social-economic development in rural areas (Trotter et al. 2019) (Aarakit et al. 2021)(Avellino et al. 2018).
Energy generated by solar PV is regarded as environmentally clean, economical, socially beneficial to rural households (Sharma, Tiwari, and Sood 2012), and sustainable in lighting houses and running small businesses (GNESD 2007). (Suri et al. 2020) suggest that for countries to achieve 100% of electricity connectivity by 2030, 70% will be from mini-grids and other centralised systems such as nuclear power plants, wind farms, hydroelectric dams and solar energy plants. A report from Energy and Environment Partner also indicate that mini-grids provide long-term energy solutions and developmental impact of a life span of about 15-25 years (Peters, Sievert, and Toman 2019).
On the side of costs, mini-grids provide potential opportunities over grid-connected, such as enhanced reliability of supply lower costs, and better environmental performance in remote areas. The increase in fuel prices and a decrease in the cost of renewable energy technologies are making mini-grid development popular in Africa (Lai and Raturi 2012). Decentralised mini-grids are one of the many solutions to electrify rural areas. They fit between standalone solutions and national grid extensions (Contejean and Verin 2017). Village-level mini-grids offer great potential for good quality electricity provision at a lower cost than grid extension in sparsely populated areas where demand density is lower than in more settled areas (Peters et al. 2019).
Uganda's ambition to achieve a rural electrification rate of 26% by 2022 and universal access by 2040, has put more emphasis on the expansion of mini-grids, by dividing the country into thirteen scaled-up service territories where long-term electrification service business plans are to be developed. So far hardly any research has been done on mini-grid development in Uganda if it comes to detailed analysis of local context including natural resources, supply chains, energy demand, and energy policies. Mishra and Behera (2016) assess the economic and financial feasibilities of mini-grids based on renewable energy use and uses energy markets as an off-grid electrification solution but do not address the failure and inefficiency of existing mini-grids.
Sendegeya (2009) analyses the economic performance of isolated mini-grids by looking at characteristics of demand and supply and rural electricity markets but does assess in detail the impact of price regulation and subsidies on economic performance and benefits of mini-grids. Fritzsche et al. (2019) show registered mini-grids in Uganda and projects that have been implemented and their operation is conducted non-commercially, leading to poor system performance, short life spans, and insufficient electrification.
The reports by the Ministry of Energy and Mineral Development (MEMD), Electricity Regulatory Agency (ERA), Rural Electrification Agency (REA) and International Zusammenarbeit (GIZ) have sketchy information about the operation and maintenance of mini-grids in Uganda and the failure rate scenarios (Pérez-López 2020). It is noted that most of the previous studies mainly focused on small-scale off-grid and grid extension, looking at planning, installation, operation, and financing, and leaving out the cause of failure and customer-based designs of the rural-based mini-grids. This is seen as a gap. It is, therefore, necessary to investigate the feasibility of solar PV renewable energy-based mini-grids to meet energy demand for newly electrified rural communities of developing nations. If the technical, economic, planning and designing of the systems are not properly assessed, the operation may be a challenge, especially when the national grids are extended to the rural communities.
1.1 Overview of energy status in Uganda
The burning of renewable resources provides approximately 90% of the energy in Uganda. While much of the hydroelectric potential of the country is untapped, the government decided to expedite the creation of domestic petroleum capacity coupled with the discovery of large petroleum reserves in western Uganda (Lane et al. 2018). This holds the promise of a significant change in Uganda's energy status (MEMD 2007). In 2005 and 2006, low water levels of Lake Victoria, the main source of the country's electricity generation potential, led to a generation shortage and an energy crisis. As a result, the country experienced frequent and prolonged blackouts (Government of Uganda 2007).
In February 2015, the electricity-installed capacity was 810 MW with a peak demand of 509.4 MW. In September 2017, installation capacity had increased to 950 MW and more than 1167 MW by the end of 2019 with a peak demand of about 625 MW according to Uganda's Regulatory Authority (MOF-PED 2021). The Ministry of Energy has scanty up-to-date data for other renewable energy sources such as those of wind, geothermal, tidal, and wave.
1.2 Development of min-grids in Uganda
A mini-grid is defined as a set of electricity generators and energy storage systems connected to a distribution network that supplies electricity to a localized group of customers (Espinar & Didier, 2011). They involve small-scale electricity generation (10 kW to 10 MW) which serves a limited number of consumers via a distribution grid that can operate in isolation from national electricity transmission networks (Bhattacharyya 2018).
This power delivery architecture can be contrasted to a single customer system, as in the case of a solar home systems (SHSs). Where there is no distribution, networks interconnecting customers may be difficult. This can be done by connecting to a centralised grid system where electrical energy is transmitted over large distances from large central generators where local generators are generally not capable of meeting the demand (Ocon and Bertheau 2018; Mahumane and Mulder 2019).
Mini-grids may be designed to interconnect with the central grid which means it operates under normal conditions as part of the central grid with disconnection occurring only if power quality needs to be maintained, as for example in the case of a central grid failure. Alternatively, a mini-grid may be designed to operate autonomously in a remote location with the option to connect to a central grid when grid extension occurs (REA 2013)
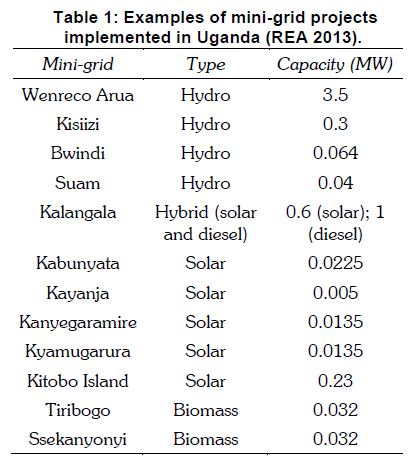
The development of mini-grids in areas remote from the national grid can increase electricity access in the country (Weston et al. 2016). Since 2000, Uganda has been implementing rural electrification projects, mainly hydropower, solar, biomass hybrid of solar and diesel projects as shown in Table 1.
1.3 Location of the study area
Kyamugarura and Kanyegaramire solar PV power mini-grid systems are located in Kitega Parish, Bufunjo Sub-county Mwenge County, Kyenjojo District, almost at the same latitude (0.660N), longitude (30.860E), and altitude. They are about 5 km apart. These projects were co-jointly funded by Energy for Development (E4D) which provided generation costs and Rural Electrification (REA) Uganda provided civil works and distribution costs (UNIDO 2019)(Lakshmi, Ester, and Hebo 2018). When the researchers visited the site areas and carried out a study survey, they realised that there has been a worry of Kanyegaramire and Kyamugarura mini-grid users about the continued failure and system usage inefficiencies. Some of the users have lost hope in the existing systems and are about to resort to their former traditional energy sources (some of the complaints shared with researchers). Following the high investment expenditure made by the Government of Uganda and the University of Southampton, it is not economical to abandon the mini-grids but rather find out reasons why and be able to fix the faults and hence sustain the mini-grids.
The population of Kyejonjo District has been growing steadily, hence impacting heavily on electricity demand as shown in Figure 3. This population increase is a clear indication that a reduction in electricity hour usage is a result of increasing demand (Lakshmi et al. 2018)(Ouedraogo 2017).
2. Materials and methodology
The research focuses on two mini-grids located in the villages of Kyamugarura and Kanyegaramire, in western Uganda. They were commissioned and began operating in 2016 (UOMA, 2019). In an attempt to assess their technical performance, the systems were re-sized by the researchers. The investigation focused on reliability, dominated by fast load demand. The researchers used and analysed data from records kept by the Rural Electrification Agency (REA), reports from ineternational agencies, and published data in literature about the case study area.
about the case study area. Load demand analysis was done by carrying out sizing of existing electrical systems of the people connected to the mini-grids by considering the average values. The questionnaire was designed to capture the status of livelihoods of the people connected to the mini-grids by looking at earning and spending behaviours, ability to pay for electricity bills and other essential needs. The complaints about the mini-grid systemes were obtained directly from personal interaction. The results were analysed using Excel (Berk 1999)
Five steps were followed to re-size existing systems by using customer power usage practices (Hankins 2010):
• Estimating electric loads on both mini-grids.
• Sizing and specifying batteries.
• Sizing and specifying an array.
• Sizing and specifying the features of a controller.
• Sizing and specifying the features of the inverter.
The sizing of the system followed the following procendure.
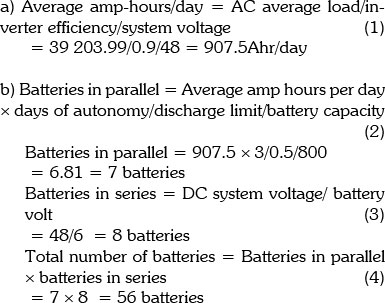
Battery sizing
a) Average Amp-hours/day = AC average load/inverter efficiency/system voltage
b) Batteries in parallel = Average amp hours per day χ days of autonomy/discharge limit/battery capacity
c) Batteries in series = DC system voltage/ battery voltage
d) Total number of batteries = Batteries in parallel χ batteries in series
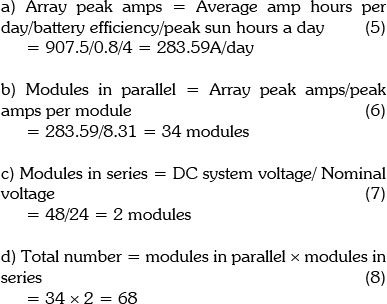
Array sizing
a) Array peak Amps = Average amp hours per day/battery efficiency/peak sun hours a day
b) Modules in parallel = Array peak amps/peak amps per module
c) Modules in series = DC system voltage/ Nominal voltage
d)Total number = modules in parallel X modules in series
Charge controller sizing
Assume system losses to be at 25% so that the safety factor is at 125%. System losses are included in the sizing calculations because they affect the proper sizing of the PV array. Other losses catered for are wire and connection losses, parasitic losses, battery charge and discharge losses, dust on the array, and inverter losses (Khaligh & Onar, 2017).

Inverter sizing

3. Research findings
In the case study areas, most of the consumers are domestic, doubling the business consumers, as shown in Table 2.
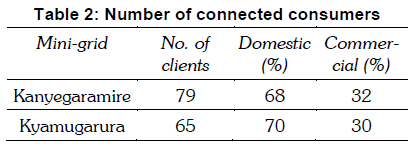
Kanyegaramire has approximately 79 customers, 32% commercial (dominated by small retail shops) and 68% households. Kyamugarura has 65 customers, 30% commercial (dominated by small retail shops) and 70% households. The households predominantly have 'Life-line' needs of about 2-3 kWh per month for three LED lights, a radio, and mobile phone-charging.
Kyamugarura and Kanyegaramire villages have household occupancy ranging from four to seven people.There are both extended and nuclear families in individual houses. The demography is based on the national population census (UBOS 2017). The population of females is dominant and the youth number is significantly larger. The primary occupation is mainly subsistence agriculture (69%), and small businesses are dominated by retail shops (27%). The common crops grown in the area include maize, potato, beans, and bananas, dominating most of the land.
The type of buildings (i.e. materials used) was assessed to establish the permanence of occupation, and long-term use of electricity, and safety. The safety of installation depends on the type of structure, which also reflects the strength of the buildings. The materials used in developing buildings include bricks, wooden structures, concrete, and clay, metal, and grass/straw/hay.
Besides electricity from the solar PV mini-grids, people still use other sources to meet competing services, including kerosene for lighting and dry cells in radios and torches. Also, SHSs and solar lanterns are widely available in local shops. The percentage of people using kerosene is very low.
The two communities share public schools, health centres, and street lighting. People also enjoy the same services from shops, local restaurants, entertainment places, tailors, barbers, etc. Welding and fabrication, food-processing like milling and milk-coolers are potential economic activities in waiting due to uncertainty of power supply.
Most customers do not keep records of their power consumption and a regular pattern followed to purchase units from the operator. The only information available is directly obtained from the operator about the original installation for the clients. The following observations were made from electricity users:
• Each user has two sockets installed, but they secure power extensions to increase the socket distribution.
• Most of them have three lighting points, though others after the initial installation expanded the lighting points.
• Some consumers have TVs and they claim that they purchased them after the initial installation.
• People are already frustrated about the unreliability of the supply.
The load profile was to be developed after considering the different categories of consumers as shown in Table 3.
3.1 Rating capacity of mini-grid systems in the case study area
The power plants at both sites are the same. Power plant category solar PV plant with installed capacity for panels of 13.5 kW, 54 modules each at 250Wp. The inverter size is 10 000 VA, 2 inverters of 5 000VA, 48V and a storage capacity of 24 batteries of 800 Ah, 2V. The generated energy capacity for each mini-grid is 38.4 kWh. The grid networks in both areas are standard single-phase AC 240 volts power networks for low-voltage consumers. The installation was designed following the standard grid codes of the country.
4. Results and discussions
By applying the methodology given and input data presented in Tables 4 and 5, the steps listed below are taken.
4.1 Kanyegaramire mini-grid with 79 connected customers
Electric load estimation analysis
AC total connected watts is 15 216 W, AC average daily load 39 203.99 Whr/day.
Array sizing data
Available data:
•Battery efficiency: 80%
• Peak sun hours: 4 hours
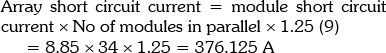
• Short circuit current: 8.85 A
• Maximum power current: 8.31 A
• Open circuit voltage: 37.5 V
• Nominal voltage: 24 V
Therefore, controller array amps are approximately 400 A.
Charge controller sizing
Assume system losses to be at 25% so that the safety factor is 125%.
Inverter sizing
AC total wattage is 15 216 W
DC system voltage is 48 V
DC amps = AC total wattage/DC system voltage (1) = 15 216/48 = 317 A
4.2 Kyamugarura solar PV mini-grid with 65 connected customers
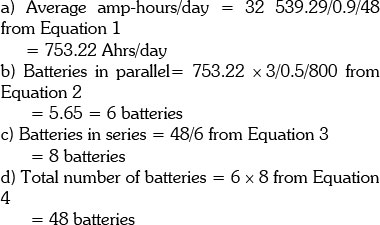
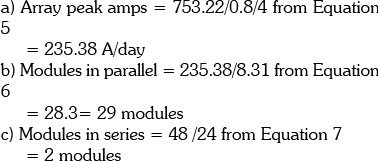
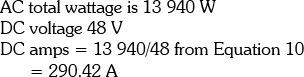
AC total connected watts is 13 940 W; AC average daily load is 32 539.29 Wh/day.
Note that specifications of solar equipment at Kanyegaramire are similar to those at Kyamugarura
Battery sizing
Array sizing
Charge controller sizing
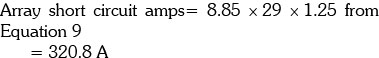
Therefore, controller array amps are approximately 321A
Inverter sizing
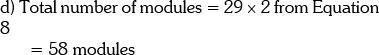
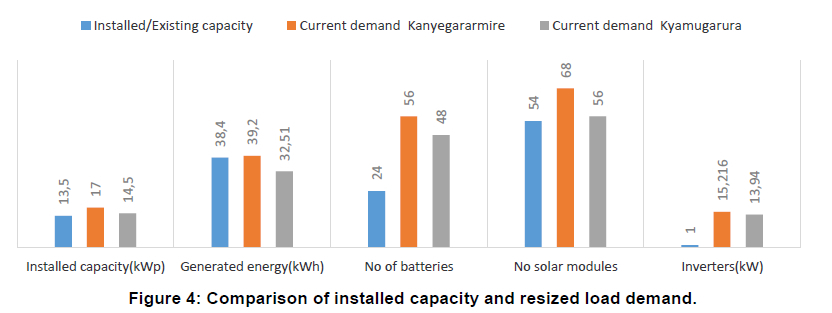
The findings show that, if the existing customers were to be served better to meet their electricity demands, the installed capacity for Kanyegaramire and Kyamugarura would have been 17.0 kWp and 14. 5kWp respectively. The difference between 3.5 kWp and 1 kWp respectively is a cause of load shedding due to insufficient power supply. 68 solar modules and 56 solar batteries would be needed for an energy storage capacity of 39.2 kWh to meet the current demand at Kanyegaramire, and 56 modules and 48 batteries for battery storage capacity of 32.51 kWh at Kyamugarura.
Approximately four and three inverters of 5 kW are needed for conversion of DC to AC at Kanye-garamire and Kyamugarura respectively instead of the two inverters of 5 kW that are installed. This clearly shows that demand has exceeded supply and this has overstressed the system. As the result, the storage system has failed with the supply experienced for very few hours daily. On rainy days the supply is not guaranteed. This explains the discomfort amongst customers connected to the mini-grids.
However, the introduction of mini-grids in the two villages has demonstrated the importance of electricity. The demand for electricity services has increased for both domestic and business use. There is an increase in connectivity applications. The current system cannot cater for the increased demand. It is therefore necessary to upgrade the system in terms of capacity and phase and if possible cluster the two mini-grids.
4.3 Electricity usage in the study areas
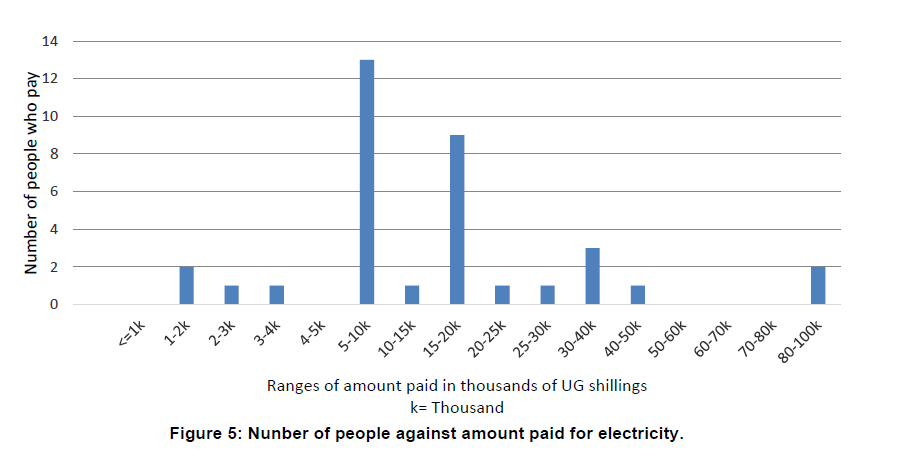
The monthly electricity bills for users are shown in Figure 5. It is observed that there no customers who pay less than 1 000 shillings per month and the majority pay less than 10 000 shillings a month. The two isolated cases that pay 80 000-100 000 use fridges and television sets.
The use of television sets in the area was also assessed, and is shown in Figure 6. The number of TV users increases from 08 a.m. to 10 p.m. and then drops again. This is because during the day there a few customers who own businesses like kiosks, saloons, and entertainment rooms that use TV sets. From 8 p.m. to 10 p.m. usage increases greatly because of news broadcasts and relaxation, until the hourse of sleping, after 10 p.m.
There are also households with several lights, a radio or stereo system and a TV. The use of satellite TVs is rstricted to a few households and selected entertainment centres. The largest consumers are the houses of the wealthiest consumers, using lights, radio, TV, fans, fridges, deep freezers and computers.
The trend of business growth in the area is shown in Figure 7.
It is notable that the mini-grids started operation in 2016, since when the rate at which businesses commenced increased Between 2018 and 2020 about 42% of the businesses opened. This indicates that electrification in the area facilitated economic growth. The operation of various businesses was assessed according to monthly revenues and earnings. Average monthly incomes for different percentage of consumers, mainly business electricity users, are summarised in Figure 8.
More than 90% of the respondents earn less than four million shillings per month from the businesses. The majority earn 0.5 million or less. Those with businesses in the trading centres earn between one and three million. The common operation hours of the daily business are 8 am to 5 pm. Some shops and entertainment centres operate up to 10 pm and can operate throughout the week.
The research team wanted to know their sources of electricity despite having mini-grids in the area, and found that no domestic customer uses a generator, and some businesses would not use generators, because the expenditure on fuel and maintenance would exceed the income anticipated, as shown in Figure 9. About 25% of the people use SHSs, and the majority, about 74%, are connected to the mini-grids.
4.4 Demand load profiles for the case study villages
Load profiles are required to plan and size a power system network, such as the mini-grids. The load profiles were developed based on the data obtained from the field and after interacting with electricity users in the areas. The number of appliances and ratings for each customer was determined from the field survey and information provided by the users. In some situations, the number of lights (indoor and security) per customer was estimated as 3, based on the number of rooms in rural homes, and the number of lights for health centres was assumed to be 35, based on the observations made during the field trips to the case study villages. This load profile does not include the load consumption of welding machines, photocopiers, desktop computers, cutters, grinders, water pumps, music systems, and street lighting, because information about them was scanty.
The load curve is important information for the design process of a suitable power supply of a settlement, as well as for the further understanding of the electricity consumption behavior as shown in Figure 10.
The load profile for the two villages combined is developed using the data obtained from the field. The interview was administered for about 80 users. The villages have close to 150 users, according to the information obtained from the operators. The load profile is estimated using the average load consumption for key appliances (lighting, TVs, and refrigeration). The average wattage for the appliances for the load is 0.055 kW.
The developed daily load profile shows an evening peak demand with low demand during the daytime (see Figure 10). Based on the assumptions and estimates given, the peak demand is close to 2.5 kW. The lowest consumption demand is 0.06 kW and the highest is 2.2 kW from 8-10 a.m. and 8-10 p.m. respectively. From 6-10 p.m. people are at home and awake, using lights and various appliances like TVs and radios, leading to peak demand. During the day, the demand is only registered at work places.
4.5 Benefits and challeges
The researchers noted that the provision of electricity by mini-grids provided sustainable benefits to rural communities, as reported in Table 6. Despite these notable benefits, the two mini-grids face some notable challenges that limit their proper operation, maintenance and proper planning, thus hindering the development and upgrade of the mini-grids, as shown in Table 7.
5. Conclusion
Solar photovoltaic mini-grids are low maintenance, versatile solutions to the needs of any off-grid application. Kanyegaramire and Kyamugarura mini-grids have proven to be reliable, cost-effective alternatives to conventional power and the right choice to replace the noisy, unreliable generators commonly used in remote areas.
In both areas a connection fee of UGX 140 000 (approximately USD 39) is charged to each customer and is inclusive of house wiring, bulbs, meters and sockets. The customer then pays for the energy used. The tariff is UGX 1000 per kWh (approximately USD 0.28), paid cash and offered a token on a smart card for the prepaid meters. The system avoids billing costs and prevents arrears. Revenue collection is accomplished by a permanent staff employed by the village cooperative.
According to the analysis made in this study, the system needs upgrade from the exsisting 54 solar modules to 64, from 24 batteries to 56, from 2 inverters of 5 kW capacity to 4 at Kanyegaramire and 58 solar modules, 48 batteries, 3 inverters of 5 kW capacity at Kyamugarura, to cater for increasing demand and avoid constant load shedding.
The peak demand was found out to be from 510 p.m., with low demand from 7-2 p.m.
The mini-grid systems at the two sites can easily be adopted for clustering and eventually for interconnection to the national grid to meet the demand and supply aggregation to ensure economies of scale, increase the market size, improve the reliability of supply, and optimally utilise resources. However, interconnection might require upgrading the system to three-phase to higher voltage (possibly 11 kV) for distribution networks in Uganda. The systems make use of the local resources and the systems are managed locally. This has demonstrated the ability to build local capacity.
The demand for electricity services has increased for both domestic and business use. There is an increase in connectivity applications. The current system cannot cater for the increased demand. Further technologies to be employed, in addition to renewable energy technologies such as solar photovoltaic, should be made flexible for future integration into the nearby incoming grid.
Acknowledgement
The authors would like to appreciate the assistance offered by African Center of Excellence in Energy for Sustainable Development, College of Science and Technology, University of Rwanda, the University of Southampton (UK), Kyambogo University (Uganda). They also acknowledge the contribution made by the team on the study site and the guidance of the Rural Electrification Agency.
Author roles
Richard Cartland collected, analysed data and wrote the paper. Al-Mas Sendegeya supervised data collection and proofread and refined the work on every section of the paper. Jean de Dieu Hakizimana proofread the paper and guided in data analysis.
References
Aarakit, Sylvia M., Joseph M. Ntayi, Francis Wasswa, Muyiwa S. Adaramola, and Vincent F. Ssennono. 2021. Adoption of Solar Photovoltaic Systems in Households: Evidence from Uganda. Journal of Cleaner Production 329(November):129619. doi: 10.1016/j.jclepro.2021.129619. [ Links ]
Avellino, OTING William Kamis, Fridah Mwarania, AL-HASSAN Abdul Wahab, and KPATINDE Talagbe Aime. 2018. Uganda Solar Energy Utilization: Current Status and Future Trends. International Journal of Scientific and Research Publications (IJSRP) 8(3). doi: 10.29322/ijsrp.8.3.2018.p7547. [ Links ]
Berk, Kenneth N. 1999. Data Analysis With Microsoft® Excel. Vol. 41. [ Links ]
Bhattacharyya, Subhes C. 2018. Mini-Grids for the Base of the Pyramid Market: A Critical Review. Energies 11(4). doi: 10.3390/en11040813. [ Links ]
Contejean, Arthur, and Louis Verin. 2017. Making Mini-Grids Work Productive Uses of Electricity in Tanzania About the Authors Produced by IIED's Shaping Sustainable Markets Group Acknowledgments. [ Links ]
GNESD. 2007. Renewable Energy Technologies and Poverty Alleviation: Overcoming Barriers and Unlocking Potentials. [ Links ]
Government of Uganda. 2007. The Renewable Energy Policy for Uganda. [ Links ]
Hankins, Mark. 2010. Stand-Alone Solar Electric Systems: The Earthscan Expert Handbook for Planning, Design and Installation. [ Links ]
Kavuma, Chrish, Diego Sandoval, and Hakizimana Khan Jean de Dieu. 2021. Analysis of Power Generating Plants and Substations for Increased Uganda's Electricity Grid Access. AIMS Energy 9(1):178-92. doi: 10.3934/ENERGY.2021010. [ Links ]
Kerstin Fritzsche, Luke Shuttleworth, Bernhard Brand, Philipp Blechiger. 2019. Exploring the Nexus of Mini-Grids and Digital Technologies. (August). [ Links ]
Lakshmi, Padmasai, Anette Ester, and Thomas Hebo. 2018. General Rights Market for the Integration of Smaller Wind Turbines in Mini-Grids in Uganda. [ Links ]
Lal, Sandeep, and Atul Raturi. 2012. Techno-Economic Analysis of a Hybrid Mini-Grid System for Fiji Islands. International Journal of Energy and Environmental Engineering 3(1):1-10. doi: 10.1186/2251-6832-3-10. [ Links ]
Lane, Jon, William Hudson, Luke Walley, and Yuri Lima Hamden. 2018. Mini-Grid Market Opportunity Assessment: Nigeria. Se4All (December). [ Links ]
Madriz-vargas, Rolando, Anna Bruce, Muriel Watt, Universidad Nacional, and Costa Rica. 2014. A Cross-Case Analysis of Needs , Barriers and Opportunities from Community Renewable Energy Projects in Central America. 1 -10. [ Links ]
Mahumane, Gilberto, and Peter Mulder. 2019. Expanding versus Greening? Long-Term Energy and Emission Transitions in Mozambique. Energy Policy 126(April 2018):145-56. doi: 10.1016/j.enpol.2018.10.056. [ Links ]
MEMD. 2007. The Renewable Energy Policy for Uganda. 128. [ Links ]
MEMD. 2015. Ministry of Energy and Mineral Development: Uganda's Sustainable Energy For All (SE4A11) Initiative Action Agenda. (June):1-78. [ Links ]
Mishra, Pulak, and Bhagirath Behera. 2016. Socio-Economic and Environmental Implications of Solar Electrification: Experience of Rural Odisha. Renewable and Sustainable Energy Reviews 56:953-64. doi: 10.1016/j.rser.2015.11.075. [ Links ]
MOFPED. 2021. Energy and Minerals Development Sector SEMI-ANNUAL BUDGET MONITORING REPORT. [ Links ]
Mugagga, Reuben Gad, and Hope Baxter Nqcube Chamdimba. 2019. A Comprehensive Review on Status of Solar PV Growth in Uganda. Journal of Energy Research and Reviews (February):1-14. doi: 10.9734/jenrr/2019/v3i430113. [ Links ]
Ocon, Joey D., and Paul Bertheau. 2018. Energy Transition from Diesel-Based to Solar Photovoltaics-Battery-Diesel Hybrid System-Based Island Grids in the Philippines - Techno-Economic Potential and Policy Implication on Missionary Electrification. Journal of Sustainable Development of Energy, Water and Environment Systems 7(1):139-54. doi: 10.13044/j.sdewes.d6.0230. [ Links ]
Ouedraogo, Nadia S. 2017. WIDER Working Paper 2017/56 Energy Futures Modelling for African Countries: LEAP Model Application. [ Links ]
Pérez-López, Diego. 2020. Success in Rural Electrification Regulatory Case Studies UGANDA A Bundled Approach to Mini-Grid Tendering. Deutsche Gesellschaft Für Internationale Zusammenarbeit (GIZ) GmbH. [ Links ]
Peter Weston, Shashank Verma, Linda Onyango, Abishek Bharadwaj. 2016. Green Mini-Grids in Sub-Saharan Africa : (December):1 -36. [ Links ]
Peters, Jörg, Maximiliane Sievert, and Michael A. Toman. 2019. Rural Electrification through Mini-Grids: Challenges Ahead. Energy Policy 132(December 2018):27-31. doi: 10.1016/j.enpol.2019.05.016. [ Links ]
REA. 2013. Rural Electrification Strategy and Plan 2013-2022. [ Links ]
Sendegeya, Al-mas. 2009. Simulation of Economical Performance of Isolated Rural Mini-Grids. Vol. 5.3 [ Links ]
Sharma, Naveen Kumar, Prashant Kumar Tiwari, and Yog Raj Sood. 2012. Solar Energy in India: Strategies, Policies, Perspectives and Future Potential. Renewable and Sustainable Energy Reviews 16(1):933-41. doi: 10.1016/j.rser.2011.09.014. [ Links ]
Suri, Dhruv, Jai Shekhar, Amartya Mukherjee, and Anhad Singh Bajaj. 2020. Designing Microgrids for Rural Communities: A Practitioner Focused Mini-Review. Proceedings - 2020 IEEE International Conference on Environment and Electrical Engineering and 2020 IEEE Industrial and Commercial Power Systems Europe, EEEIC / I and CPS Europe 2020. doi: 10.1109/EEEIC/ICPSEurope49358.2020.9160555. [ Links ]
Trotter, Philipp A., Nathanial J. Cooper, and Peter R. Wilson. 2019. A Multi-Criteria, Long-Term Energy Planning Optimisation Model with Integrated on-Grid and off-Grid Electrification - The Case of Uganda. Applied Energy 243(December 2018):288-312. doi: 10.1016/j.apenergy.2019.03.178. [ Links ]
Twesigye, Peter. 2019. Scaling up Rural Electrification in Uganda : Innovative Technical and Financial Solutions Being Explored to Address Access Challenges Energy Insight. (March). [ Links ]
UBOS. 2017. National Population and Housing Census 2014 - Area Specific Profiles - Isingiro District. Uganda Bureau of Statistics 2016, The National Population and Housing Census 2014 - Main Report, Kampala, Uganda (April):1-209. [ Links ]
UNIDO. 2019. World Small Hydropower Development Report 2019. [ Links ]
UOMA. 2019. Market Map of Off-Grid Energy in Uganda and Neutral Intermediary , Focused on Scaling off-Grid Energy Access. [ Links ]
* Corresponding author: Tel.: +256 77 283 8932/ +250 78 727 9638: E-mail: cartland.richard@gmail.com

