


Services on Demand
Article
 English (pdf)
 Article in xml format
 Article references
Indicators

Related links
-
 Cited by Google
 -
 Similars in Google
Share

 Permalink
Journal of Energy in Southern Africa
On-line version ISSN 2413-3051
Print version ISSN 1021-447X
J. energy South. Afr. vol.33 n.3 Cape Town Aug. 2022
http://dx.doi.org/10.17159/2413-3051/2022/v33i3a13592
ARTICLES
Determination of country-specific greenhouse gas emission factors for South African liquid and gaseous fuels
Gerrit KorneliusI, *; Patricia ForbesII; Theo FischerIII; Malin GovenderIII
IDepartment of Chemical Engineering, Faculty of Engineering, Built Environment and Information Technology, University of Pretoria, Pretoria, South Africa
IIDepartment of Chemistry, Faculty of Natural and Agricultural Sciences, University of Pretoria, Pretoria, South Africa
IIIEScience Associates, Johannesburg, South Africa
ABSTRACT
Higher-tier methods for greenhouse gas reporting require country-specific emission factors for a range of liquid and gaseous fuels for both stationary and mobile fuel combustion activities. Samples of selected liquid fuels used in South Africa were collected over the summer and winter seasons in the Gauteng, Mpumalanga, Free State, KwaZulu-Natal and Western Cape provinces of South Africa, primarily from large retail stations along major traffic routes (unleaded petrol - ULP93 and ULP95 - and diesel). Liquid fuels used in smaller volumes (bio-ethanol, paraffin, jet kerosene, aviation gasoline and heavy fuel oil) were also sampled at appropriate locations. Samples (343 in total) were analysed for carbon content using standard methods at an accredited commercial laboratory. Calorific values of the fuels were also determined, to allow for the calculation of methane and nitrous oxide emission factors. Results were statistically analysed to determine mean values and their uncertainties, to identify outliers, and to determine correlations between variables. Results for ULP93 and ULP95 were weighted by their respective 2021 annual average sales volumes to obtain an average value for all petrol of 2 263 g CO2/L. Based on sales data from the years 2018-2021, summer and winter results were equally weighted to obtain annual average emission factors for ULP93 (2255 g CO2/L), ULP95 (2 265 g CO2/L) and diesel (2 650 g CO2/L), reflecting a slight decrease from the values contained in the 2017 Department of Environmental Affairs Technical guidelines for monitoring, reporting and verification of greenhouse gas emissions by industry. A calculation-based liquefied petroleum gas emission factor, confirmed by analysis certificates from a number of local suppliers, was found to be 3002 g CO2/kg.
Highlights
• Tier 2 carbon dioxide emission factors for liquid fuel use for South Africa
• Liquid fuel emission factors based on analysis of 343 samples
• Emission factors for eight fuel types used in South Africa
• Emission factors reported for summer and winter
Keywords: emission factor; fuel; emission inventory; carbon dioxide
1. Introduction
Climate change poses a significant risk to South Africa's development gains, exacerbating the existing national challenges of poverty, unemployment, and inequality, and undermining the country's efforts to achieve the development goals within the National Development Plan of 2012 (National Planning Commission 2012), together with the United Nations Sustainable Development Goals. The National Climate Change Response Policy (NCCRP) of 2011 (DEA 2011) sets out South Africa's climate change response and approach to achieving a just transition to a climate-resilient and low-carbon economy and society, as well as advancing the vision of the National Development Plan: Vision 2030, including emission reduction targets to 'reduce its emissions below a baseline of 34 percent by 2020 and 42 percent by 2025'. The NCCRP recognises climate change response monitoring and evaluation as key to an effective national response and recognises that 'the majority of South Africa's emissions arise from energy supply (electricity and liquid fuels) and use (mining, industry and transport), and mitigation actions with the largest emission reduction potential focus on these areas'.
The NCCRP cites accurate, complete and up-to-date data as the foundation of an effective response, positioning the National Greenhouse Gas (GHG) Inventory as a critical part of the national climate action. This is reinforced by the Climate Change Bill of 2022, which requires the Minister to establish a national system of data collection for the creation of this inventory and annual reporting (Department of Forestry, Fisheries and the Environment (DFFE) 2022). The National GHG Emission Reporting Regulations, under the National Environmental Management: Air Quality Act (Act No. 39 of 2004), took effect in April 2017, establishing a single GHG emissions national reporting system to update and maintain the National GHG Inventory (DEA 2017a). There is a requirement that certain emission categories and activities make use of higher-tier methods in quantifying GHG emissions after a period of five years from April 2017. The use of such higher-tier methods requires country-specific emission factors for a range of liquid and gaseous fuels for both stationary and mobile fuel combustion activities. In addition, climate finance needed to implement both adaptation and mitigation rests to some degree on the country's scientific credibility and the highest possible data standards to support the governance of concessional loans
The DFFE is responsible for implementing the country's mandatory GHG reporting regime, which forms the basis for implementation and tracking of various climate change mitigation initiatives, informs policy formulation, and supports compilation of the national GHG inventory. The accuracy of the national GHG emissions estimate has a significant influence on the country's total inventory of GHGs and downstream policymaking and implementation, as well as reporting by a range of stakeholders.
In terms of a GHG inventory, a tier represents a level of methodological complexity. Three tiers are usually provided for. Tier 1 is the basic IPPC (Intergovernmental Panel on Climate Change) 2006 method using generic emission factors, Tier 2 is a method of intermediate complexity using country-specific emission factors, while Tier 3 uses source- or facility-specific emission factors and is the most demanding in terms of complexity and data requirements. In this context, an emission factor allows the calculation of the GHG emissions from a unit of activity, production, or fuel use. Tier 2 and 3 methods are sometimes referred to as higher-tier methods and are generally considered to be more accurate, on condition that adequate locally specific sets of data are available to develop, evaluate and apply a higher tier-method (IPCC 2019). The transition to Tier 2 reporting requires higher standards in the reporting of sector activity data to more accurately apportion emissions to specific sectors. To date, South Africa has been reporting GHG emissions based on a Tier 1 approach using carbon dioxide emission factors published in the Technical guidelines for monitoring, reporting and verification of greenhouse gas emissions by industry (DEA 2017b).
Although numerous guides to the calculation of emission factors are available (API 2009; UBA 2018; DEE 2017; IPCC 2006; US EPA 2005; US EPA 2008; US EPA 2020; DEA 2017b), guidance on the number of fuel samples that must be taken to ensure sample representativity and certainty in emission factor, is generally lacking. The API (American Petroleum Institute) Technical Report 2572 (API 2013) provides a methodology for determining carbon content from hydrocarbon-based petroleum and petrochemical products, and for determining the uncertainty of the average carbon content as calculated from multiple samples taken during a reporting period.
The European standard, EN 14274 (available in several country-specific versions (e.g., DIN-EN 14274, BS-EN 14274-2013) (CEN 2013a), describes a fuel quality monitoring system (FQMS) for fuels that are placed on the market in a European member state and are sold directly to the customer ex pump. It makes use of 'statistical reasoning' to establish a minimum number of samples to be drawn but does not describe how the minimum number is determined. The size of a country, based on fuel sales, specifies the number of samples required for the FQMS. Where summer and winter grades exist, similar to the South African situation, sampling must be done twice per annum. It must, however, be pointed out that the purpose of the present study differed from that of a FQMS, so that the reasoning underlying this quantity of samples does not necessarily apply.
Several basically similar standards exist for the sampling of liquid fuels (primarily petrol and diesel) from retail site pumps with the aim of assessing fuel quality. These include Chapter 8.1 of the Manual of Petroleum Measurement Standards of the American Petroleum Institute (API 2019), EN 14275:2013 of the European Committee for Standardization (CEN 2013b), API 2572 (API 2013) - with similar sampling procedures to the European standard, and ASTM D4057 (ASTM 2019). BS EN 14275:2013 was used for this study.
In order to facilitate higher-tier reporting, liquid fuels used in South Africa were sampled across five provinces corresponding to area of supply origin during both summer and winter to ensure that both supply and seasonal variations, if any, would be captured. Samples were then analysed for carbon content to develop country-specific carbon dioxide emission factors for eight liquid fuel types. Calorific values of the fuels were also determined, to allow for the local conversion of methane and nitrous oxide emission factors, which are typically dependent on the process or appliance in which the fuel is used. Additionally, a calculation-based approach was used to determine a liquefied petroleum gas emission factor. This is the first such study in South Africa to determine liquid fuel combustion emission factors based on extensive fuel sampling and analysis, thereby enabling the transition of the country to a Tier 2 GHG reporting approach.
2. Methodology
The most accurate method for calculating carbon dioxide emissions from the combustion of gaseous and liquid fuels is generally considered to be the use of the actual carbon content of the fuel (API 2009). The assumption of 100% oxidation of the carbon is commonly used (EIA 2008 and subsequent years; US EPA 2008; IPCC 2006; Herold 2003; UBA 2016); even where soot or other products of incomplete combustion are present, these are assumed to oxidise over a finite number of years (EIA 2007). The determination of the carbon content of any liquid or gaseous fuel therefore directly allows the calculation of the carbon dioxide emission from the use of such a fuel.
2.1 Sample distribution
From the available national liquid fuel sales volume figures (DoE n.d.; SAPIA 2019) broken down to province level (DoE 2021) and the licensed tank volumes per province (National Energy Regulator of
South Africa (NERSA) 2020), the theoretical average turnover time for all tankage in a province can be calculated. For the coastal provinces, the result does not provide an accurate reflection of wholesale fuel depot turnover time, as the NERSA data for liquid fuel storage includes all tankage and does not allow differentiation between tanks used for the storage of crude, storage of imported refined products and wholesale supply tanks. Similarly, the result is skewed for Gauteng (GP), as fuel is distributed from tanks in Gauteng to Limpopo, North West, parts of Mpumalanga, the Free State and Botswana. For the other inland provinces, the calculated turnover time varies between 4 days (Northern Cape - considerable portions of this province are probably supplied from the Free State and the Western Cape (WC)) and 20.6 days (North West), with an average of just over 12 days. A sampling schedule was therefore developed for sampling wholesale petrol and diesel depots or tank farms in Gauteng (assuming North West and Limpopo are supplied from there), Mpuma- langa (MP), Free State (FS), KwaZulu-Natal (KZN) and WC, assuming the Eastern Cape to be supplied from KZN and WC, approximately every 12 days during both winter and summer, as the composition differs slightly between the seasons.
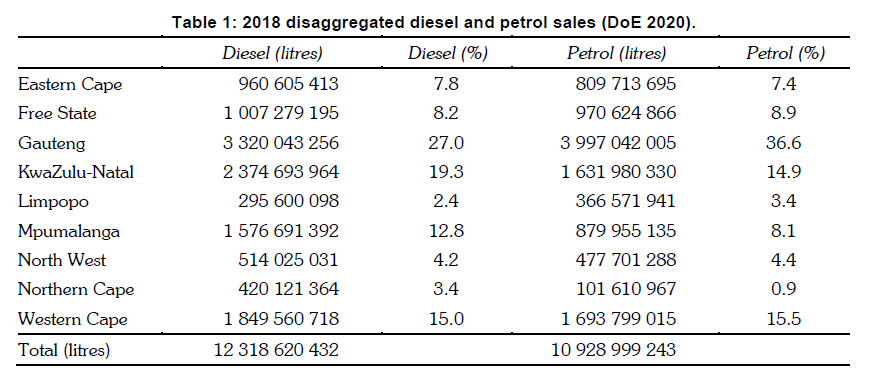
When sampling from tanks farms proved impossible for comercial and leagal reasons, the sampling schedule was set up to sample every 12 days from large retail stations along major arterial transport routes in GP (including Transnet Tarlton depot), MP, FS, KZN and WC, branded as Engen, Shell, BP, Caltex and Sasol, as well as selected samples from 'smaller' brands, in each season. The number of samples was proportional to 2018 fuel sales from each province (see Table 1) with the following assumptions (based on analysis of pipeline supply network and further informed by discussion with SAPIA (South African Petroleum Industries Association)):
• Eastern Cape supplied from KZN;
• North West and half of Limpopo supplied from GP;
• Northern Cape supplied from WC;
• Half of Limpopo supplied via MP;
• Approximately equal diesel and petrol sales;
• ULP93 used only at altitude, so not sampled in WC and KZN; ULP93 sales 20% of total petrol sales.
EN 14274 (CEN 2013a) describes the requirements for the operation of a fuel quality monitoring system and uses statistical reasoning to determine the number of samples that should be taken per fuel grade/type from retail stations for a given size of the fuel market. Although South Africa falls marginally in the 'large country' category (fuel sales greater than 15 million tons per annum), which would require 100 samples per season per grade/type, budgetary and time constraints limited petrol samples to 75 (60 of ULP95 and 15 of ULP93) and diesel samples to 75 per season, and this may reflect in somewhat larger uncertainties than anticipated in EN14274 in the final results. A smaller deviation occurred when the shutdown of the Sapref facility in Durban during the July 2021 unrest upset the fuel supply to KZN and inland provinces, and the start of the winter sampling schedule had to be delayed for normal supply patterns to be re-established. To complete the winter sampling schedule, the sampling interval had to be reduced to ten days.
For jet fuel (kerosene type for gas turbine-powered aircraft), samples were taken from the fuel depots at OR Tambo International Airport, Cape Town International Airport and King Shaka International Airport during every sampling trip, with the assumption that the Eastern Cape airports would be supplied from KZN or WC. Aviation gasoline (for piston-engined aircraft) was sampled from fuel depots at Rand Airport, Cape Town International airport, and a private airfield in GP. All aviation gasoline used in South Africa is imported.
Paraffin (illuminating paraffin for domestic burners and low-sulphur industrial process fuel) was sampled from retailers (spaza shops and hardware stores) during sampling trips to GP, WC, MP and KZN.
Residual fuel oil, or heavy fuel oil (HFO) is normally supplied by local refineries. The precipitous drop in jet fuel sales due to the Covid pandemic has, however, required local refineries to revise production configurations, which in turn has reduced local HFO supply. Significant volumes of HFO therefore had to be imported at the time of sampling. Samples of the imported stock, as well as samples of one local producer, were obtained. Samples could not be obtained from one major local producer due to company non-disclosure policy. The results for HFO given in this report are therefore not representative of the 'normal' (pre-Covid) supply situation in South Africa.
No liquefied petroleum gas (LPG) samples were taken, due to the non-availability of apparatus for determining the carbon content of gaseous samples. Instead, calculations were carried out from the composition data prescribed by SANS 1774-2018 (SABS 2018), which effectively limit butane content, and were checked by referring to analysis certificates from importers.
Although bioethanol is not currently being used as a fuel in South Africa, at the request of DFFE a number of samples were obtained from the major supplier of the bio-ethanol being used as potable ethanol.
Only a single light fuel oil sample could be obtained for analysis due to limited number of users of this fuel type.
The final number of samples per fuel type and season is given in Table 2.
A total of ten HFO samples was received from the producers/importers as follows: three from a producer in the Free State, two from a supplier importing via Cape Town, one from a supplier importing via Durban, and four from independent suppliers in Gauteng.
2.2 Analytical methodology
Sampling
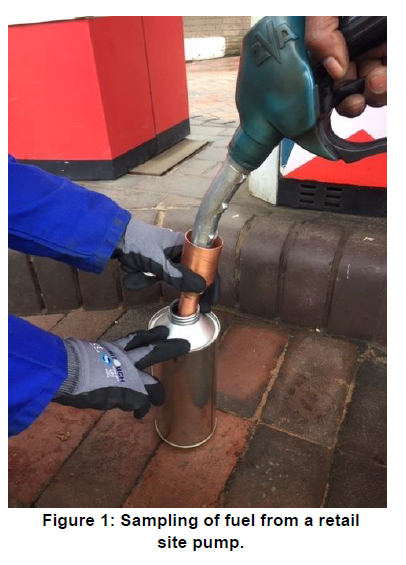
Sampling of petrol, diesel, jet kerosene and aviation gasoline was conducted according to a standard operating procedure that was developed for the project, based on EN 1475:2013 (CEN 2013b). This ensured representative samples were taken in a reproducible manner.
Copper funnels were machined at the University of Pretoria to ensure that the fuel entered the sampling container at the bottom to minimise loss of vol-atiles (submerged filling method). The funnel also overcame the problem of mismatch between the fuel dispensing nozzle and the sample container opening (Figure 1) and the fuel pump automatic valve shut-off. After an initial 4 L purge from the fuel dispensing nozzle into a jerry can, one-litre aluminium sample containers were filled to 80% capacity (to allow for thermal expansion) using the submerged filling method and were sealed with a push-fit aluminium seal and then an aluminium screwcap, to prevent the loss of the more volatile components. The samples were also protected from sunlight. In some cases, samples were provided by manufacturers directly and were thus in different sampling containers to those used by the project team for sample collection. These were assessed for suitability, and samples were transferred to the standard containers, if necessary, prior to transportation to the laboratory. A tamper-proof seal was placed over each cap to provide proof of intact chain of custody from sampling to transporting to the analytical laboratory.
Samples were labelled with the date and time, and a unique sample identification number was given to each, containing identifiers for the type of fuel, province, city, manufacturer, and season. Samples were then stored at ambient temperature prior to transportation by a suitably qualified company to the laboratory for analysis. Samples were accompanied by completed sample delivery sheets.
In addition to samples, certified reference materials (CRMs) were also submitted to the laboratory as quality control samples. For liquid fuels the CRM was 2,2,4-trimethylpentane or isooctane (99.8% purity, purchased from Sigma-Aldrich, South Africa), which has a total carbon content of 84.1% and a density of 0.692 g/mL at 25 oC. For HFO sample analysis the CRMs were a residual fuel oil (Leco, Part no. 502-850) with an 83.86% carbon content and a paraffin oil (Leco, Part no. 502-901) with a carbon content of 86.4%.
Analysis
Analysis of all samples was conducted at the accredited SGS South Africa (Pty) Ltd Oil, Gas and Chemicals Division Laboratory in Durban. This laboratory takes part in inter-laboratory proficiency testing schemes for diesel, petrol and fuel oil organised by the Institute for Inter-laboratory Studies (iis, Netherlands) and the South African Bureau of Standards (SABS).
Determination of total carbon was performed using an SGS in-house method (NDIR-1) based on ASTM D5291 (ASTM 2016) and ASTM D7662 (ASTM 2020). This method employs an elemental analyser and is based on nondispersive infrared (NDIR) spectroscopy. A cooled autosampler injects 10 of sample onto quartz paper, which a piston then transfers into a furnace at 1050 oC. Combustion occurs in an oxygen-rich environment to produce carbon dioxide. The combustion products are then dried, and the carbon content is determined by NDIR.
Isooctane (EMSURE, Analytical Grade, Supelco) is used for calibration (0, 10, 20 and 40 injections) and quality control purposes. Each sample was analysed twice, with a 3% allowable precision. As part of the method validation, repeatability (six analyses by the same laboratory technician on the same day) and reproducibility (six analyses each by four different laboratory technicians on different days) were tested. The method detection limit is 87,26 carbon and the quantification limit is 378.91 carbon.
Possible contributors to the measurement uncertainty are: reference materials, calibrated instruments, humidity, temperature, sample matrix, syringe contamination, laboratory analyst, sample homogeneity, sample age, and sample storage. The overall uncertainty of measurement for carbon was 4.1033 g/L.
The method was adapted for the analysis of the total carbon content of more viscous heavy fuel oil (HFO) samples. In this case a single-point calibration using a HFO standard was used. The method was verified by analysis of a residual fuel oil and a paraffin oil CRM.
Density of selected winter and summer fuel samples was determined by method ASTM D4052 (ASTM 2018). This method is suitable for petroleum distillates and viscous oils (including gasoline and gasoline-oxygenate blends, diesel, jet, base stocks, waxes and lubricating oils) and is based on monitoring the change in oscillating frequency of an oscillating U-tube containing the sample.
For LPG, sampling and analysis facilities were not available commercially. Calculations based on the allowable composition in South Africa were therefore carried out to determine the range of carbon content values from allowable composition as provided in SANS 1774:2018 (SABS 2018). This standard provides the maximum allowable content of total C2 compounds, ethylene and other dienes, as well as the allowable content of hydrocarbons heavier than C4. The allowable range of vapour pressures at 37.8 °C limits the maximum butane (C4) content to 50% on a normalised (absence of heavier and lighter hydrocarbons) basis. Calculations were therefore carried out for a range of mixtures from 50:50 propane: butane to 90:10 with no impurities and with the maximum allowable impurities.
Calorific value of selected winter and summer fuel samples was determined by method ASTM D4868 (ASTM 2010). In brief, the sulphur, water and ash content as well as the density of the fuel sample are determined experimentally. These results are then used to calculate the estimated heat of combustion of the sample using an empirical correlation. Separate equations are used to determine the gross heat of combustion and the net heat of combustion, respectively. The method states that a comparison of the experimental and empirical methods on 199 samples showed the empirical results to be within 0.35 MJ/kg of the experimental results at the 95% confidence level.
2.3 Data interpretation
Statistical analysis
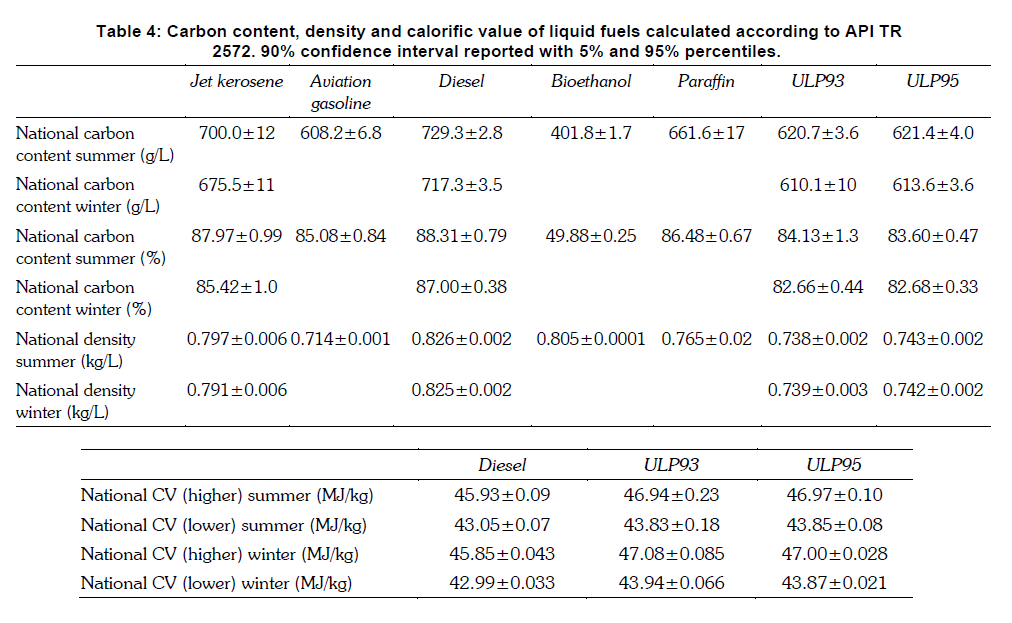
Two approaches were used to provide descriptive statistics reflecting expected fuel property values within a specific confidence interval. The more basic approach was to calculate the values of carbon content measured properties as per the guidance provided in the API Technical Report 2572 and reported for a confidence interval of 90% (between 5% and 95% percentiles). This procedure assumes a Gaussian (normal) distribution of measurements for all properties and may be viewed as providing adequate proxies for measured values. However, as the assumption of normality could not be confirmed in all cases, a second approach was used, which included comprehensive statistical analysis to accommodate both Gaussian and non-Gaussian distributions and also included a bootstrapping technique to provide additional data for analysis where low sample numbers were an obstacle. This more sophisticated approach did not, however, provide additional meaningful insights that were useful to the objective of this project (emission factor determination) and the results are therefore not reported here.
The two approaches were applied on the carbon content, density, and calorific value properties of the fuel products under consideration for summer and winter supply periods. The results of the basic statistical analysis are presented in Table 4.
Calculation of emission factors
The API Compendium of Greenhouse Gas Emissions Methodologies for the Oil and Gas Industry (API 2009) provides example calculations for CO2, CH4, and N2O emissions and was used as a guideline for the emission factor calculations. The CO2 emissions for the different fuel types was determined from the carbon content in the fuel:
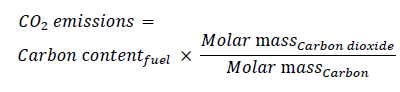
where the emission figures are given in g/litre or g/kg, and the molar masses are given in g/mole. The uncertainty of the carbon content and the emission factors given in this report should be taken into account in determining the overall uncertainty of the GHG emission inventories (API 2009)
3. Results
3.1Distribution of samples by type and location
The number of samples, after removal of outliers in terms of total carbon content and density measure ments and disaggregated by area of fuel supply origin, is given in Table 3.
3.2Fuel properties calculated according to API TR 2572
Calculations according to this method assume normal (or Gaussian) distribution for all properties. Confidence limits can then be calculated from the number of samples in each group, using Student's t-test for the smaller sample sizes (Gosset 1908) or Fisher's test for the larger sample sizes (Fisher 1954). For this study a 90% confidence interval (samples within 5% to 95% percentiles) limits were used. For the residual fuel oil samples, this method provided a carbon content of 85.93±1.58% and a density of 0.994±0.12 g/L. For LPG, the corresponding carbon content is 819.2 (817.6 - 820.6) g/kg. Results for the other fuels are provided in Table 4.
To obtain an average emission factor value for ULP93 and ULP95, the relative sales volumes for these products must be considered. For the years 2018 to 2021, the volumes of ULP93 as a percentage of the total petrol sales were 19.7%, 19.7%,
18.7% and 17.0% respectively (SAPIA 2022). Although the values for 2020 and 2021 may have been influenced by emergency regulations, a declining trend is evident. Results presented here have a weighting based on the most recent data, viz. for 2021.
Regarding the summer/winter distribution, the percentage sales of each product per season for the same years (2018-2021) are given in Table 5.
The years 2020 and 2021 may not be typical of a 'normal' sales pattern. Equal summer/winter volumes have been assumed for both types of fuel.
Using the above assumptions for the ULP93/ ULP95 split and the summer/winter distribution, the annual average emissions factors for petrol and diesel are given in Table 6. The right-hand column in Table 6 gives the CO2 emissions calculated from the Technical Guidelines for Monitoring, Reporting and Verification of Greenhouse Gas Emissions by Industry (DEA 2017b).
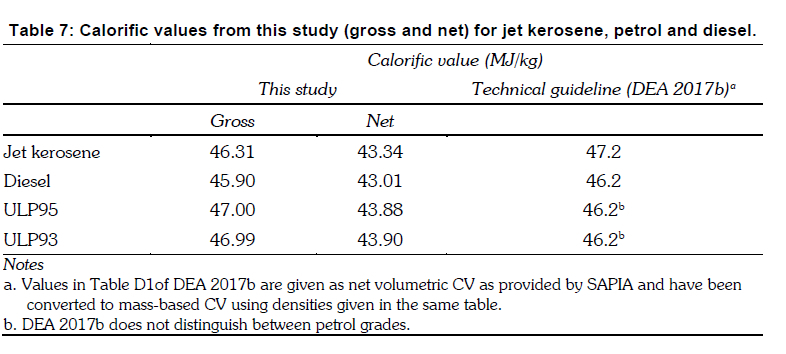
3.2.1 Conversion to energy specific units of empirical emission factors for methane and nitrous oxide As previously indicated, these emission factors are generally converted to specific units from empirical appliance specific factors using the calorific value of the fuels used. Table 7 provides the average calorific value for each of the fuels tested. Estimates of the uncertainty were given in section 3.2. To convert volumetric CV previously given to the values in Table 7, the seasonal-weighted average measured density for each sample was used. Note that the CV was not measured for aviation gasoline, bioethanol, paraffin, residual fuel oil and light fuel oil. Jet kerosene had a single measurement. In all of these cases, the difference between gross and net CV is somewhat higher than the default value of 5% allowed for by the IPPC methodology (API 2013). For LPG, the previously described calculation procedure yielded a lower or net CV of 46.29 MJ/kg and a higher or gross CV of 50.32 MJ/kg.
Methane and nitrous oxide emission factors for the various fuels can now be estimated using the calorific value and the emission factors in kg/MJ for various processes and appliances in various literature sources, of which EPA (2021) is probably the most frequently updated and complete. Fuel properties of the current samples may differ slightly from the fuels used to determine the literature figures. However, appliance design and particularly air-fuel ratio will be the determining factor in methane and nitrous oxide emissions and so fuel properties other than CV are a minor source of error. Furthermore, average loading of, say, internal combustion engines will vary enormously in operation and, given that this is impossible to determine on a national scale, use of generalised process and appliance emission factors converted using a local calorific value can be considered adequate for national Tier 2 emission factors.
4. Conclusions
Carbon dioxide emission factors were determined experimentally from samples representative of winter and summer fuel composition in South Africa. Country-specific carbon dioxide emission factors obtained in this study are similar to the IPCC default values and the values specified in the DEA Technical Guideline DEA 2017b). For the calorific values, the values differ somewhat from the values given in the Technical Guideline (DEA 2017b), which were based on density values provided by SAPIA.
In terms of future refinement of these emission factors, it should be noted that the heavy fuel oil samples that could be obtained during the course of this study were not representative of normal market conditions. It is thus recommended that additional samples are analysed once market conditions have returned to normal, to ensure that the emission factors are representative. A range of values for liquefied petroleum gas was calculated from the allowable ratio of butane to propane locally. While the composition results were confirmed by analysis certificates for local samples and the variance of the calculated results is small, it is recommended that sampling and analysis of LPG be repeated when gas analysis methods are available. Relative sales volumes of ULP93 and ULP95, as well as the summer to winter sales distribution for both types of petrol should be monitored going forward, in order to determine whether a revised weighting of emission factors is necessary.
The country-specific carbon dioxide emission factors for liquid and gaseous fuels which have been determined here enable the transition of South Africa to higher-tier greenhouse gas emission reporting in line with international standards and trends, and will assist with the transition to a low-carbon economy in accordance with the United Nations Sustainable Development Goals.
Acknowledgements
The authors acknowledge the University of Pretoria for making facilities available, staff members of DFFE for coordinating the project, the Gesellschaft für Internationale Zusammenarbeit and the World Resources Institute for funding. Project interns Sussan-Mari Botha, Marilize Gro-bler and Brian Mdhluli took initiative where necessary and showed unfailing good spirits.
Author roles
G. Kornelius: Methodology, validation, formal analysis, data curation, draft paper, review, editing P. Forbes: Methodology, validation, formal analysis, review, editing
T. Fischer: Methodology, validation, formal analysis, review, editing
M. Govender: Formal analysis, review, editing
References
API [American Petroleum Institute]. 2009. Compendium of Greenhouse Gas Emissions Estimation Methodologies for the Oil and Natural Gas Industry. API, Washington DC. [ Links ]
API [American Petroleum Institute]. 2013. API Technical Report 2572. Carbon Content, Sampling, and Calculation. 1st ed. API, Washington DC. [ Links ]
API [American Petroleum Institute]. 2019. Manual of Petroleum Measurement Standards Chapter 8.1: Standard Practice for Manual Sampling of Petroleum and Petroleum Products. 5th ed. API, Washington DC. [ Links ]
ASTM D4052-18. 2018. Standard Test Method for Density, Relative Density, and API Gravity of Liquids by Digital Density Meter. West Conshohocken, PA: ASTM International. [ Links ]
ASTM D4057-19. 2019. Standard Practice for Manual Sampling of Petroleum and Petroleum Products. West Conshohocken, PA: ASTM International. [ Links ]
ASTM D4868-00 (Reapproved). 2010. Standard Test Method for Estimation of Net and Gross Heat of Combustion of Burner and Diesel Fuels. West Conshohocken, PA: ASTM International. [ Links ]
ASTM D5291-16. 2016. Standard Test Methods for Instrumental Determination of Carbon, Hydrogen, and Nitrogen in Petroleum Products and Lubricants. West Conshohocken, PA: ASTM International. [ Links ]
ASTM D7662-15 (Reapproved). 2020. Standard Test Method for Carbon Content in Carbon Black Feedstock Oils. West Conshohocken, PA: ASTM International. [ Links ]
CEN [European Committee for Standardization]. 2013a. EN 14274:2013 Automotive fuels - Assessment of petrol and diesel quality - Fuel quality monitoring system (FQMS). [ Links ]
CEN [European Committee for Standardization]. 2013b. European Committee for Standardization. EN 14275:2013 Automotive fuels - Assessment of petrol and diesel fuel quality - Sampling from retail site pumps and commercial site fuel dispensers [ Links ]
DEA [Department of Environmental Affairs]. 2011. South Africa. National Climate Change Response White paper. https://www.gov.za/sites/default/files/gcis_document/201409/nationalcli-matechangeresponsewhitepaper0.pdf. Accessed 14 December 2021. [ Links ]
DEA. 2017a. Department of Environmental Affairs, South Africa. National Greenhouse Gas Reporting Regulations. Government Notice 275, Government Gazette 40762 of 3 April 2017. [ Links ]
DEA. 2017b. Department of Environmental Affairs, South Africa. Technical Guidelines for Monitoring, Reporting and Verification of Greenhouse Gas Emissions by Industry. A companion to the South African National Greenhouse Gas Regulations. Version TG-2016-1. [ Links ]
DEE. 2017. Department of Energy and the Environment Australia. National Greenhouse Gas accounts factors.https://www.dcceew.gov.au/climate-change/publications/national-greenhouse-accounts-factors. Accessed 14 December 2021 [ Links ]
DFFE. 2022. Department of Forestry, Fisheries and the Environment, South Africa. Climate Change Bill B9-2022. [ Links ]
DoE. n.d.. Department of Energy, South Africa. Overview of petrol and diesel market in South Africa between 2009 and 2018. Energy Data Collection, Management and Analysis Directorate. [ Links ]
DoE. 2021. Department of Energy, South Africa. 2020 Quarterly Disaggregated FSV Data (Magisterial District Level) National Aggregated Fuels Sales Volume. http://www.energy.gov.za/files/media/me-dia_SAVolumes.html Accessed June 2021 [ Links ]
EIA. 2007. US Energy Information Administration. Instructions for Form EIA-1605,https://www.re-ginfo.gov/public/do/DownloadDocument?objectID=2653501. Accessed Jan 2022 [ Links ]
Fisher, R.A. 1954. Statistical Methods for Research Workers.London: Oliver and Boyd. [ Links ]
Gosset, W.S. 1908. The probable error of a mean. Biometrika.6 (1): 1-25 [ Links ]
Herold, A. 2003. Comparison of CO2 emission factors for fuels used in Greenhouse Gas Inventories and consequences for monitoring and reporting under the EC emissions trading scheme. European Topic Centre on Air and Climate Change Paper 2003/10 [ Links ]
IPCC. 2006. Intergovernmental Panel on Climate Change (IPCC), Guidelines for National Greenhouse Gas Inventories, Volume 2, Chapter 1: Introduction, and Volume 2, Chapter 3: Mobile Combustion. [ Links ]
IPCC. 2019. Refinement to the 2006 IPCC Guidelines for National Greenhouse Gas Inventories [ Links ]
NERSA. 2020. Petroleum Storage Facility Database Licensed activities in terms of the Petroleum Pipelines Act, 2003.https://www.nersa.org.za/wp-content/uploads/2021/01/Petroleum-Storage-Facilities-Decem-ber-2020.pdf Accessed 14 June 2021. [ Links ]
National Planning Commisssion. 2012. National Development Plan 2030: Our Future - make it work. Pretoria: Office of the Presidency. [ Links ]
SABS. 2018. South African National Standard SANS 1774:2018 Ed 2.01 Liquefied petroleum gases. Pretoria, South African Bureau of Standards. [ Links ]
SAPIA. 2019. South African Petroleum Industries Association. Annual report 2019. [ Links ]
SAPIA. 2022. SAPIA personal communication. [ Links ]
UBA. 2016. German Environment Agency (Umwelt Bundesamt) CO2 Emission Factors for Fossil Fuels. Report Climate Change 28/2016. [ Links ]
US EPA. 1995. U.S. Environmental Protection Agency. AP-42 Compilation of Air Pollutant Emission Factors, Volume I: Stationary Point and Area Sources Office of Air Quality Planning and Standards, Fifth Edition, January 1995, with Supplements A, B, and C, October 1996, Supplement D, 1998, and Supplement F, 2000, and updates 2001 to present. [ Links ]
US EPA. 2005. Average carbon dioxide emissions resulting from gasoline and diesel fuel. EPA Document 420-F-05-001. [ Links ]
US EPA. 2008. U.S. Environmental Protection Agency, Climate Leaders Greenhouse Gas Inventory Protocol Core Module Guidance: Direct Emissions from Mobile Combustion Sources, EPA430-K-08-004. [ Links ]
US EPA. 2020. EPA Center for Corporate Climate Leadership. Greenhouse gas emissions hub. Emission Factors for Greenhouse Gas Inventories 2021. https://www.epa.gov/climateleadership/ghg-emission-factors-hub. Accessed 16 August 2022. [ Links ]
US EPA. 2021. U.S. Environmental Protection Agency. EPA Center for Corporate Climate Leadership: Emission Factors for Greenhouse Gas Inventories, 2021 and previous versions. https://www.epa.gov/cli-mateleadership/ghg-emission-factors-hub. Accessed Feb 2021 [ Links ]
* Corresponding author: Tel.: +27 (0)82 925 9569

