


Services on Demand
Article
 English (pdf)
 Article in xml format
 Article references
Indicators

Related links
-
 Cited by Google
 -
 Similars in Google
Share

 Permalink
Journal of Energy in Southern Africa
On-line version ISSN 2413-3051
Print version ISSN 1021-447X
J. energy South. Afr. vol.33 n.2 Cape Town May. 2022
http://dx.doi.org/10.17159/2413-3051/2022/v33i2a13018
ARTICLES
Rural electricity system reliability: Do outages exacerbate spending on backup fuel in rural Tanzania?
Bikolimana MuhihiI, *; Lusambo Leopold PaschalII
IMoshi Co-operative University, Tanzania
IISokoine University of Agriculture, Tanzania
ABSTRACT
Most rural Tanzanians have had no access to electricity. But efforts have been made to remedy this, including an extension of the national grid and the establishment of independent power plants in rural areas. The result is a recordable increase of people with access to electricity; however, the realization of reliable power for both consumers and suppliers has remained a puzzle. This paper out to examine the reliability of rural electricity systems based on consumer measures; to find out determinants for system reliability; and examine how outage incidences exacerbate households' expenditure on backup fuels. Reliability was assessed through a stepwise approach, where a general system reliability index and trend analysis were used. It was found that system reliability was enhanced because consumers only spent 6-15 days per year without electricity due to outages. These are tolerable outages, given the volatility of the rural system. Further, weather, fire outbreaks in bushes, and lightning, significantly determined system reliability. Nonetheless, despite the reasonable reliability, some outage incidences had dragged consumers into unplanned expenditure on backup fuel. It is recommended that there should be a continuous inspection of the system, and the use of supervisory control and data acquisition device on the distribution line for accurate monitoring is imperative.
Keywords: Reliability, domestic expenditure, backup fuel, electricity system
1. Introduction
The reliability of electricity has emerged as a global challenge in modern development, and has attracted the attention of development planners, utility companies, and consumers (Kojima & Trimble, 2016; Nikzad & Mozafari, 2014). Both poorly and highly electrified countries suffer from reliability problems (Gertler et al., 2017), though at different levels. To reap the full benefits from electricity, its reliability must be assured. Indeed, a reliable electricity system has to be available mostly to satisfy consumers (Marvin & Hoyland, 2004). Additionally, Bhatia and Angelou (2015) argue that reliable power has to be adequate in quantity, available when needed, of good quality, convenient, affordable, and meeting health and safety standards.
Access to reliable electricity is more than being connected (Chakravorty et al., 2012), because, in the end, consumers do not want just electricity but an affordable and reliable supply (URT, 2015). Different reliability thresholds exist. In Europe, a system interruption not greater than three minutes is considered reliable (Campbell, 2012); while in the USA it should not exceed five minutes. Eskom in South Africa considers interruption of less than one minute as reliable for high voltage networks and less than five minutes for medium voltage (Chatterton, 2014). The Australian Energy Market Commission (2014) reports thresholds for sustained interruption as being two or more minutes, with momentary interruptions lasting less than two minutes.
Kaufmann (2013) and Gertler et al. (2017) contended that electricity system reliability is measured by the system average interruption frequency index (SAIFI), based on the average number of times per year the supply to a customer is interrupted. Similarly, the system average inter-ruption duration index (SAIDI) represents the average amount of time (seconds) per year that a power supply to a customer is interrupted (Gertler et al., 2017). The metrics are data-sensitive, as described by Chatterton (2014) that they depend on precise data from supervisory control and data acquisition (SCADA) or the annual validation and auditing of the paper operation log. The different electricity systems have varying SAIDI and SAIFI values where the lowest values indicate high reliability (Kaufmann, 2013). This was confirmed by Taneja (2016) through values of the electricity system in Nairobi which had a SAIFI of 23 and SAIDI of 216.3 hours. For these values, it can be viewed as standard reliability. However, SAIDI and SAIFI measures are criticized for taking into account every outage incidence (Shivakumar et al., 2014).
Electricity systems in countries like the USA had SAIDI for eight hours (480 minutes) in 2017, indicating a high degree of reliability (US Energy Information Administration, 2018). In Pakistan, SAIFI was 232 and SAIDI 8, 149 minutes per year (Ali, 2016); in urban areas, the outage was six to eight hours while rural areas had ten to twelve, which means that reliability in rural areas remains a challenge. It is reported that reliability in most of Africa lags. For example, in 2014 Nigeria had 32.8 outage hours per month, while Burundi had 16.6 hours, the Central Africa Republic 29, and Egypt 16.3 hours (Energy and Environmental Service, 2015). Tanzania had load-shedding of up to 20.3 hours from 2012 to 2016 (Msyani, 2016), this was orchestrated by unprecedented long-time droughts. For one month (June 2018) Tanzania had an unplanned outage of 1 044 hours, with outage frequencies of 1 640 (Energy and Water Regulatory Authority, 2018). Reliability is a key question in electricity consumption for domestic and productive use (Rud, 2012). Reliable power can improve public safety (Dinkelman, 2011), education, and health services (Savacool, 2014; Ramachandran, Shah, and Moss, 2018), increase opportunities for jobs (Küfeoglu, 2015), and reduce dependence on unclean energy for backup lighting sources. The efforts for rural electrification in Africa have to go inter alia with system reliability. For that, Panos et al. (2016) reported that, despite poor access to electricity (12-18%) in most rural and urban areas of sub-Saharan Africa, the question of reliability remains a serious concern. Moreover, Keneth et al. (2017) also reported survey results for 21 sub-Saharan countries where capital cities had a power connection of more than 75% (except Lilongwe). They further reported that less than 20% of the connected, especially in Lagos, reported electricity systems working most of the time. This unreliability could exacerbate expenditure on household backup fuels for schooling children, domestic activities, and enterprise operations (Abotsi, 2016). As for reliability, the questions remain; first, what is the status of reliability in rural areas? second, do outage incidences hike expenditure on backup fuels?
According to Scott et al. (2014), in developing countries in Africa, on average electricity was cut 6.3 times with 4.7 hours while South Asia's outage was 25 times with 5.3 hours of the typical outage in a month (Min et al., 2017). Studies have reported the effects of unreliable power on businesses (manufacturing and processing firms) than on households (Allcott et al., 2016; Fisher-Vanden et al., 2015; Abeberese, 2013). In business, Allcott et al. concluded that unreliable power affects an enterprise's operations. Additionally, Shivakumar et al. (2014) claimed that unreliable power had led to self-backup generation, with 43.6% of firms in sub-Saharan Africa owning a generator: Senegal with the highest proportion (90.7%), followed by Nigeria (85.7%), compared to the world proportion at 31.6%.
Access to reliable electricity is significant in a rural economy (Muhihi & Lusambo, 2022). Tanzania, due to unreliable electricity lost about 10% of GDP in 2010, with 7 341 people losing jobs in six regions (Confederation of Tanzania Industries, 2011). Due to complex economic and social activities, the reliability of electricity is also a major concern in urban areas (Mwakapugi et al., 2010). However, scrutinizing reliability in rural areas and the determining factors carries an important meaning because domestic consumption of energy in Tanzania accounts for 75%, while 14% is for industry (the United Republic of Tanzania, 2015). Unreliable electricity supply does not only affect enterprises but also education for night studies, food processing, and storage (Herman, 2014). It can lead to energy-switching, and extra expenses become especially obvious to consumers in rural areas, where there is great income inequality (Lusambo, 2016a). Switching to sources like candles, kerosene, and biomass has environmental problems (Lusambo, 2016b). It increases indoor air pollution, which is a serious health hazard (Chen & Modrek, 2018). It was reported that in Tanzania 20 353 people died due to household air pollution in 2012 (Stiles and Murove, 2015).
In Tanzania, measures to provide reliable power became central in the 2000s, with the establishment of legal and institutional frameworks such as the Rural Energy Agency (REA). In collaboration with the Tanzania National Electricity Company (Tanes-co), REA has facilitated increased rural access to electricity from 2% in 2003 to 49% in 2017 (Rural Energy Agency, 2017), through the extension of the national grid and the establishment of mini-grid projects in rural areas. For instance, Odarno et al. (2018) reported that about 109 mini-grids are located in 21 regions. The mini-grids were established to ensure that rural people are relieved from time-consuming and health dangerous sources of energy. It also aimed at ensuring the reliability of the electricity supply.
The reliability threshold in Tanzania requires annual SAIFI to be less than three interruptions per customer per year, SAIDI less than 650 minutes per customer per year, and a customer interruption duration index (CAIDI) of less than four minutes (0.01 hours) per customer per interruption event per year (Energy and Water Regulatory Authority, 2018). Despite this threshold and efforts to improve supply, rural electricity system reliability is inconsistently assessed and reported due to its fragile economies (Mensa, 2016; Oseni and Pollit, 2015; Abeberese et al., 2017; Moyo, 2012; Arlet, 2017).
In light of all these factors, this paper assesses the reliability of the rural electricity system, discussed the factors needed to make it reliable, and examined the effects of outages on expenditure for backup fuels in the household.
1.1 The multi-tier framework for electricity system reliability
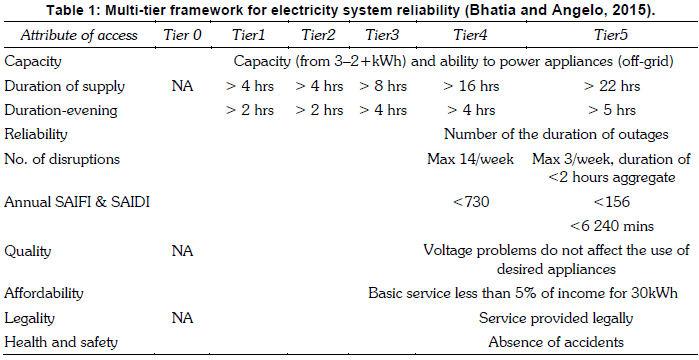
The multi-tier framework (MTF) was developed in 2013 by the World Bank in the role of Sustainable Energy for All (SE4ALL). It redefines energy access to fill the gaps in the global tracking framework binary access measurement metrics, such as whether a household has access to electricity and cooking or non-solid fuel. MTF provides power quality descriptions for different tiers of users (Bhatia and Angelou, 2015). As shown in Table 1, it offers relief in measuring various aspects of power quality. The MTF is one of the most recently used frameworks in energy studies; for example, Kojima and Trimble (2016) used the framework in assessing power quality.
The MTF in this study guided the assessment of electricity system reliability, based on important metrics and indicators encompassing the following: duration of supply has to be between 8 and 22 hours for consumers in Tiers 3, 4, and 5; the system must provide at least 4-5 hours of evening supply; maximum disruptions for unplanned incidents are 14 and 3 per week for Tier 4 and 5, coupled with annual SAIFI less than 730 and 156 respectively.
2. Methodology
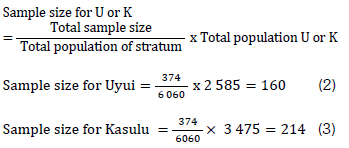
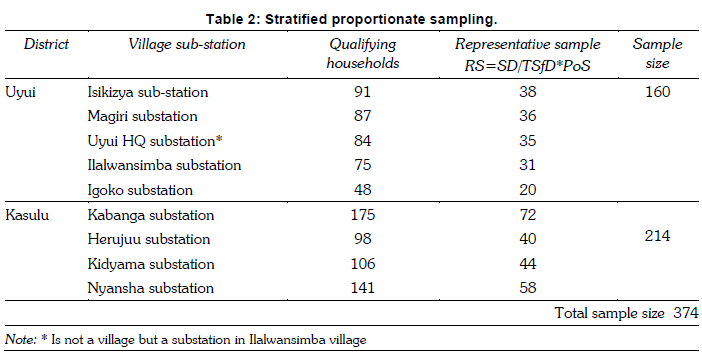
The study was conducted in Kasulu and Uyui districts, which are electrified through the REA and Tanesco, and are the first beneficiaries of rural energy through mini-grids and grid extension. A cross-sectional survey was used, as it fits better in multiple variable studies and in studying prevailing characteristics in a population (Hemed, 2015). The unit of analysis was households connected to electricity for at least two years. The sample size was 374 households (see Table 2), arrived at by using Yamane's (1967) sample size formula (see Equation 1). The sample was drawn from eight villages that were selected as being the first to be electrified in the districts. For a fair representation, a proportionate stratified sampling technique was used to obtain sample representatives from each district and village (Equations 2 and 3). Finally, a random number table was used to select respondents (heads of households) from an updated list of electricity customers.
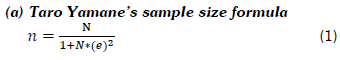
where n = sample size; N = total population of the connected households qualifying to participate in the study; e = ±0.05 precision; and 1= constant.
The household population in Uyui district was 2 585 while Kasulu district had 3 475 households, giving a total of 6 060. Therefore,
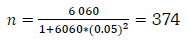
The sample size (n) used was 374.
(b) Proportionate sampling procedures from Uyui (U) and Kasulu (K):
(c) Stratified proportionated sampling for a representative sample from the villages and sub-station
The common formula devised was as follows:
Representative sample (RS) for each village or sub-station = Sample for district (SD) divided by the Total sample for two districts (TSfD), multiplied by the Population of the sub-station or village (PoS) [RS=SD/TSfD*PSS]
Several tools were used to collect data. First, a questionnaire was used to gather quantitative data on reliability, the income of the household, and expenditure on backup fuels. Second, key informant interview was applied to three key informants: transmission and distribution engineers (TaDE), regional and district managers for Tanesco. Third, a focus group discussion (FGD) was also applied: four gender-sensitive FGDs with eight members as suggested by Van Eeuwijk & Angehrn (2017) were conducted to collect data on the perception of respondents on system reliability. Content validity and reliability of data collection tools were ensured through pre-testing and pilot testing. Some questions were rephrased or deleted due to ambiguity and redundancy. Nonetheless, internal consistency reliability was ensured through Cronbach's Alpha, where 11 items were tested and scored 0.68 to 0.83, which are acceptable values (Field, 2009).
To assess the reliability of electricity, trend analysis for annual unplanned power outages in Kasulu and Uyui District was conducted by using primary data that were auto-recorded and stored in the utility system (outage data). The raw data were requested from district managers. Furthermore, the general electricity system index (GESRI) was developed from the summed score of eleven items of five-point Likert scale measures. The response scores (values) on each item were summed, then descriptive statistics were conducted to obtain the minimum, mean and maximum values considered as a decisive index for reliability. Thus, GESRI mean score was 30, with minimum 29 and maximum of 51. Therefore, the index score was 1. Low reliability was 0-29; moderate reliability 30; high reliability 31-51. Although SAIDI and SAIFI are common indices for electricity system reliability, they are criticised for taking into account all incidences of outages, regardless of the time of day, and do not reflect the perceptions of customers (Herman et al., 2014). Thus, typical SAIDI and SAIFI were not used; rather system average interruption frequency (SAIF) and system average interruption duration were used (SAID). The use of and index requires precise data collection on distribution and how each individual was affected outage on the system.
Furthermore, the one-way analysis of variance (ANOVA) and Tukey honestly significant difference post-hoc I-J test of means difference were used to analyse the variability of means scores between power reliability thresholds. The only assumption considered for ANOVA was assuring that the dependent variable is measured on the interval (Field, 2009); ANOVA is, however, robust to normality assumptions. The ordered logistic regression model (OLRM) was used to analyse predictors of power system reliability based on direct control by the utility. The OLRM formula suggested by Hosmer and Lemeshow (2000) is given in Equation 4.
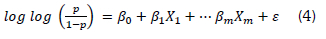
where log ( ) = the odds (logit) of being in lower against higher reliability of electricity; β1_ ßm are the coefficients of independent variables influencing reliability of electricity; X±...... Xm, is the vector of categorical predictor variables (see Table 3);
β0 is the intercepts that vary from one level of power reliability to another; and £ is an error term. On the assumptions, the dataset had already passed two; the dependant variable was ordered while the predictor variables were categorical (Klein and Kleinbaum, 2010). To check the multicollinearity, the correlation plots for each variable were observed and there was no correlation above 0.46 for the observed set of variables.
To capture the effect of outage on domestic expenditure on lighting fuels, two procedures were followed. First, using a self-reported data on expenditure of backup fuel, a descriptive statistic was run to gauge the median expenditure on electricity alone (after electricity connection). This was followed by expenditure on lighting fuel before electricity connection at the household. Then, a median aggregated expenditure for backup fuel and electricity was established. On self-reported expenditure of backup fuel, despite the debate about recall bias (Bell et al., 2016), this assumed absence and or tolerable level of biases. Although Bell et al. (2019: 341) argue that 'quantitative data are arguably more prone to recall biases given the presumption of their specificity and objectivity, as well as humans' difficulty in remembering such specific details with precision, but it is always not like that because recall depends on the intensity of importance of the fact or ideas. However, to minimise the recall bias, respondents were asked to self-report the lowest amount they had spent on energy at different times this was also supported by Bell et al. (2019) that, in case of expenditure, there is no significant difference in covariance of variations across the time differences in recalling. This implies that expenditure on key factors is always remembered with less regard of recall time. Second, the independent median values were subjected to a paired sample t-test to depict the statistical difference as median differences. While the paired sample t-test is used to test the difference of means for a given variable of the data set (Field and Hole, 2003), this study had novelty approach, independent value of the median expenditure was subjected to t-test, purposely to attain the value differences than making inferences on visually inspected data.
3. Results and discussion
3.1 Trend analysis for electricity system reliability
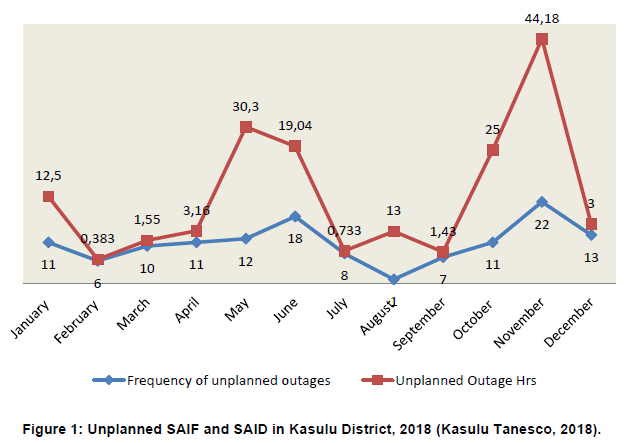
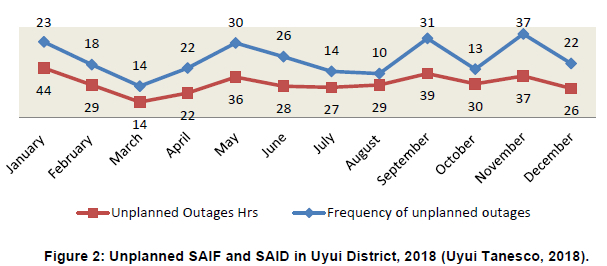
Using primary data retrieved from auto recorder system, a confirmatory trend analysis (Figures 1 and 2) was carried out on unplanned SAID and SAIF. Using auto-recorded data from the Tanesco district office, the results showed that the system was reliable based on the duration and frequency of outages.
Figure 1 shows that the trend for unplanned outage incidences varied in all months. analysis shows that unplanned SAID was 154.27 hours (9 256.2 minutes) while SAIF had 130 incidences. The SAID value means that consumers had outages equivalent to six days for the year 2018. The minutes of the outage are above the standards in MTF for consumers in Tier 5, which state outage minutes of 6 240 for reliability prevalence. The marginal difference in minutes of outages was tolerable and suggest that the system was reliable to consumers. According to MTF, a reliable system should have SAIF incidences less than 730 (Tier 4) and 156 (Tier 5). The standard relevance of the values shown in Figure 1 and those in MTF indicate the reliability of the system in Kasulu district.
Regarding Uyui district, the finding (Figure 2) shows that unplanned SAID was 361 hours (21 660 minutes), equivalent to 15 days, while the SAIF incidences were 260 per year. Thus, consumers in Uyui had more dark days than those in Kasulu for the year 2018. The disparity could be due to difficulties in managing complex national grid faults as these can be triggered by out-region factors to cause outages. The better reliability in Kasulu was due to dependence on modern IPPs operating on auto-shift and self-servicing modes. Also, the small coverage areas made it simple to manage the distribution and transmission systems. Information from the key informant and FGD on the common time of power outage revealed that they were mostly in the evening (up to more than the four hours stipulated in the MTF). From this perspective, it is valid to infer that evening supply is important in areas where electricity is heavily used for domestic lighting. The inference is backed by the results from the Electricity Supply Monitoring Initiative (ESMI) (2017), where Kinondoni and Ilala districts had experienced five hours of evening supply. Although outage (Figure 1) was noted but an ensured evening supply has attracted a reliability conclusion among the consumers in the study areas.
The results in Figures 1 and 2, when reflected against the MTF, indicates that some components of reliability were met while the rest were not. However, that cannot imply unreliability, given that the consumers were less affected. For instance, MTF indicates that the maximum disruption is 14 per week; looking at the results in the two trend analyses the system disruptions were fewer than 14 per week. Further, when respondents were asked if the electricity system ever caused any accidents related to electricity shocks, 10% had had an accident (meter defectiveness and shocks on the domestic appliance) resulting from system disruptions. This minimal presence of accidents cannot qualify the system as unreliable. Yet, for domestic consumption, there were no voltage fluctuations, because, when asked, 95% of the respondents reported all domestic appliances working properly. All of these indicate that despite some minor deviation of the results from the MTF standards the system is viewed as reliable. This reliability inference is based on local consumers and MTF criteria; thus, it is different from an inference drawn by Sengi and Ntagwirumugara (2021) when they found unreliable of electricity in Goma, DRC. Their inference was, however, based on international standards.
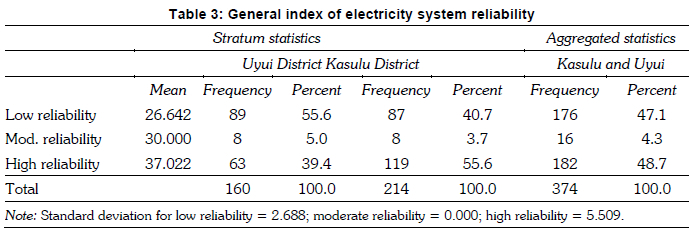
3.2 General electricity system reliability index
Utility suppliers can hardly reveal the general index of system reliability (GESRI), rather using indices based on specifiers like SAIFI, CAIDI and SAIDI, which do not capture the perception of consumers. Therefore, further assessment of electricity reliability was conducted using GESRI developed from summed scores of 11 Likert-scale items. GESRI was based on the following: a score of 1-29 = low reliability; 30 = moderate reliability; and 31-51 = high reliability (Table 3).
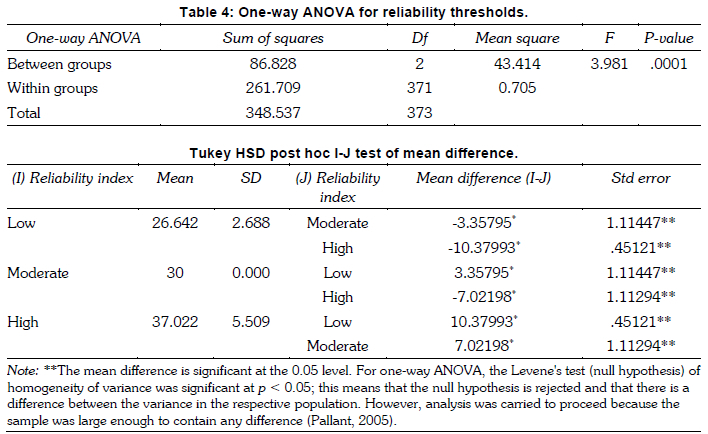
The result shows Kasulu district having a 55.6% score on high reliability while Uyui District had 39.4%. The high reliability in Kasulu was due to dependence on new IPPs which were rarely hit by external forces to cause outages. The low reliability (but acceptable to consumers) in Uyui was viewed as caused by a lack of self-dependence on generation. The complex network of the national grid had ups and downs, thus, some faults in one region or district could necessitate outages in other regions connected to the same feeders or transmission lines. On aggregate, the electricity system had high reliability by 48.7% (mean score=37.022) compared to low 47.1% (mean score=26.642) and moderate reliability 4.3% (mean score=30.00). Consumers were not affected by morning and midnight outages. This had led to higher ratings in favour of reliability. Although the mean score between reliability thresholds (Table 3) could be seen as different, yet it has no honest statistical proof for precise judgment. To depict any statistical differences between reliability thresholds, a One-way ANOVA with a post-hoc test was conducted (Table 4).
The results for one-way ANOVA show that there was a statistically significant difference at p < 0.05 between groups [F (2, 371) =3.981, p < 0.05]. Therefore, the Tukey HSD post-hoc I-J test of means difference was run to determine which index threshold differs and at what statistical level. The results show that low reliability (M=26.642, SD =2.688), p < 0.05, was significantly different from moderate reliability (M=30.0, SD=0.000) at p < 0.05 and high reliability (M=37.022, SD=5.509), p < 0.05. These results indicate that the reliability indices are different in terms of means. Therefore, it confirms the findings in Table 3 that electricity was reliable, and that the percentage score for the high-reliability index of 48.7% was different from the low score of 47.1% given the means consideration on post-hoc test.
3.3 The determinants of electricity system reliability
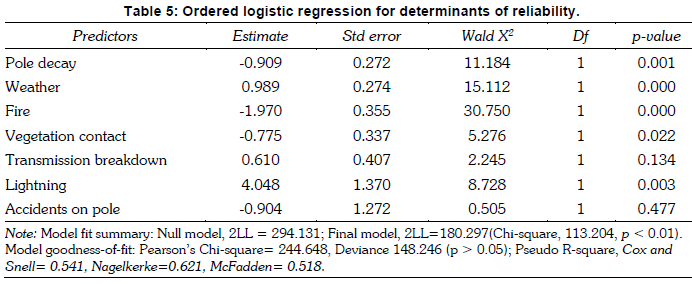
The reliability of the electricity system is determined by multiple factors; it was important to depict them. An ordered logistic regression analysis was used. The dependent variable was levels(ordinal) of system reliability index (1 = Low reliability, 2 = Moderate reliability, and 3 = High reliability). The results of the analysis are presented in Table 5.
The full model (2LL = 294.131) shows a significant improvement of the baseline intercept model against the model with predictors (2LL = 180.297) and it gave a better prediction of 51.8% (McFadden Pseudo R-square,) of all the determinants. The statistically significant predictors were weather and fire (p < 0.01). The results implied that bad weather which is associated with heavy rain and wind increases the probability of affecting electricity system reliability by 0.9. This was confirmed by the FGD:
Electricity system in most cases is affected by weather coupled with heavy and long periods of rain and winds, it breaks down power infrastructures including poles supporting transformers.
This statement means that the electrical system infrastructure in Kasulu and Uyui is vulnerable to adverse weather shocks and that it has caused a nightmare for customers. Bad weather spurs a crackdown on power infrastructure and affects supplies, for example, Eskom in South Africa has shade out 6 000 MW from the national grid due to weather (Conversation, 2020). Although fire indicates a strong predicting power ( p < 0.01), its effect was not adverse in the study area. This is because the transmission and distribution networks did not cut across the fire-prone environment, rather the settlement areas where fire could erupt. However, information from the transmission and distribution engineers (key informants) validated that bush fires resulting from farm preparations spread and destroyed transmission cables and poles, leading to unplanned outages. The lightning predictor was significant (p < 0.01). This could be a common phenomenon, because the study areas are prone to lightning, so the scale of effects on the electricity system escalated despite overhead earth wires and lightning arresters. Statistics indicated that high lightning intensity had set on fire eight transformers in 2017 (Uyui) while Kasulu had five in 2016. This has reciprocating effects, especially on the associated costs of replacing the damaged apparatus. In a similar strain, to minimize risks, electricity was cut off by utility suppliers while - and sometimes before - it thundered. This was revealed through FGD consensus that TANESCO usually cut off power supply especially when it rains with heavy lightning and thunder
The statement signifies that the system is vulnerable to lightning, which causes loose connections, transformer failure, and high-tension cable breaks down; it also causes disarray in the household due to meter defectiveness. The effect of lightning is confirmed by Edson Electric Institute (2019) that in the USA it caused 70% of all outages, leading to economic loss in enterprises and domestic harmony. On the same theme, Minnar et al. (2012) reported outages being caused by lightning, fire, pollution, bird streamers, and windstorms in most parts of South Africa, especially in rural areas. Likewise, the decay of electricity poles was a significant predictor of reliability (p < 0.01), due to termites which caused clutters in Kasulu and Uyui. It was explained by the key informants that in Kasulu 175 poles were replaced in 2017. This phenomenon causes planned and unplanned outages, and affects the utility supplier through the cost incurred to replace the poles. These findings are different from what Schoeman and Saunders (2018) say about South Africa; they reported that cable theft and aging infrastructures were major causes of interruptions there. Reliability determinants differ due to various reasons including geographical locations and system stability.
3.4 Effects of outage incidences on household expenditure for backup fuel
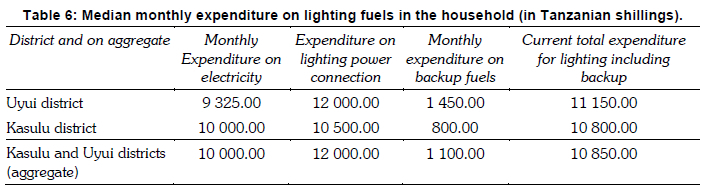
Despite the electricity system being reliable, several incidents of outages were reported. These could necessitate unplanned expenditure on backup fuels for household sustenance. The effects of outage incidences on backup expenditures were examined respectively of outage scenarios versus expenses before electricity connection (Table 6). Analysis was limited to lighting fuels and not appliances because the reality could be compromised given that some fuel could require no apparatus. Nevertheless, some apparatuses could only be bought once, something which could trouble the reliability of the results if included in the analyses.
The results on expenditure were estimated using the median. The expenditure differed. For Kasulu, the median expenditure was TZS 10000 while it was TZS 9325 for Uyui. On an aggregate sample, the expenditure was TZS 10000. All expenses were based on the reference month. The marginal differences in districts could be due to Uyui having more outages, leading to expenditure on backup fuels. This study argues that expenditure on sources like candles, torches, kerosene, and petrol before electricity connection was higher (TZS 12000) than electricity (TZS 10000). Rural Energy Agency (2017) reported electricity as the most expensive fuel for lighting in Kasulu at TZS 13 183 while Uyui was 12590. The decline in the expenditure on electricity (TZS 10000) might be orchestrated by the shift in tariffs by consumers. The current results reveal electricity is the least expensive, yet it provides high utility through efficient light for comfortability in performing some domestic activities like cooking and night studies for children. It limits consumers in ICT adoption and general income poverty alleviation when it is unreliable (Muhihi and Lusambo, 2021).
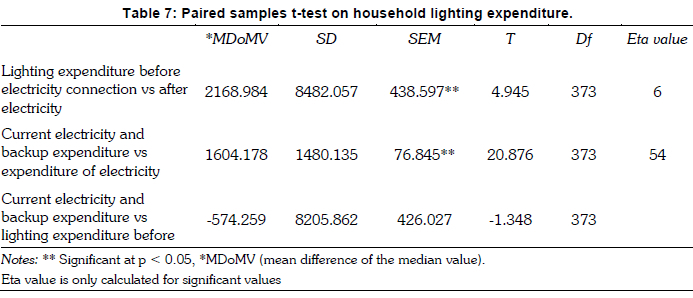
Moreover, outages have led to extra unforeseen expenditure on backups: Uyui - TZS 1 450 and Kasulu - TZS 800 while TZS 1100 was the aggregate figure. The disparity on backup expenditure can be attributed to levels of reliability between the two districts (Figures 1 and 2). It was also highlighted in the FGD that the disparity could be linked to household size, nature and price of backup fuels (kerosene, mobile solar lamps, private generators and candles). The current results are lined with those of Ebitoye (2013), who explained several factors like the number of devices used at the household, hours used per day, and consumption capacity. Although these results are limited to lighting fuel, due to outage, one could also embark on biomass fuel in response (Massuque et al. , 2021). The results in Table 6 portray marginal apparent differences, but to better depict statistical differences a paired samples t-test was performed after checking the respective assumption (normality). The paired statistics showed the varying means score on lighting expenses before electrification TZS 13 829.95 (SD = 9 633.388), current expenditure on electricity fuel TZS, 11 660.96 (SD = 6 187.468), expenditure on electricity plus backup TZS 13 230.05 (SD = 6 804.329). The results for paired differences of the t-test are presented in Table 7.
The results indicate that the domestic expenditure on lighting fuels before electricity connection and after electricity connection had a statistically significant difference (p < 0. 05), with a 6% magnitude of the effect size calculated by using Cohen's eta square formula. Also, a statistically significant difference existed between expenditure on electricity plus backup fuels combined and expenditure on electricity alone (p < 0.05), with a 54% magnitude of effect indicating that the large effect was due to expenditure on electricity and backup expenditure. Expenditure on electricity plus backup fuels combined had no statistically significant difference to expenditure on lighting fuels before electricity connection (p > 0.05). The result indicates that expenditure on lighting through electricity was cheaper among respondents, but outages and the tertium quid had dragged respondents for expenses on backup fuels. It is therefore concluded that outages cause out-of-pocket expenditure on backup fuel as a response. Expenditure on electricity combined with backup fuel is similar to expenditure incurred on lighting fuels before electricity connection. It is important to note that electricity is efficient and can provide perceptible benefits for other uses, such as the extension of business hours for small shops on home premises.
4. Conclusion
The prognostic results show that the rural electricity system was reliable on index and trend analyses. Although incidences of outage had occurred, still it was reported by consumers as being within the tolerable and absorbable range that can be relied upon in drawing reliability prevalence inferences. Consumers had spent between six and fifteen days without electricity due to outages for the reference year. With all the volatility assumptions of the rural electricity system. That trend is a visible fact that there is evidence of reliable electricity supply in the study areas. Being reliable indicates that the electricity system was available and fully functioning most of the time consumers wanted to used it.
On the determinants of system reliability, it was found that lightning, weather, fire outbreak in bushes and vegetation cover significantly affect system reliability in rural areas. Lightning was found to damage distribution line devices such as transformers. Similarly, termites were also reported by transmission engineers as a key determinant of electricity system reliability in rural areas, with about 175 electricity poles destroyed, leading to system instability and prolonged outages.
The study found that, despite prevailing system reliability, some outage incidences had occurred. These tangibly affected expenditure on backup fuel in the household. This was evidenced by the fact that electricity is a cheaper domestic lighting fuel compared to other sources of energy. However, the difference between the expenditure on electricity combined with backup fuels and the expenditure of electricity alone, reveals the difference caused by outages.
It should be noted that, to ensure system reliability, the energy utility and Rural Energy Agency should use metal and concrete poles, especially in areas prone to termites and fire. Further, there should be a continuous inspection of the system, making use of a supervisory control and data acquisition device on distribution lines to ease reliable data acquisition for reliability estimations. Further, standby transformers in the inventory should be established to save time on logistics after outage incidences resulting from damage of the device.
Acknowledgments
This study was funded by the Federal Government of Germany through the Deutscher Akademischer Austauschdienst for in-country graduate scholarships.
Author roles
Bikolimana G. Muhihi collected, analysed data and wrote the paper while Leopold Pascal Lusambo proofread and refined the work on data analyses.
References
Abebberese, A. (2013) Electricity cost and firm performance: Evidence from India. The MIT Journal, 99 (5): 839-852. [ Links ]
Abebberese, A., Ackah, C., & Asuming, P. (2017) Productivity losses and firm responses to electricity shortages: Evidence from Ghana. Journal of Economic Literature: 1-24. [ Links ]
Abotsi, A. (2016) Power outages and production efficiency of firms in Africa. International Journal of Energy Economics and Policy, 6 (1): 98 - 104. [ Links ]
Ali, A. (2016) The impact of electricity outages on households. PhD dissertation, University of Toronto: Canada. Toronto. [ Links ]
Allcott, H., Collard-Wexler, A., & Stephen, D. (2016) How do electricity shortages affect industry? Evidence from India. American Economic Review 106 (3): 587- 624. [ Links ]
Arlet, J. (2017) Electricity tariffs, power outages and firm performance: a comparative analysis. Global Indicators Group, Development Economics. The World Bank. [ Links ]
Australian Energy Market Commission. (2014) Distribution reliability measures, draft report EPR 0041. Australian Energy Market Commission. Sydney South, Australia. [ Links ]
Bell, A., Ward, P., Killilea, M., & Tamal, M. E. H. (2016) Real-time social data collection in rural Bangladesh via a microtasks for micropayments' platform on Android smartphones. PLoS One, 11, 0165924. [ Links ]
Bell, A., Ward, P., Tamal, M. E. H. & Killilea, M., (2019) Assessing recall bias and measurement error in high-frequency social data collection for human-environment research; Population and Environment, 40:325-345 [ Links ]
Bhatia, M., Angelou, N. (2015) Beyond connections, energy access redefined; energy sector management assistance program, technical report 0 0 8 / 1 5. World Bank. Washington. [ Links ]
Campbell, R. (2012) Weather-related power outages and electric system resiliency. Congressional Research Services, New York, USA. [ Links ]
Chakravorty, U., Beyza, M., & Marchandx, U. (2012) Impacts of reliable electricity supply. Evidence from India. The University of Alberta, 1- 51. [ Links ]
Chatterton, B. (2014) Network reliability measurement, reporting, benchmarking and alignment with international practices. Eskom, South Africa. [ Links ]
Chen, C., & Modrek, S. (2018) Gendered impact of solid fuel use on acute respiratory infections in children in China. BMC Journal of Public Health, 18; 1-8. [ Links ]
Confederation of Tanzania Industries. (2011) Challenges of unreliable electricity supply to manufacturers in Tanzania; a policy research paper submitted to energy sector stakeholders in advocacy for ensured reliable electricity supply to Tanzanian manufacturers. Dar es-Salaam. [ Links ]
Conversation. (2020) Power shortages will remain a big challenge in a post-COVID-19 South Africa. The Conversation. South Africa. Retrieved from: https://theconversation.com/power-shortages-will-remain-a-big-challenge-in-a-post-covid-19-south-africa-134589 (Accessed on 17.05.2020) [ Links ]
Dinkelman, T. (2011) The effects of rural electrification on employment: New evidence from South Africa. American Economic Review, 101 (7): 3078-3108. [ Links ]
Edson Electric Institute. (2019) The many causes of power failure. Edson Institute. New York. [ Links ]
Electricity Supply Monitoring Initiative (ESMI) (2017) ESMI report on monthly Supply quality in the districts of Dar es Salaam City, September 2017. Dar es Salaam: ESMI. [ Links ]
Energy and Environmental Service. (2015) Average duration of electricity outages per month in Africa as of 2015, by select country (in hours) Retrieved from http://www.statista.com/statistics/617570/ (Accessed on 15. 03. 2020) [ Links ]
Energy and Water Regulatory Authority. (2018) Regulatory performance report on electricity sub-sector for the year ended 30th June 2018. EWURA. Dodoma. [ Links ]
Field, A. (2009) Discovering statistics using SPSS. SAGE, London [ Links ]
Field, A. P., & Hole, G. (2003) How to design and report experiments. SAGE publication Inc. London [ Links ]
Fisher-Vanden, K., Mansur, E., & Wang, Q. (2015) Electricity shortage and firm productivity: Evidence from China's industrial firms. Journal of Development Economics, 114: 172 - 188. [ Links ]
Gertler, P., Lee, K., & Mobarak, A. (2017) Electricity reliability and economic development in cities: A microeconomic perspective, EEG state-of-knowledge paper series. Oxford Policy Management. Oxford. [ Links ]
Greenstone, M. (2014) Energy growth and development, evidence paper. International Growth Centre (IGC) Accra. [ Links ]
Herman, R., Gaunt, C., & Tait, L. (2014) On the adequacy of electricity reliability indices in South Africa. Energy research centre. University of Cape Town. 6pp. [ Links ]
Ibitoye, F. (2013) The millennium development goals and household energy requirements in Nigeria. Springer Plus, 2 (529): 1-9. [ Links ]
Kaufmann, L. (2013) Customer-specific reliability metrics: A jurisdictional survey. Pacific economic group research. Madson, Wisconsin. [ Links ]
Keneth, L., Miguel, E., & Wolfram, C. (2017) Electricity and economic development: A microeconomic perspective, EEG state-of-knowledge paper series. Energy for economic growth was applied to the research programme. California. [ Links ]
Kojima, M., & Trimble, C. (2016) Making power affordable and viable for its utilities. World Bank Group. Washington DC. [ Links ]
Küfeoglu, S. (2015) Economic impacts of electric power outages and evaluation of customer interruption costs. A dissertation for award of PhD Degree at Aalto University. Helsink. Finland. Doctoral Dissertation, Aalto University School of Electrical Engineering) Aalto University publication series. [ Links ]
Klein M., & Kleinbaum D.G (2010) Logistic Regression, 3rd Ed. Statistics for Biology and Health. Springer. New York. [ Links ]
Lusambo, L. (2016a) Households' income poverty and inequalities in Tanzania: Analysis of empirical evidence of methodological challenges. Journal of Ecosystem and Ecology, 6 (2): 1-15. [ Links ]
Lusambo, L. (2016b) Household energy consumption patterns in Tanzania. Journal of Ecosystem and Ecology, 1-20 [ Links ]
Marvin, R., & Hoyland, A. (2004) System reliability theory, models, statistical methods and applications (Second Edition) New Jersey: John Wiley & Sons, Inc. 636pp. [ Links ]
Massuque J., Matave C. & Trugilho P.F. (2021) Outlook for the biomass energy sector in Mozambique: Policies and their challenges. Journal of Energy in Southern Africa, 32 (4); 1-10 [ Links ]
Mensa, J. T. (2016) Bring back our light: power outages and industrial performance in Sub-Saharan Africa. Swedish University of Agricultural Science: Uppsala. [ Links ]
Min, B., O'Keeffe, Z., & Zhang, F. (2017) Whose power gets cut? using high-frequency satellite images to measure power supply irregularity. Policy research working paper 8131. World Bank Group. South Asia. [ Links ]
Minnaar, U., Gaunt, C., & Nicolls, F. (2012) Characterisation of power system events on south African transmission power lines. Electric Power System Research, 88: 25 - 32. [ Links ]
Moyo, B. (2012) Do power cuts affect productivity: A case study of Nigerian manufacturing firms. International Business and Economics Research Journal, 11 (10):1163 - 1174. [ Links ]
Muhihi B.G & Lusambo L.P (2021) Electricity for information and communication technology adoption in rural areas, Tanzania. Journal of Co-operative and Business Studies (JCBS), 6 (1) 2714-2043 [ Links ]
Muhihi B.G & Lusambo L.P (2022) PLS algorithm for estimating quality rural electricity on household income in Tanzania. Technological Sustainability, DOI 10.1108/TECHS-01-2022-0004 [ Links ]
Msyani, C. (2016) Current status of the energy sector in Tanzania, executive exchange on developing an ancillary service market. USA. Washington DC. [ Links ]
Mwakapugi, A., Samji , W., & Smith, S. (2010) The Tanzanian energy sector: The potential for job creation and productivity gains through expanded electrification. Special paper 10/3. Research on Poverty Alleviation (REPOA) Dar es Salaam. [ Links ]
Nikzad, M., & Mozafari, B. (2014) Reliability assessment of incentive- and priced based priced based demand response programs in restructured power systems. Journal of Electrical Power and Energy Systems, 56: 83 - 96. [ Links ]
Ordarno, L., Sawe, E., Swai, M., Katyega, M., & Lee, A. (2016) Accelerating mini-grids deployment in Sub-Sahara Africa; Lessons from Tanzania. Tanzania Traditional Energy Development Organization (TaTEDO) Dar es-Salaam [ Links ]
Oseni, M., & Pollit, M. (2015) A firm-level analysis of outages loss differentials and self -generation: Evidence from African business enterprises. Journal of Energy Economics, 52: 277 - 286. [ Links ]
Panos E, Turton , H., Densing , M., & Volkart, K. (2015) Powering the growth of Sub-Saharan Africa: The jazz and symphony scenarios of World Energy Council. Energy for Sustainable Development, 26: 14 - 33. [ Links ]
Pallant J (2005) SPSS Survival Manual. A step-by-step guide to data analysis using SPSS for Windows: Ligare Inc. Sydney [ Links ]
Panos, E., Densing , M., & Volkart , K. (2016) Access to electricity in the world energy council's global energy scenarios: An outlook for developing regions until 2030. Journal of Energy Policy, 9: 28 - 49. [ Links ]
Ramachandran, V., Shah, M., & Moss, T. (2018) How do African firms respond to unreliable power? Exploring firm heterogeneity using k-means clustering. Working paper 493. Center for global development. Washington DC. [ Links ]
Rud, J. (2012) Electricity provision and industrial development: Evidence from India. Journal of Development Economics, 97: 352-367. [ Links ]
Sengi G, & Ntagwirumugara E. (2021) Improving reliability of the power distribution system in Goma (DRC) using solar distributed generation. Journal of Energy in Southern Africa, 32 (4); 84-110 [ Links ]
Rural Energy Agency. (2017) Energy access situation report, 2016 Tanzania mainland. United Republic of Tanzania. Dar Es Salaam. [ Links ]
Schoeman, T., & Saunders, M. (2018) The Impact of outages on small business in the city of Johannesburg. 10th International Conference on Education, Business, Humanities and Social Sciences Studies (EBHSSS-18) Cape Town: University of Johannesburg [ Links ]
Scott, A., Darko, E., Lemma, A., & Rud, J. (2014) How does electricity insecurity affect business in low- and middle- income countries? World Bank. London. 6pp. [ Links ]
Sheskin, D. (2011) Handbook of parametric and non-parametric statistical procedure (5th Ed.) Boca Raton FL: CRC Press. [ Links ]
Shivakumar, A., Welsch, M., Shivakumar, A., Taliotis, C., Howells, M., JaksiC, D., & Baricevic, T. (2014) Estimating the socio-economic costs of electricity supply interruptions. Rapid response energy brief. European Commission. [ Links ]
Stiles, G., & Murove, C. (2015) SADC renewable energy and energy efficiency, status report. SADC: Johannesburg. [ Links ]
Taneja, J. (2016) Measuring electricity reliability in Kenya. STIMA Lab, department of electrical and computer engineering, University of Massachusetts. Amherst. [ Links ]
TANESCO (2018) Report on outage incidences for year 2018, analysis of frequency and duration of outages; TANESCO, Kasulu District, Kigoma [ Links ]
TANESCO (2018) Report on outage incidences for year 2018, analysis of frequency and duration of outages; TANESCO.Uyui District, Tabora [ Links ]
U.S Energy Information Administration. (2018) Annual electric power industry report, 2017. U.S Energy Information Administration. Washington DC. [ Links ]
URT. (2015) Tanzania energy policy. Ministry of minerals and energy. Ministry of Minerals and Energy. Dar es-Salaam. [ Links ]
Van Eeuwijk, P., & Angehrn, Z. (2017) How to conduct a focus group discussion (FGD), Methodological manual. Swiss Tropical and Public Health Institute. Basel. [ Links ]
Yamane, T. (1967) Statistics: An Introductory Analysis, 2nd ed., Harper and Row, New York. [ Links ]
* Corresponding author: Email: bikolimana2004@gmail.com

