


Services on Demand
Article
 English (pdf)
 Article in xml format
 Article references
Indicators

Related links
-
 Cited by Google
 -
 Similars in Google
Share

 Permalink
Journal of Energy in Southern Africa
On-line version ISSN 2413-3051
Print version ISSN 1021-447X
J. energy South. Afr. vol.33 n.1 Cape Town Feb. 2022
http://dx.doi.org/10.17159/2413-3051/2022/v33i1a8362
ARTICLES
https://dx.doi.org/10.17159/2413-3051/2022/v33i1a8362
Absorbed power density approach for optimal design of heaving point absorber wave energy converter: A case study of Durban sea characteristics
Ntumba Marc-Alain Mutombo*; Bubele Papy Numbi
Department of Electrical Engineering, Mangosuthu University of Technology, Durban, South Africa
ABSTRACT
This work proposes an approach for the optimal sizing of a cylindrical heaving wave energy converter (WEC). The approach is based on maximising the absorbed power density (APD) of the buoy, with the diameter being the decision variable. Furthermore, two types of buoy shapes were compared to get the best option. The two buoy shapes are the cone cylinder buoy (CCB) and the hemisphere cylinder buoy (HCB). The aim was therefore to determine the best shape and as well as the optimal size of the cylindrical point absorber. To validate the approach, the simulation was performed under Durban (South Africa) sea characteristics of 3.6 m wave significant height and 8.5 s peak period, using the openWECsimulator. The buoy diameter range considered was from 0.5 m to 10 m for both shapes. Simulation results revealed that a diameter of 1 m was the optimal solution for both buoy shapes. Furthermore, the APD method revealed that the HCB was more efficient than the CCB. The power density of the HCB was 1070 W/m2, which was almost double the power density of the CCB, while the two shapes present almost the same absorbed power.
Keywords: cylindrical buoy; heave motion; absorbed power; power density; optimal sizing
1. Introduction
To date, South Africa's energy landscape is dominated by electricity from coal, which has also been the major source of energy worldwide (Soleimani et al., 2015). Despite its large reserves of coal, South Africa has also several renewable energy (RE) options available. These are solar, wind, geothermal, biomass, ocean and hydropower (Ramayia, 2012; Mutombo and Numbi, 2019). RE as an alternative source of energy could improve sufficiently the energy need profile of South Africa and considerably reduce disastrous consequences from the use of coal as the main source of electrical energy production. Among these RE sources, ocean waves present the advantage of having higher energy density, unlike solar and wind energies, which require larger areas of land (Soleimani et al., 2015). Waves are the most well-known symbol of ocean energy (Zabihian and Fung, 2011), and have the highest energy density among green resources (Leijon et al., 2003). Wave energy presents an important potential of energy that is expected to contribute to future energy demand (Penalba and Ringwood, 2016), but the cost of ocean wave energy harvesting and its conversion into electricity is still not competitive with other RE sources (Garcia-Rosa et al., 2015).
The ocean wave energy (OWE) potential of South Africa is high, due its long coastline, estimated at more than 3000 km (Rautenbach et al., 2020). Four of the nine provinces - Northern Cape, Western Cape, Eastern Cape, and KwaZulu-Natal -have coastlines and are potential locations for wave energy harvesting. A few studies have been conducted in the field of OWE for the South African sea state, to determine the potential of South African wave energy potential (Joubert and van Niekerk, 2013; Banks and Schaffler, 2005). South Africa could benefit from this energy along its coastline (Fourie and Johnson, 2017).
KwaZulu-Natal (KZN) bounds on the east to the Indian Ocean. The wave energy potential of KZN increases from St Lucia Estuary to Port Edward, with an annual average power flux of 15 kW/m observed near the Durban (Fourie and Johnson, 2017). This wave energy potential is due to the Agulhas current along the Durban coast. The wave climate on KZN coast was determined by performing a formal analysis of the relatively long Richards Bay and Durban's waverider data. From this study, the significant heights and the peak periods were obtained (Corbella and Stretch, 2012).
OWE is harvested by ocean wave energy converters (WECs). Hundreds of WECs with various technologies to efficiently harvest this energy have been proposed during the last decades. A few have reached sea trial test status, but very few have reported detailed measurements of their performance (Rahmati and Aggidis, 2016). This could be justified by the difficulties associated with carrying out experiments in a hostile marine environment. Whilst some designs are quite large, there is much interest in point absorber devices, which have the potential for more efficient power conversion, in terms of output per unit volume (Rahmati and Aggidis, 2016). Point absorber WECs are oscillating WECs with smaller size compared to the typical wavelength (Budar and Falnes, 1975; Evans, 1980; De Backer et al., 2009). Point absorbers are a class of wave energy devices that are axisymmetric and capable of capturing ocean wave energy from any direction; Their dimensions are generally an order of magnitude below the wavelength (Maria-Arenas et al., 2019). The concept of point absorber systems has been investigated for many years.
Different experiments based on shape optimisation have been conducted to optimise the size of WECs (Mahnamfar and Altunkaynak, 2017; Son et al., 2016; Alves et al., 2007) as well as their power absorption (Flocarda and Finnigan, 2012). Some studies focused on the optimisation of the power capture by modifying the inertia of the WECs (Flocarda and Finnigan, 2012; Vantorre et al., 2004; Sjokvist et al., 2014), while others were based on the frequency domain theory and models with targeted (Rahmati and Aggidis, 2016; Sjokvist et al., 2014; Goggins and Finnegan, 2014) and boundary element method (Kramer and Frigaard, 2002) to improve the performance of WECs and assess their power absorption. To determine the optimal geometry of a wave absorber, multi-objective optimisation algorithm (Kurniawan and Moan, 2012; Kurniawan and Moan, 2013) and genetic algorithm (McCabe, 2013; Babarit and Clement, 2006) were also used. Optimum dimensions of WECs were determined applying statistical analysis methods (Shadman et al., 2018), scatter diagrams of data at different sites (Babarit et al., 2012), and hydrodynamic perform-ance database of various WECs were built based on the collection and analysis of data available in the literature (Babarit, 2015). Optimal control strategies were also used to optimise the size and energy capture of WECs (Garcia-Rosa et al., 2015; Maria-Arenas et al., 2019). It was noticed that a well designed WEC would capture more energy from the wave and its size could be reduced. This means that in the design process of a WEC, the geometry optimisation of the system has a significant role. As the cost of a WEC increases with its size, the geometry optimisation will determine the size of an economically feasible system and would make the device oscillate in the range of predominant wave frequencies to capture maximum energy (Shadman et al., 2018).
From the above, most studies on point absorber buoys were based on the optimisation of WEC geometry, control of inertia, mass, and damping coefficient. The focus of these research studies was more on the absorbed power as a function of sea height for a specific buoy diameter and efficiency, and the performance of the buoy is determined in term of absorbed power as a function of wave height. The overall optimisation of the WEC depends on determining the diameter and draught of the cylinder corresponding to the maximum average absorbed power (Garcia-Rosa et al., 2015).
It is difficult to determine the buoy shape and size of better performance for a range of diameters, especially given that a cone cylinder buoy (CCB) and hemisphere cylinder buoy (HCB) with the same diameter absorb almost the same power for the same sea state. The difference between absorbed powers is small, making it difficult to determine which buoy has better performance. This paper proposes frequency domain modelling combined with the power density method (PDM) to determine buoy shape and size for better performance. Frequency domain modelling based on the linear wave theory is used to obtain the hydrodynamic parameters of the point absorber WEC, while the WEC heaving response and energy absorption is calculated using the time-domain solver. The buoys with the best performances are determined by comparing their power densities.
2. Methodological approach and simulator details
The methodology used aims to determine the shapes and diameters of buoys with better performance. To properly perform the study, the point absorber geometry is selected based on the optimum energy extraction shapes from previous studies as noted in the previous section. The buoy motion is delimitated to heave motion which has the highest energy density compared to sway and surge motions and simplicity of the study. Also, the parameters of the simulation are determined to minimise the pitch movement of the buoys. The geometric parameters for the buoys are determined in a diameter range of 0.5 m to 10 m. Considering the water line passing by the centre of the vertical cylinder, the centers of gravity (CG) of the CCB and HCB are obtained from Equations (4) and (5). The buoy mesh is processed by an openWEC simulator, with given buoy shape, diameter, position of CG, water depth and water density. The frequency domain modelling, defined by Equation (12) is performed with the Nemoh BEM solver under openWEC to obtain the added mass and the hydrodynamic damping plots. The absorbed power is obtained from Equation (23) in the time domain modelling of irregular wave and linear PTO damping type, using the power density spectrum in Equation 1. The PDM is then applied to different buoys to determine shapes and diameters of buoys with best performance. The entire simulation was performed with openWEC, which is an open-source tool to simulate the hydrodynamic behavior and energy yield from single body WECs. This is a combination of the frequency domain solver Nemoh developed by Ecole Centrale de Nantes and the time domain solver developed by Universiteit Gent. The type of WEC simulator can be selected from three types of WEC, available in the software. These are the point-absorber simulator, OWSC simulator, and atten-uator simulator. In addition, a custom simulator providing the same functionality as the available simulators is provided. To perform the simulation, firstly the mesh of the buoy structure was created at pre-processing stage. Secondly, based on the linear wave theory and thus assumed potential flow, the frequency domain modelling was performed with the Nemoh BEM solver to obtain the added mass and hydrodynamic damping coefficient plots. Finally, the WEC heaving response and energy absorption was calculated using the time-domain solver. More details on the openWEC simulator can be found in Verbrugghe (2016).
3. Point absorber geometry
The point absorber geometry is selected from different cylindrical shapes. These shapes were developed for optimum energy extraction, and a few of them were tested in the sea. An interesting study of cylindrical point absorber shapes can be found in Goggins and Finnegan (2014). Seven shapes of cylindrical point absorbers were studied, and the finding was that the HCB performed best, followed by the CCB. These two buoy geometry shapes were later selected to determine hotspot locations of ocean wave energy in Iran's sea (Alamian et al., 2014). Due to their performance demonstrated in previous studies, the CCB and the HCB, shown in Figure 1and Figure 2 were selected for this study. These point absorber WECs were moored to the seabed by a single cable. Only the heave motion of the buoy was considered, due to the buoy symmetry, and the high intensity of power in heave motion compared to sway and surge motions. The buoys moved up and down vertically in the direction of the Z-axis.
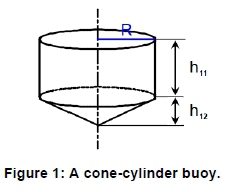
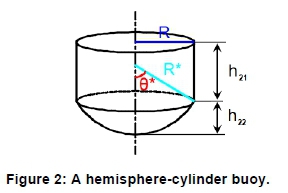
To determine the main parameters for the simulation and avoid the pitch movement of buoys, the water line passes through the centre of the vertical cylinder of the buoy. This means that half of the cylinder, the conic and hemispheric parts, are under water. The relationships between the diameter and height of conic and hemispheric parts were determined from Equations 1-3, obtained from the geometry of buoys:
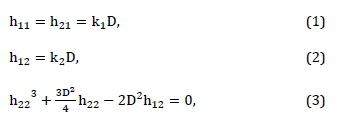
where D is the diameter of the buoy; hx1, h12 are the heights of the cylindrical and conic parts of the CCB respectively; h21 and h22 are the heights of the cylindrical and hemisphere parts of the HCB respectively; k1 and k2 are coefficients of proportionality [-] (k1,k2 < 1 with k1 > k2) for each diameter.
The locations of the CG for the CCB and the HCB to the waterline are obtained from Equations 4-5.
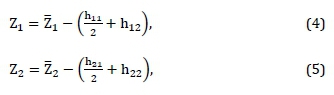
where Z1 and Z2, given by Equations 6 and7, are the centres of gravity (CG) of the CCB and the HCB. These developed equations are based on the principle of superposition of the cone, hemisphere and cylinders constituting the two buoys.
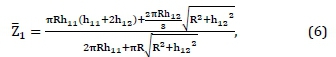
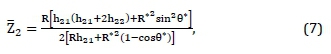
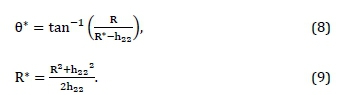
where R is the radius of the buoy; R* is the radius of curvature of the hemisphere; and 0* is the angle between Z axis and the line from the centre of the hemisphere to the circumference of the base hemisphere. The values of 0* and R* are obtained from Equations 8 and 9 respectively.
4. Sea characteristics
The extraction or harvest of ocean wave energy depends on the sea state of the location where the WEC is located (Engström et al., 2009) and on the geometry of the buoy (Shadman et al., 2018). This state is defined by the significant wave height Hs, which is the mean wave height of the top one, third highest of the waves, and the peak wave period, Tp (Goggins and Finnegan, 2014). To perform the design and analyse the performance of the ocean WEC, the significant wave height Hs and the peak wave period Tp should be determined. In this study, these parameters are obtained from the site measurement by applying the joint probability distribution for offshore to the waverider data. More detailed data, based on analysis of the long-term measurements of the east coast waverider buoy for Richard bay and Durban wave climate, can be found in Corbella and Stretch (2012).
In Durban, the ocean wave data are being continuously recorded by the Council for Scientific and Industrial Research (CSIR) and eThekwini Datawell Waverider buoys. Details of this information are available in real time at Transnet National Ports Authority, Durban and at eThekwini Municipality for use (CSIR, 2018). These two waveriders and their locations are given in Table 1
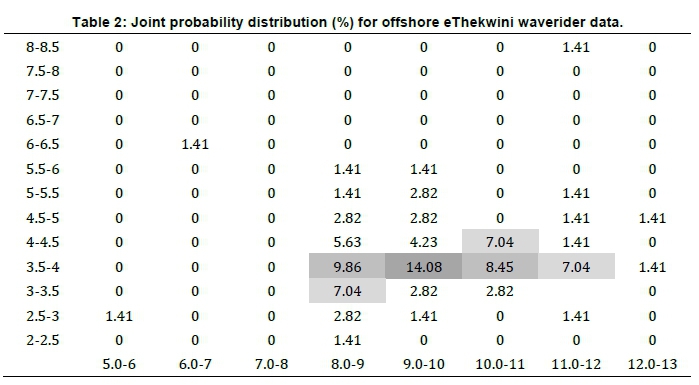
Data obtained from eThekwini Datawell Wave-rider buoy were used to define the characteristics of the ocean at Durban and they are grouped in Table 2by using joint probability distribution (Shadman et al., 2018).
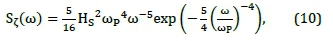
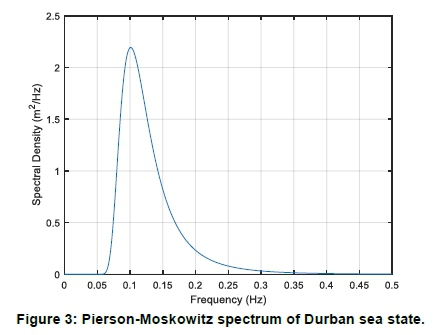
From these data, the most probable sea state is used to determine the wave energy spectrum. The high probability of occurrence of specific values of wave height and periods is 14.08%. Comparing the probabilistic intervals of these values, the observation is that a wave height of 3.6 m at a period of 8.5 s is the most frequent. These parameters were used to represent Durban real sea state by irregular waves. The free surface elevation of the irregular wave was constructed from a linear superposition of several regular wave components. Each regular wave component was extracted from a wave spectrum. The wave spectrum is the power spectral density function of the vertical sea surface displacement (Goggins and Finnegan, 2014). The Pierson - Moskowitz (PM) spectrum and JONSWAP spectrum are frequently applied for windy seas (Hasselmann et al., 1973) to generate the random wave signal (Kamarlouei et al., 2020). The Pierson-Moskowitz spectrum, as one of the simplest spectra, was proposed by Pierson and Moskowitz (1964) and is defined by Equation 10.
with

where HS is the significant height [m]; ωp is the wave peak angular frequency [rad/s]; ω, given in Equation 11, is the wave angular frequency in [rad/s] and f is the wave frequency [Hz].
The Pierson-Moskowitz spectrum of Durban sea state is shown in Figure 3
5. Hydrodynamics of the system and absorbed power
To model the heaving point absorber WEC, the buoy is represented by a mass attached to a spring, with a stiffness coefficient k [kg/s2], in parallel with a damper with a damping coefficient bd [kg/s]. The point absorber is restricted to one degree of freedom operating in the heave mode in Z direction, as more energy is produced from the heave motion of the wave than from the surge and sway motions.
The hydrodynamic behaviour of a WEC is modelled by the linear method in most cases for easy computation, but this may not be accurate enough. The hydrodynamic parameters of the models are determined using the boundary element method (BEM). To reach a certain accuracy, the hydrodynamic force can be decomposed into different components to include nonlinear and higher-order effects of the hydrodynamic of the WEC (Penalba and Ringwood, 2016). The hydro-dynamic forces on the point absorbers are determined by applying linear wave theory, with the wave being a combination of incident, radiated and diffracted components. The motion of the point absorber is given by Equation (12) in the time domain (Khojasteh and Kamali, 2016; Vantorre et al., 2004).

where m is the mass of the buoy [kg], z is the buoy acceleration; [m/s2], Fexc is the wave exciting force [N]; Frad is the radiation force [N]; Fres is the hydrostatic resolving force [N]; Fdamp is the damping force [N]; and Ftun is the turning force [N].
The wave irregular excitation force is calculated as the real part of an integral term across all wave frequencies (National Renewable Energy Laboratory and National Technology & Engineering Solutions of Sandia, 2017). This is obtained from Equation 13.
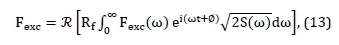
where 33 denotes the real part of the formula, Rf is the ramp function, 0 is a random phase angle (Beatty et al., 2015).
The radiation force Frad can be decomposed in linear added mass term and linear hydrodynamic damping term using linear theory (Van Paepegem et al., 2011), as in Equation 14.
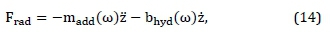
where madd and bhyd are respectively the added mass [kg] and hydrodynamic damping coefficient [kg/s] obtained from Nemoh BEM solver.
The hydrostatic restoring force Fres given in Equation 15 is the difference between the buoyance or Archimedes force and the force due to the floater weight or gravity force (Van Riet, 2017).

where Farch is the buoyance force [N]; Fg is the gravity force [N]; and k is the hydrostatic restoring coefficient [kg/s2], obtained from Equations 16, 17 and 18 respectively.
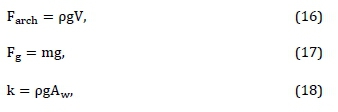
where p [kg/m3] is fluid density; V is the submerged buoy volume [m3]; Aw is the waterline area [m2]; Fdamp and Ftun are the damping force [N] and the turning force [N]. In practice, those forces are nonlinear and introduced by the power take off and the control mechanism respectively. But they are often assumed to be linear (Van Riet, 2017), and are defined in Equations 19 and 20.
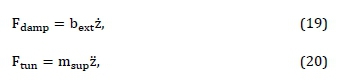
where bext is the linear external damping coefficient [kg/s]; and msup is the complementary mass [kg]. The values of these coefficients are determined using openWEC simulator.
The linear external damping coefficient bext is responsible for power extraction. The absorbed power of any WEC is frequency-dependent, and the buoy natural frequency is generally higher than the wave peak frequency. In order to achieve maximum power absorption, the WEC should operate at resonance when its natural frequency is closer to the wave frequency (Maria-Arenas et al., 2019), with a possibility of damaging the buoy structure. Theoretically, the resonance leads to the highest power production. This requires very large tuning forces, on one hand, and is associated with extremely high buoy displacement and velocity amplitudes on the other (Flocarda and Finnigan, 2012). To avoid that, the natural frequency of the buoy should be less than the wave peak frequency. This is accomplished by introducing an additional mass m_sup to reduce the buoy natural frequency (Vantorre et al., 2004). The supplementary mass and the external damping coefficient, responsible for the power absorbed by the buoy are optimised if the supplementary mass msup is determined from Equation 21.
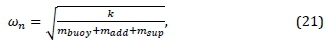
with ωn< The wave peak frequency ωpis obtained from Equation 22,
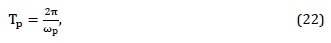
and the values of madd [kg] and k [kg/s2] are determined from graphs generated by openWEC at the peak frequency ωp[Hz]. The external damping coefficient is obtained by determining the maximum capture width.
The spectrum has 50 equivalent frequencies, ranging from 0.2 to 2.5 rad/s, which is good range for the BEM. With boundary conditions properly applied, the simulations based on 20 frequency components offer an accurate reliable prediction (De Backer, 2009). The energy absorbed is defined as the mechanical energy captured from the ocean waves by the ocean wave converters (Penalba and Ringwood, 2016). By applying linear superposition of the buoy responses, the absorbed power in irregular waves can be obtained from Equation 23.
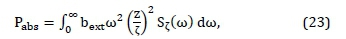
where Z is the buoy position; and ζis the correlation of the wave amplitude of regular wave components. It is given by Equation 24.
where Δω[rad/s2] is the difference between successive frequencies.
6. Simulation and discussion
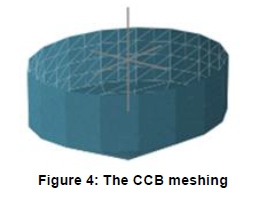
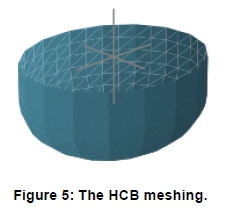
Since the wave height and period at the Durban coast present a better wave resource close to the shore, the study was performed at 15 m water depth, which is the depth of the location of the eThekwini Datawell Waverider buoy. The water has a density of 1025 kg/m3. Half of the cylindrical part, the hemisphere and cone parts of the point absorber are submerged. For each buoy shape, different diameters were considered. Figure 4and Figure 5show the meshing performed on the CCB and HCB geometries.
The simulation is performed for buoy diameters ranging from 0 m to 10 m. The choice of this range is to limit the phenomenon of buoy pitching, which occurs at diameters greater than 10 m (De Backer, 2009). Three areas of interest determined by the PTO damping coefficients and corresponding to the maximum absorbed power are obtained from simulation and represented in Figure 6and Figure 7 These areas correspond to diameters and damping coefficients of maximum power captures, as the damping coefficients and diameters are responsible for the buoys power extraction (Vantorre et al., 2004). They are defined by the damping coefficients of 104 kg/s, 105 kg/s and 106 kg/s for CCB and HCB respectively.
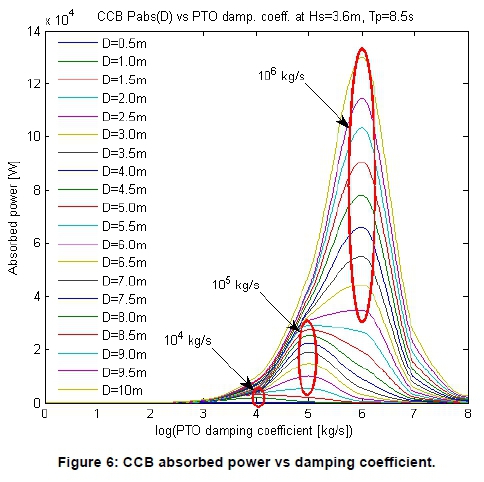
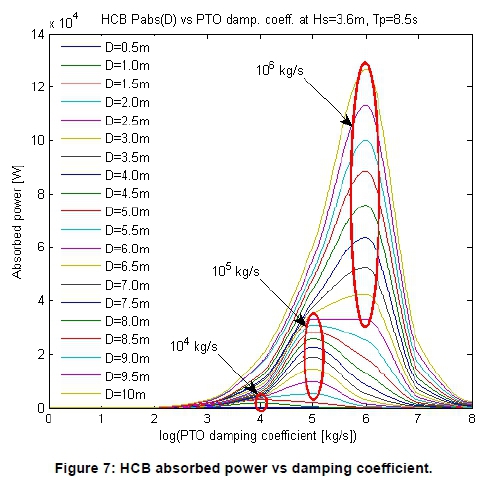
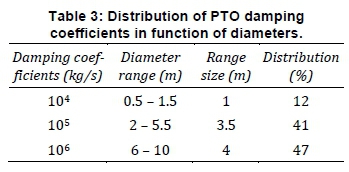
These areas correspond to diameters and damping coefficients of maximum power captures as the damping coefficients and diameters are responsible for the buoy's power extraction (De Backer, 2009; Vantorre et al., 2004). These three areas of PTO damping coefficients are identified as a function of diameters and their distribution are given in Table 3 from which it can be seen that the PTO damping coefficient increases with the diameter of the buoy. Besides, the range size distribution increases also with the PTO damping coefficient for a maximum power extraction.
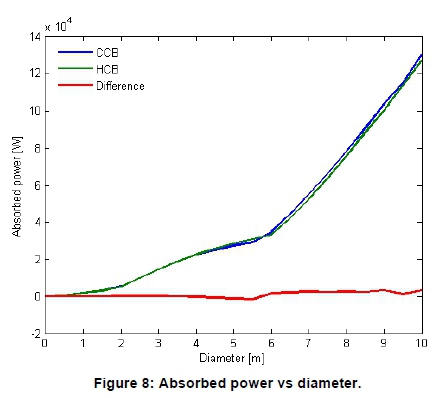
The power absorption of the buoy shape depends mostly on its diameter, as shown in Figure 8 A buoy with a large diameter absorbs power significantly. One of the reasons could be the action of the hydrostatic resolving force on the point absorber. Moreover, for the same diameter, the two buoys absorb almost the same power. To determine a better shape, the power densities were determined and compared for the two shapes of the same diameter. The power density is the ratio of absorbed power to the buoy surface area. For the same power, the surface area of the HCB is smaller than that of the CCB, while the volume of the HCB is bigger than that of the CCB, as seen from Figure 9
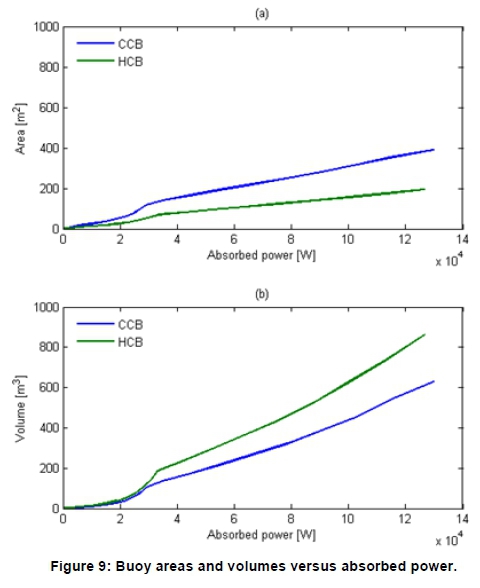
This is due to the geometrical properties of the hemisphere and cone: geometrically, a hemisphere covers a bigger volume than a cone with the same surface area. The quantity of material for the buoy is evaluated in terms of surface area, rather than volume covered and this is considered to be one of the main parameters in the economic analysis of any device. This could lead to less material being used in the HCB than the CCB for the same absorbed power and could contribute to a cost reduction. The well-defined optimal buoy geometry size could reduce the loss in hydrodynamic performance due to negative array interactions and make closely spaced arrays more cost-effective (Kamarlouei et al., 2020). This could also contribute to important savings in infrastructure materials in the converter manufacturing.
In most cases, the performance of the point absorber is determined by the ratio of absorbed power to the buoy diameter. This method defines the buoy of higher absorbed power. Figure 10(a) gives the values of the ratio for the HCB and the CCB for diameters from 0 m to 10 m, with an increment of 0.5 m. By using the ratio of absorbed power over the buoy surface area, the buoy with better performance can be determined, as seen in Figure 10(b).

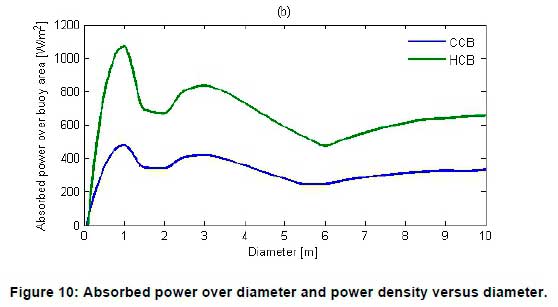
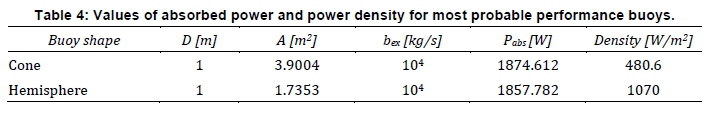
The diameter of 1 m followed by the diameter of 3 m presents a better performance of the point absorbers in terms of power absorption per surface area; also, the HCB presents a better performance than CCB of the same diameter, as seen in Figure 10(b). Hence, 1 m can be considered as the optimal diameter value for the HCB and CCB. This diameter corresponds to the diameter of buoys of highpower density. The power densities of the HCB and the CCB for the diameter of 1 m are 1070 W/m2 and 480.5 W/m2 respectively. For the same diameter and damping coefficient, the power density of the HCB is almost double that of the CCB. This is due to the doubling of the area of HCB needed for the CCB to harvest the same power as the HCB, as seen in Figure 9(a). The area ratio between the CCB and HCB is almost 2. Table 4summarises the characteristics of the buoy shapes for better performance.
Even if the cone-cylinder floater has better hydrodynamic properties than other geometries (Kamarlouei et al., 2020), the hemisphere-cylinder presents a better performance, probably because of the larger surface area than the cone-cylinder has for the same volume.
For both shapes, small diameters present a better performance than large ones. As the diameters are related to the volumes of the buoys, this confirmed that the smaller the structural volume of the converter is, the larger is the ratio between the potentially converted power and the mentioned volume (Falnes, 2002).
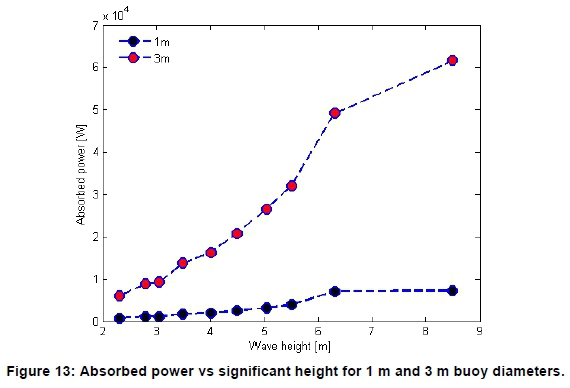
The simulation of 1 m and 3 m diameter HCB is performed for ten different sea states, as presented in Figure 11and Figure 12 It is found that the absorbed power depends mostly on the significant height, rather than the peak period, as seen in Figure 11 In addition, the excitation force is almost the same, since the difference between the significant heights is not important. As mentioned above, the buoy-absorbed power is higher at a buoy frequency close to the wave peak frequency and the excitation power is a function of the wave spectrum. For the Pierson-Moskowitz spectrum given by Equation (10), the spectrum function in the excitation force integral of Equation (13) is proportional to the square of the significant height and inversely proportional to the frequency. This reveals that the excitation force is more dependent on the wave height than the wave frequency. The difference in absorbed power for different heights can easily be observed from Figure 13 For the same frequency (period), the absorbed power increases with the significant height. This is due to the potential energy being proportional to the height. This energy from the wave height is probably converted to kinetic energy, harvested by the buoy, and collected by the power take-off. The HCB presents a higher bex than the CCB. Added to the area ratio, this could better explain its higher performance. As the diameter increases, there is more influence of hydrodynamic damping coefficient and hydrostatic resolving force on the absorbed power.
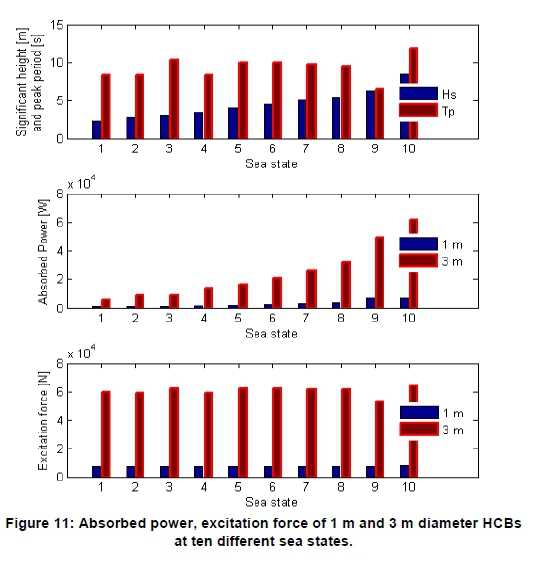
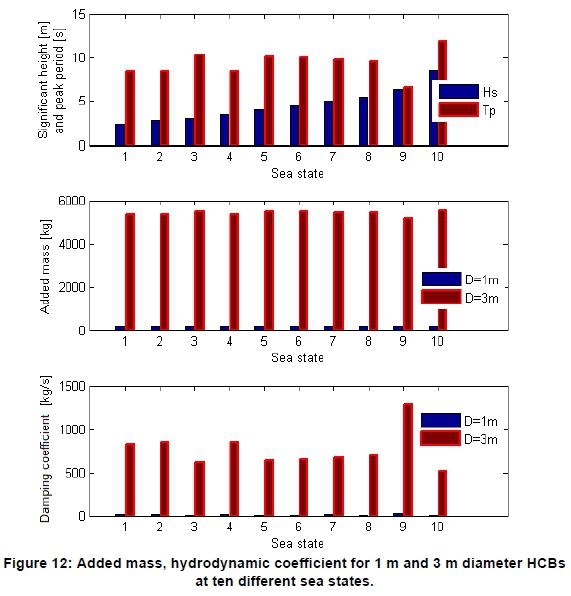
Compared to the height, the frequency has a bigger impact on the excitation force. The wave excitation force is higher at lower frequency and the wave height is lower for two different sea states, as seen in Figure 11 The added mass remains almost constant. The peak in hydrodynamic damping coefficient for both diameters is observed at a frequency of 0.153 Hz. For the same frequency, the excitation force decreases with the wavelength, as seen in Figure 12
Also, the wave height and buoy diameters have a great impact on the absorbed power of the buoy. The absorbed power increases dramatically with the wave height, especially for significant height with an increase in diameter, as seen in Figure 13 In general, the absorbed power is proportional to the square of the wave height, and its performance is determined by the ratio of absorbed power to the diameter. However, if the buoy is too large, the diffraction forces will reach certain values with negative impact on the loading and buoy responses, which will lead to the buoy not behaving as a point absorber (Engström et al., 2009). This can explain why the performance of the 1 m diameter HCB is poor at the significant wave height above 6 m.
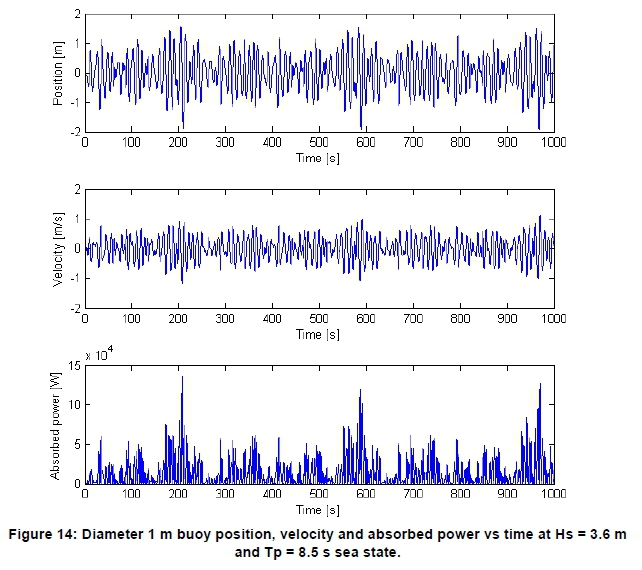
Hence, a compromise should be reached between the buoy size and power density. For 1 m diameter HCB, the buoy reached the local peak amplitudes of the heights at higher velocities, as seen in Figure 14 The absorbed power is always positive, even if the buoy position is negative as the excitation force and buoy position have same direction all time. By applying the logarithm to the graph of absorbed power versus time in Figure 14 the area of maximum absorbed power can be determined as shown in Figure 15
7. Conclusions and recommendations
A methodology of optimising the cylindrical floating wave energy converter (WEC) for better performance is proposed. This is based on the energy density, considering the buoy shape, diameter and absorbed power as parameters. From eThekwini Datawell Waverider buoy data, the sea characteristics of Durban are determined. The significant height and the average period are obtained from the site measurement by applying the joint probability distribution. Based on the performance presented in previous studies, the hemisphere-cylinder buoy (HCB) and the cone- cylinder buoy (CCB) are chosen for this study. The geometric parameters of the shapes are determined by the principle of superposition of two geometries. The mass attached to the spring in parallel with the damper is used as a model to study the hydro-dynamics of the systems using the linear wave theory.
The simulation is performed with openWEC simulator for 3.6 m significant height and 8.6 s average period in water with 1025 kg/m3 density and 15 m depth. The absorbed power is determined using the Pierson-Moskowitz spectral density function of the vertical sea surface displacement for the design location. Simulation results demonstrate that, in the range between 0.5 m and 10 m, the absorbed powers are similar for two shapes of similar diameter, making it difficult to determine the buoy with better performance. Hence, it is difficult to obtain the buoy shape and diameter with best power capture based on the absorbed energy, only. By using the power density method, results show that the performance of the HCB is almost double that of the CCB. In addition, the diameter of 1 m followed by 3 m seem to be better candidates, based on the power density. This makes it easy to determine the buoy with better performance, even if the two shapes present almost the same power extraction for the same buoy diameters. Simulation results revealed that the diameter of 1 m was the optimal solution for both buoy shapes. Furthermore, the APD method revealed that the HCB was more efficient than the CCB. The power density of the HCB was 1070 W/m2, which was almost double the power density of the CCB, while the two shapes present almost the same absorbed power.
This study reveals that the APD method is an effective method in the design of cylindrical WECs and could be used in the optimisation of cylindrical point absorber buoys, when knowing the sea state of the location. The diameter constraint can be determined first by the APD method rather than the optimisation method used in the design phase of a cylindrical point absorber. Further studies can be performed using this method to determine the diameter of the buoys for the case of an array design, where small buoys are grouped to produce a specific power instead of a big-diameter buoy. Further studies could also determine the impact of sway and surge motions on the method and the buoy design process.
Author roles
References
Alamian, R., Shafaghat, R., Miri, S. J., Yazdanshenas, N. & Shakeri, M. 2014. Evaluation of technologies for harvesting wave energy in Caspian Sea. Renewable Sustainable Energy Review 32: 468-476. [ Links ]
Alves, M., Traylor, H. & Sarmento, A. Hydrodynamic optimization of a wave energy converter using a heave motion buoy. Proceedings of the 7th European wave and Tidal Energy Conference 2007, Porto, Portugal: 11-14. [ Links ]
Babarit, A. 2015. A database of capture width ratio of wave energy converters. Renewable Energy 80: 610-628. [ Links ]
Babarit, A. & Clement, A. H. Shape optimisation of the SEAREV wave energy converter. Proceedings of the 9th World Renewable Energy Congress 2006, Florence, Italy, 19-25 August 2006. [ Links ]
Babarit, A., Hals, J., Muliawan, M. J., Kurniawan, A., Moan, T. & Krokstad, J. 2012. Numerical benchmarking study of a selection of wave energy converters. Renewable Energy 41: 44-63. [ Links ]
Banks, D. & Schäffler, J. 2005. The Potential Contribution of Renewable Energy in South Africa (Sustainable Energy and Climate Change Project (SECCP)). energize. Johannesburg, South Africa. [ Links ]
Beatty, S. J., Hall, M., Buckham, B. J., Wild, P. & Bocking, B. 2015. Experimental and numerical comparisons of self-reacting point absorber wave energy converters in regular waves. Ocean Engineering 104: 370-386. [ Links ]
Budar, K. & Falnes, J. 1975. A resonant point absorber of ocean-wave power. Nature 5517: 478-479. [ Links ]
Corbella, S. & Stretch, D. D. 2012. The wave climate on the KwaZulu-Natal coast of South Africa. Journal of South African institution of civil engineering 54: 45-54. [ Links ]
CSIR 2018. WaveNet: Online/Realtime Waves and Weather. Stellenbosch: Council for Scientific and Industrial Research (CSIR). [ Links ]
De Backer, G. 2009. Hydrodynamic Design Optimization of Wave Energy Converters Consisting of Heaving Point Absorbers. Doctorate Research, Universiteit Gent. [ Links ]
De Backer, G., Vantorre, M., Beels, C., De Rouck, J. & Frigaard, P. Performance of closely spaced point absorbers with constrained floater motion. Proceedings of the 8th European Wave and Tidal Energy Conference 2009, Uppsala, Sweden: 806-817. [ Links ]
Engström, J., Eriksson, M., Isberg, J. & Leijon, M. 2009. Wave energy converter with enhanced amplitude response at frequencies coinciding with Swedish west coast sea states by use of a supplementary submerged body. Journal of Applied Physics 106: 64512-64515. [ Links ]
Evans, D. V. 1980. Some analytic results for 2D and 3D wave energy absorbers. Power From Sea Waves. Edinburgh, UK: Count, B. M. (Ed.), Ac. Press. [ Links ]
Falnes, J. 2002. Optimum control of oscillation of wave-energy converters. International Journal of Offshore and Polar Engineering 12: 147-155. [ Links ]
Flocarda, F. & Finnigan, T. D. 2012. Increasing power capture of a wave energy device by inertia adjustment. Applied Ocean Research 34: 126-134. [ Links ]
Fourie, C. J. S. & Johnson, D. 2017. The Wave Power Potential of South Africa. Power-Gen Africa, Johannesburg, South Africa, 18-20 July 2007 [ Links ]
Garcia-Rosa, P. B., Bacelli, G. & Ringwood, J. V. 2015. Control-Informed Geometric Optimization of Wave Energy Converters: The Impact of Device Motion and Force Constraints. Energies 8: 13672-13687. [ Links ]
Goggins, J. & Finnegan, W. 2014. Shape optimisation of floating wave energy converters for a specified wave energy spectrum. Renewable Energy 71: 208-220. [ Links ]
Hasselmann, K., Barnett, T. P., Bouws, E., Carlson, H., Cartwright, D. E., Enke, K., Ewing, J. A., Gienapp, H., Hasselmann, D. E., Kruseman, P., Meerburg, A., Müller, P., Olbers, D. J., Richter, K., Sell, W. & Walden, H. 1973. Measurements of Win-Wave Growth and Swell Decay During the Joint North sea Wave Project (JONSWAP). Hamburg, Germany: Deutches Hydrographisches Institut. [ Links ]
Joubert, J. R. & Van Niekerk, J. L. 2013. South African Wave Energy Resource Data: A Case Study. University of Stellenbosch, Stellenbosch, South Africa. [ Links ]
Kamarlouei, M., Gaspar, J. F., Calvario, M., Hallak, T. S., Mendes, M. J. G. C., Thiebaut, F. & Soares, C. G. 2020. Experimental analysis of wave energy converters concentrically attached on a floating offshore platform. Renewable Energy 152: 1171-1185. [ Links ]
Khojasteh, D. & Kamali, R. 2016. Evaluation of wave energy absorption by heaving point absorbers at various hot spots in Iran seas. Energy 109: 629-640. [ Links ]
Kramer, M. M. & Frigaard, P. B. Efficient Wave Energy Amplification with Wave Reflectors. Proceedings of the Twelfth (2002) International Offshore and Polar Engineering Conference, Kitakyushu, Japan, 26-31 May 2002: 707-712. [ Links ]
Kurniawan, A. & Moan, T. Multi-objective optimization of a wave energy absorber geometry. 27th International Workshop on Water Waves and Floating Bodies 2012, Copenhagen, 22-25 April, 2012. [ Links ]
Kurniawan, A. & Moan, T. 2013. Optimal geometries for wave absorbers oscillating about a fixed axis. IEEE Journal of Ocean Engineering 38: 117-130. [ Links ]
Leijon, M., Bernhoff, H., Berg, M. & Ägren, O. 2003. Economical considerations of renewable electric energy production - especially development of wave energy. Renew Energy 28: 1201-1209. [ Links ]
Mahnamfar, F. & Altunkaynak, A. 2017. Comparison of numerical and experimental analyses for optimizing the geometry of OWC systems. Ocean. Eng 130: 10-24. [ Links ]
Maria-Arenas, A., Garrido, A. J., Rusu, E. & Garrido, I. 2019. Control Strategies Applied to Wave Energy Converters: State of the Art. Energies 12: 1-19. [ Links ]
McCabe, A. P. 2013. Constrained optimization of the shape of a wave energy collector by genetic algorithm. Renewable Energy 51: 274-284. [ Links ]
Mutombo, N. M.-A. & Numbi, B. P. 2019. Assessment of renewable energy potential in Kwazulu-Natal province, South Africa. Energy Reports 5: 874-881. [ Links ]
National Renewable Energy Laboratory and National Technology & Engineering Solutions of Sandia, L. N. 2017. WEC-Sim Release Notes v3.0 [Online]. WEC-Sim. Available: https://wec-sim.github.io/WEC-Sim/dev/man/release_notes.html. [ Links ]
Penalba, M. & Ringwood, J. V. 2016. A Review of Wave-to-Wire Models for Wave Energy Converters. Energies 9: 1-45. [ Links ]
Pierson, W. J. & Moskowitz, L. A. 1964. A Proposed Spectral Form for Fully Developed Wind Seas Based on Similarity Theory of S.A. Kitaigorodski. Journal of Geophysical Research 69: 5181-5190. [ Links ]
Rahmati, M. T. & Aggidis, G. A. 2016. Numerical and experimental analysis of the power output of a point absorber wave energy converter in irregular waves. Ocean Engineering 111: 483-492. [ Links ]
Ramayia, J. 2012. Overview of renewable energy resources in South Africa. [ Links ]
Rautenbach, C., Barnes, M. A., Wang, D. W. & Dykes, J. 2020. Southern African Wave Model Sensitivities and Accuracies. Journal of Marine Science and Engineering 8: 1-23. [ Links ]
Shadman, M., Estefen, S. F., Rodriguez, C. A. & Nogueira, I. C. M. 2018. A geometrical optimization method applied to a heaving point absorber wave energy converter. Renewable Energy 115: 533-546. [ Links ]
Sjokvist, L., Krishna, R., Rahm, M., Castellucci, V., Hagnestal, A. & Leijon, M. 2014. On the optimization of point absorber buoys. Journal of Marine Science Engineering 2: 477-492. [ Links ]
Soleimani, K., Ketabdari, M. J. & Khorasani, F. 2015. Feasibility study on tidal and wave energy conversion in Iranian seas. Sustainable Energy Technologies and Assessments 11: 77-86. [ Links ]
Son, D., Belissen, V. & Yeung, R. W. 2016. Performance validation and optimization of a dual coaxial-cylinder ocean- wave energy extractor. Renewable Energy 92: 192-201. [ Links ]
Van Paepegem, W., Blommaert, C., De Baere, I., Degrieck, J., De Backer, G., De Rouck, J., Degroote, J., Vierendeels, J., Matthys, S. & Taerwe, L. 2011. Slamming wave impact of a composite buoy for wave energy applications: design and large-scale testing. Polymer Composites 32: 700-713. [ Links ]
Van Riet, T. 2017. Feasibility of ocean energy and offshore wind hybrid solutions. Master of Science, Delft University of Technology, Netherlands. [ Links ]
Vantorre, M., Banasiak, R. & Verhoeven, R. 2004. Modelling of hydraulic performance and wave energy extraction by a point absorber in heave. Applied Ocean Research 26: 61-72. [ Links ]
Verbrugghe, T. 2016. openWEC Manual. 2.0 ed. github: Universiteit Gent. [ Links ]
Zabihian, F. & Fung, A. S. 2011. Review of marine renewable energies: case study of Iran. Renewable and Sustainable Energy Review 15: 2461-2474. [ Links ]
* Corresponding author: Email: marcntumba@gmail.com

