


Servicios Personalizados
Articulo
 Inglés (pdf)
 Articulo en XML
 Referencias del artículo
Indicadores

Links relacionados
-
 Citado por Google
 -
 Similares en Google
Compartir

 Permalink
Journal of Energy in Southern Africa
versión On-line ISSN 2413-3051
versión impresa ISSN 1021-447X
J. energy South. Afr. vol.33 no.1 Cape Town feb. 2022
http://dx.doi.org/10.17159/2413-3051/2022/v33i1a9344
ARTICLES
https://dx.doi.org/10.17159/2413-3051/2022/v33i1a9344
Cost-benefit analysis of wind power integration in distribution networks
M. ZietsmanI; T. AdefaratiII; R.C. BansalIII, I, *; R. NaidooI
IDepartment of Electrical, Electronic and Computer Engineering, University of Pretoria, Pretoria, South Africa
IIDepartment of Electrical and Electronic Engineering, Federal University Oye Ekiti, Nigeria
IIIDepartment of Electrical Engineering, University of Sharjah, Sharjah, United Arab Emirates
ABSTRACT
The capacity of power generation note needs to be increased globally, owing to population growth and industrial revolution. The conventional power plant across the world is inadequate to satisfy growing power demand. By optimally sizing and designing the clusters of renewable energy sources such as wind, microgrid operators can economically and environmentally sustainably provide a clean power solution that can increase the supply of electricity. Wind power (WP) generation can be utilised to reduce the stress on the power plants by minimising the peak demands in constrained distribution networks. Benefits of WP include increased energy revenue, increased system reliability, investment deferment, power loss reduction, and environmental pollution reduction. These will strengthen the performance of the power system and bring economic value to society. Moreover, many challenges are considered when integrating WP into the distribution system. These include protection device miscoordination, fundamental changes in the network topology, transmission congestion, bidirectional power flow, and harmonic current injections. In this paper, the economic cost and benefit analysis of optimal integration of WP into the distribution networks is investigated through a multi-objective analytical method. The aim is to see whether investment in the WP project is economically profitable and technically viable in the distribution system. The results obtained from the study can be utilised by power system operators, planners and designers as criteria to use WP for stimulating economic development and industrial revolution and can allow independent power producers to make appropriate investment decisions.
HIGHLIGHTS:
• The cost-effectiveness of using wind power is proposed.
• The cost-benefit of wind power is analysed.
• Strategic grid planning can be achieved with the results obtained.
• Wind power can be used to improve electricity access.
Keywords: cost-benefit analysis, distribution networks, energy storage system, low voltage, wind power generation.
1. Introduction
The power sector globally is experiencing a need for increasing power supply due to the high standard of living, continuous population growth and industrial revolution (Almasabi et al., 2017; Jiandong et al., 2018). The conventional power plants that have dominated some countries as a means to satisfy ever-increasing load demand are not economically and environmentally feasible due to the depletion of fossil fuel, greenhouse gas emissions, and transmission and distribution system losses (Yu et al., 2018; Adefarati et al., 2016a). Moreover, the increase in the global energy demands can be met by optimally sizing and placing clusters of green energy technologies, including wind power (WP), in the power system (Xia et al., 2018; El Naily et al., 2017; Prakash et al., 2016; Adefarati et al., 2019b). This is achieved by integrating renewable distributed generation (RDG) near the end-users in a low-voltage (LV) (< 1 kV) AC distribution network. The benefits of RDG include the reduction of power system losses, deferment of transmission and distribution costs, improvement of power reliability, quality, regulation and stability, etc. Renewable energy sources, such as solar photovoltaic (PV) systems, concentrated solar power (CSP), fuel cells, biomass, gas turbines, hydroelectric and WP generation, are common types of RDGs. The WP plants and energy storage system (ESS) are embedded in the distribution networks to balance power generation and energy consumption in the distribution network. The ESS is utilised by the microgrid operators to store surplus energy generated via the WP plant in off-peak hours and releases it into the network during energy deficiency hours. This reduces the high peak-demand capacity in the distribution network, via economical scheduling and provides sufficient power to the end-users (El Naily et al., 2017; Cole et al., 2015). However, WP output cannot be consistently made available because of the inter-mittency of wind speed and the location of the WP unit in the distribution network (Jiandong et al., 2018; Yu et al., 2018).
A microgrid system is used for controlling multiple numbers of RDGs and ESS as a single unit of control (Xia et al., 2018; Cole et al. 2015). The microgrid system optimises reliable voltage security, safety and stability for the end-users. This is done with the use of local microcontrollers, protection devices, power flow strategies and energy management methods (Xia et al., 2018). The microgrid couples RDGs (<100 kVA for low voltage networks) to a single point of common coupling, using AC synchronizers, power electronic converters and isolation transformers (Almasabi et al., 2017; Almasabi et al., 2017). It can operate in both standalone and grid-connected mode (Jiandong et al., 2018; Xia et al., 2018; Cole et al., 2015). Power electronic converters are used to convert the DC source generated by a RDG in a grid-synchronized AC voltage system. They assist in controlling power flow, limit stored fault currents, decouple dynamic energy sources from the grid and stabilize the microgrid frequency and voltage when in standalone mode (Jiandong et al., 2018; Adefarati et al., 2016b). The existing traditional LV distribution networks in South Africa are radial design and use a centralised single-source in-feed generation (Almasabi et al., 2017; Prakash et al., 2016). The LV protection standards of such networks depend on fixed-setting relay coordination performance, using inverse definite minimum time (IDMT) curves and unidirectional power flow, and rely on the assumption that fault levels uniformly decrease as the fault moves further away from the single source (Almasabi et al., 2017, Jiandong et al., 2018; Prakash et al., 2016; Cole et al., 2015). These practices allow optimal time-current grading coordination of IDMT curves between the low-cost electromechanical protection devices to detect and isolate internal and external faults successfully within the shortest possible time (Almasabi et al., 2017; Jiandong et al., 2018; Prakash et al., 2016).
There are many challenges that are financially and technically associated with the integration of WP plants into the distribution systems. This comprises changes in the topology of the network, unpredictable characteristics of the wind resource, protection issues, power system security, turbine technology, the stability of the utility grid, voltage control, protective device control, transmission congestion, bi-directional power flow, and power quality (Adefarati et al., 2019b; Bie et al., 2016). By implementing multi-objective functions and using active-reactive control of the WP plant, the challenges can be minimised and the utilisation of renewable power resources in constrained distribution networks improved (Prakash et al., 2016; Pesaran et al., 2016).
In this paper, the economic costs and benefits of WP units that are integrated into power networks are investigated. The optimisation objectives that can be used in the power system include operating cost and network loss targets, renewable energy efficiency, and maximum load reduction satisfaction (Jiandong et al., 2018). The objectives of the power system can be achieved using methods such as nonlinear programming and heuristic intelligent optimisation algorithms (Li et al., 2017; Wang et al., 2017). These methods can be used to maximise the benefits brought by the WP plants, considering construction cost, operation and maintenance and operation costs, and investment costs (Adefarati et al., 2019b; Wang et al., 2017). By optimally integrating the number of embedded WP plants into the distribution network, it is possible to reduce the power system voltage swell, losses and sag, and improve power system voltage profile, stability, reliability, power factor, and voltage regulation (Prakash, et al., 2016). The proposed methodology is implemented to assess the financial feasibility of any investment made to increase access to electricity by using renewable energy technologies. This means that the proposed algorithm can be used to determine whether the WP plant investment is financially and technically feasible in the distribution networks. The benefits of the WP generation units include increased investment deferment, energy revenue, increased system reliability, environmental pollution reduction, and power loss reduction (Almasabi et al., 2017; Adefarati et al., 2019b). The results of this research can be utilised by stakeholders in the power sector to upgrade the existing distribution power system with green energy technologies.
This research proposes a multi-objective formulation for the allocation of WP to maximise savings and improve the performance of the power system. The cost- effectiveness of improving the performance of the power system can be achieved with the application of renewable energy resources. The following research gaps have been noted, based on the literature review presented in Table 1:
i. The effects of renewable energy resources on the distribution system have not been fully addressed.
ii. The distribution system that captured the energy demand, cost savings and payback period with the application of embedded power operation with the utilisation of WP has not been fully used.
iii. The adaptive protection standards will correct the challenges faced when renewable-based microgrid system is integrated into the South African low-voltage radial network.
iv. The integration of the WP into the distribution systems has been studied extensively, but relatively little has been done on the dynamic of power demand.
This paper will address these research gaps to ensure that an effective, adaptive LV protection standards can be investigated, outlined and developed for optimally sized and placed embedded renewable microgrid systems in South African LV radial networks. By doing so, major limitations in the existing LV protection standards will be corrected. Because of the major limitations, this research work carries out the cost-benefits analysis of wind power units that are integrated in the distribution system. By designing a case study using an existing LV radial network in South Africa to address the research gaps, the research outputs will assist in developing an ideal LV protection standard that will cater for an adaptive protection scheme used by the WP in a low-voltage distribution system. This research work is designed to assess the effects of WP on the performance of the active distribution system by using some key performance indicators. The contributions of the study to the existing body of knowledge are as follows:
• Presentation of a technique that allows electricity consumers to safely integrate an optimally sized and placed renewable-based microgrid system in a low-voltage radial distribution network and achieve the full benefits of renewable distributed generation, while still maintaining protection coordination between the grid-connected renewable-based AC microgrids (RBMs) and in-line protection devices.
• By optimally sizing and placing RBMs alongside communication-based intelligent electronic devices and adaptive protection strategies, a protection system can be outlined and developed for embedded RBMs in South African LV radial distribution networks (RDNs).
• The introduction of optimally sized and placed RBMs with adaptive protection capabilities will lead to the reduction of power system losses and of transmission and distribution costs. In addition, the reliability, quality, regulation and stability of the power system will also be improved.
• The output of the research work offers flexible solutions that allow power system designers, planners and operators to choose the best possible solution.
The technique proposed in this research can be used for power system design, planning and operation to effectively enhance uninterrupted power supply at the load points, based on suitable technical and economic information and other input resources. The outputs of the study can be utilised by stakeholders in power sector research to enhance the performance of the distribution network, make the operation of a radial distribution system flexible, reduce the number of electrical faults recorded, and improve access to electricity supply.
2. Motivation of the research work
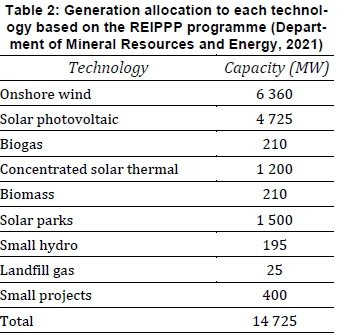
South Africa generates about 229 220 GWh/year of electricity that is locally consumed in commercial, industrial and residential activities. This is 45% of the electricity produced in the whole of Africa. The power plants in South Africa are state-owned and managed through Eskom. They satisfy about 95% of the total power demand in South Africa while the remaining 5% comes from embedded power generation and other sources (including the importing of 9 000 GWh/year from Mozambique). The power generated from South African facilities is as follows: Coal 40 036 MW; gas turbine 3 449 MW; hydro 3 573 MW; wind 2 096 MW; nuclear 1 860 MW; solar PV 1 479 MW; solar CSP 400 MW; landfill gas 7.5 MW; and imported hydro 1 500 MW. South Africa is endowed with renewable energy resources that can provide an acceptable solution to the problem of load shedding that has characterised the country's supply owing to the existing power shortages. The reserve capacity of renewable energy resources of South Africa is the highest in the continent, and it is projected to meet the energy demand of South Africa if fully utilised in a clean and sustainable manner. The renewable energy potential of South Africa has been harnessed by the Department of Energy (DOE) in line with a low-carbon economy strategy and renewable independent power producer procurement programme (REIPPPP) to increase power generation. The REIPPPP is intended to alleviate the economic impacts of load shedding and also contribute substantially to socio-economic growth. REIPPPP also aims to stimulate the development of the sustainable energy sector in South Africa. The generation capacity allocated to each technology by the DOE is given in Table 2. The landmark achievement was made in April 2018 when the power purchase agreement between IPPs and Eskom was signed by the government. This allowed the IPPs to make a formidable investment decision. The DOE awarded 635 MW, 2 562.5 MW, 3 787 MW, 4 676 MW and 687 MW of wind capacity in the REIPPPP bid windows 1, 2,3, and 4.
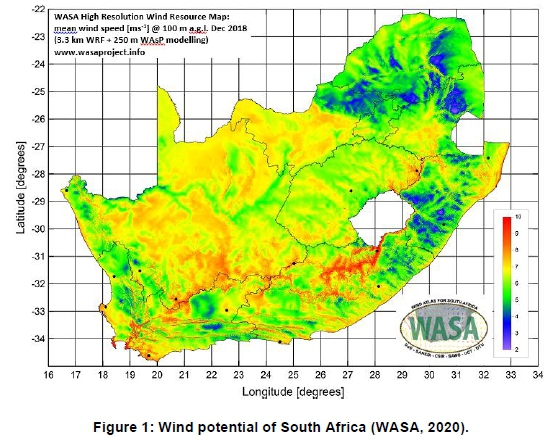
The wind characteristics specified as desirable by wind turbine manufacturers have been found in coastal areas of the Eastern Cape and Western Cape of South Africa. This is the reason for locating the Klipheuwel wind farm and Darling wind farm at, respectively, 5 km west of Caledon, Western Cape and 70 km north of Cape Town, Western Cape. The wind potential of South Africa is presented in Figure 1. Based on the availability of a formidable wind regime in some locations in South Africa, it is expected that between 11 800 MW and 12 500 MW of wind energy projects could be deployed by 2 030. South Africa stands to harness economic and environmental benefits from gradual shifting from brown energy technologies to green energy technologies. To indicate the potential of generating electricity from wind turbines in South Africa, the 10 largest wind turbine power plants and their installed capacity are presented in Table 3.
3. Embedded power operation
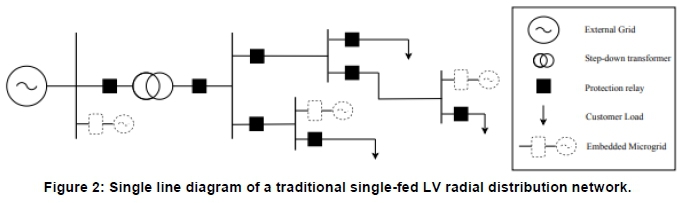
Embedded generation technology is a power system that is designed by directly connecting the dis tributed generation technologies to the distribution network. The embedded generation technology is a small-to-medium-scale power generation source that is closed to the load points and directly connected to the electricity distribution system, as shown in Figure 2. It consists of smaller or modular lar generators that use a variety of generation technologies such as solar, wind, biomass, diesel, crude oil, and small hydro. It provides a reliable and high-quality power supply for critical loads and sensitive industrial equipment. The components of the embedded power operation can be used for peak shaving operation, voltage control, reducing transmission and distribution line losses, and improving the performance of the proposed power system. The decentralised operation of some embedded power systems reduces over-dependency on already depleted fossil fuels and long-distance power transmission and provides a more intelligent power solution with smart grid features. The embedded power system is one option to improve electricity supply in South Africa and it can be used as the main power source in areas where supplying a grid connection is technically or financially impossible.
As Eskom's tariff is increasing annually, South African consumers are considering alternative sources of power supply. Presently, most business organisations have heavily invested in green energy technologies that provide an embedded generation platform for the integration of solar and wind energy with electrical energy from the utility grid as a means to minimise electricity costs (Winkler, 2005).
The technical, economic and environmental benefits of embedded power generation have prompted many business organisations in South Africa to invest in green energy technologies. The capacity of embedded power operations in South Africa is presented in Table 4. The utilisation of the embedded power generation system will enable business owners to use green energy technologies without breaking any enacted legislation. The profit margin of such organisations can be considerably increased if the installed capacity of renewable energy resources is increased based on the Renewable Energy Feed in Tariff (REFIT).
3.1. Wind power system
The wind turbine is a power source that uses rotating machines, such as induction generators, to convert mechanical energy into electrical energy. The hourly power output of a wind turbine is a function of the meteorological data, height tower, wind pattern of the location, air density, wind shear exponent, area of the rotor, and energy conversion efficiency based on the range of the cut-in speed, rated wind speed and cut-out wind speed specifications of the manufacturer. The average output of the WP can be calculated using Equation 1.
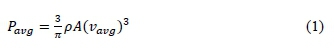
where Pavg(W) is the average power, p is the density of air (1.225 kg/m3 at 15°C and 1 atm), A (m2) is the cross-sectional area that wind passes through, and vavgis the average wind speed normal to A. With the use of the capacity factor (CF) approach given in Equation 2, the annual energy delivered per year can be estimated.
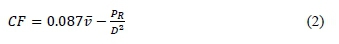
where v is the average wind speed (m/s), PRis the wind turbines rated power (kW), and D is the rotor diameter.
4. Cost-benefits analysis of wind power generation in the distribution networks
The incorporation of WP generation into the distribution network will help the distribution network operator to reduce the stress of the base load on the traditional power generation plants by reducing peak demands via an active-reactive power contribution in the distribution networks. The power contribution from the WP unit can in turn decrease fuel costs and operation and maintenance costs as well as increase the life cycle expectancy of the base load generating units (Adefarati et al., 2019c; Dongxue et al., 2017). WP generation has greater economic and environmental benefits based on the reduction of fuel costs and gas emissions of traditional power generation. It only emits a small amount of greenhouse gas pollutants during its construction phases, making its global emissions negligible (Adefarati et al., 2019c; Adefarati et al., 2017d). Additionally, WP generation has zero fuel costs as it uses kinetic energy from the wind to rotate the blades of the wind turbine (El Naily et al., 2017). This makes it a positive generation source in terms of environmental and economic impacts. The application and location of the WP for power solution mainly depend on some factors such as wind regime of the site, air density, rotor swept area, height of tower, turbine loads, visual influence, noise, capital cost and operation and maintenance costs (Adefarati et al., 2019c; Dongxue et al., 2017). The integration of the WP units into the distribution system would result in the reinforcement of the network due to the aforementioned challenges and increase loading on the network lines with bi-directional flow occurring in the constraint network. The network reinforcement cost per MW installed is highly system-specific and dependent on population density.
4.1 Investment cost function
The minimum operation cost of wind generation, considering the cost of purchasing electricity and the cost of the operations of the WP unit, is as given in Equations (3-6).
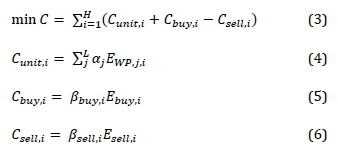
where H is the total time of the schedule period dependent on the length of the step size and schedule cycle, i is the label of time frame, iε{1,2,3,...,H}. Cuniti, Cbuy,i and Csell,iare the operation costs of the WP unit, the cost of purchasing electrical energy from the utility grid and the revenue of selling electrical energy in the ith time frame. a.j and ERDCjt are the cost coefficient and electricity generation in the ithtime frame of jthembedded WP unit. j £{1,2, 3..., L}, L is the total number of WP units connected to the distribution network. pbuy,i
and Ebuy,iare the price of purchasing electricity and the electricity purchased in the ithtime frame. βsell,iand Esell,iare the price of selling electricity and the electricity sold in the ith time frame.
4.2 Payback period
The payback period is the time required to recover any investment expended on a renewable energy project. The feasibility of green energy technologies is directly proportional to its payback period. The payback period can be used by the independent power providers and microgrid operators as a key performance indicator to evaluate the short and long-term benefits of a project. A microgrid system that has a shorter payback period is economically viable and operates with higher sustainability when compared to a project that has a longer payback period, as shown in Equation 7.
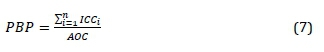
where ICC is the initial capital cost, AOC is the annual operating cash flow and PBP is the payback period.
5. Multi-objective function
By optimally sizing and placing the number of embedded RBMs in the LV RDN, it will be possible to reduce power system losses, initial investment costs, fault contribution limits, and voltage swell and sag, and to improve system voltage profiles, system reliability and stability, voltage regulation and system power factor. Optimally sized and placed RBMs can assist in minimising islanding and in the improvement of the overall protection challenges, as the extent to which the protection coordination is affected depends on size, location and number of embedded RDG units connected to the LV RDN. To obtain the optimal operation cost, a robust algorithm can be easily used to handle the multi-objective stochastic processes and discontinuities (Almasabi et al., 2017; Adefarati et al., 2016a). The elitist real genetic, a practical swarm algorithm or probabilistic load flow based on cumulates method (PLF-CM) can be used to find the maximum and minimum rated capacities of the cost optimisation function for the integration of WP plants in the distribution network (Chen et al.,2016; Bansal et al.,2017a; Kumar et al., 2019). Randomly placed WP units can cause technical problems, such as unwanted harmonics, voltage fluctuation and system transients (Prakash et al., 2016). The WP units can be utilised by the microgrid operators for peak shaving operation to reduce peak demands on the utility grid and minimise costs at the load points (Bansal et al., 2001b; Bansal et al., 2007c; Bansal et al., 2008d; Adefarati et al.; 2017e; Adefarati et al., 2017f). In this paper, the economic cost and benefit analysis of optimal integration of WP into distribution networks is investigated with the use of a multi-objective analysis technique. The optimal placing and sizing of the WP units can considerably enhance the reliability of the distribution network. An objective function can be determined by using the formula in Equation 8.
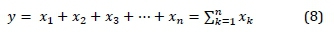
where x1is the system power losses, x2 is the voltage profile factor, x3 is the short-circuit current factor, x4 is the capacity factor, and n is the number of parameters. The objective function is expressed as in Equation 9.
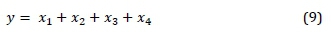
where each objective factor parameter can be defined as in Equations 10-13.
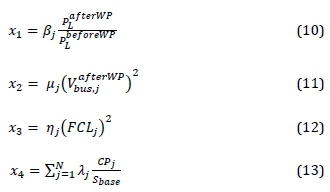
where μ is the weight factor of voltage profile, β is the weighted factor of system losses, n is the weighted factor of fault current level, and λ is the weighted factor of the WP unit capacity.
5.1 Optimisation constraints
The power system constraints proposed in the study are basic components that are crucial for enhancing the general performance of the power system, such as the efficiency of the distribution network and power flow. The constraints of the system are essential to ensure that maximum performance, power flow and efficiency of the LV RDN can be achieved. The objective of the proposed power system can be achieved by using the constraints listed below.
5.1.1 Weighted factors
The sum of the weighted factors selected in the study is equal toi, as in Equation 14.
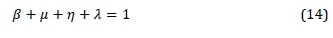
where the weighted factors can be given by Equations 15-18.
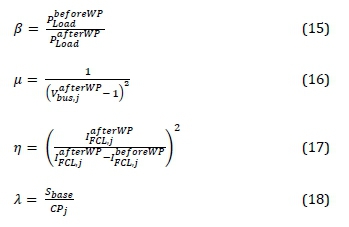
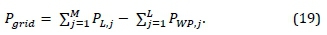
5.1.2 Power balance constraint
When the WP unit is purchasing electricity from the distribution network, Pgrid is positive, otherwise it means that the WP unit is selling electricity to the distribution network. Plj is active power of jth load, j ε{1, 2, 3,..., M}, M is the total number of connected loads. Pwp,j is the output of the jth WP unit. The total load demand of the system should be equal to the total sum of the generated active power by the embedded WP and power obtained from the utility grid as a measure to ensure minimal bi-directional power flow in the distribution network, as shown in Equation 19.
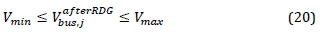
5.1.3 Bus voltage constraint
The bus voltage presented in the research work varies with a permissible bus voltage tolerance of 5% lower and upper limits, i.e. Vmin> 0.95 per unit (pu) and Vmax< 1.05 pu, as shown in Equation 20.
5.1.4 Short circuit current constraint
The fault current level obtained in the proposed distribution network should not be more than the acceptable short circuit current, overcurrent and earth fault level to guarantee the safety of consumers at the load points as well as protection of the radial distribution network and its associated components, as shown in Equation 21.
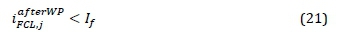
where Ifis fault current level at the bus bar.
5.1.5 Power factor constraints
Based on the South African grid code requirements for renewable power plants (Bansal et al., 2017a), the renewable power plants (RPPs) will operate at unity power factor measured at the point of connection (POC). The power factor of the WP unit being installed may vary within a specified range due to changes in loads and the type of WP units embedded in the network, as in Equation 22.
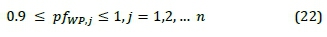
where n is the number of connected WP units.
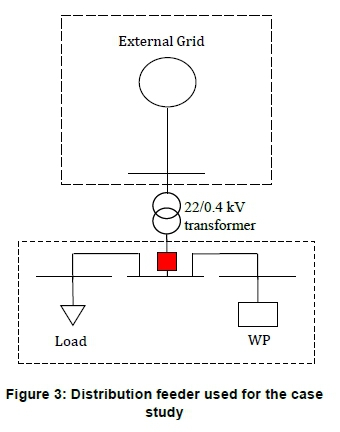
6. Case study
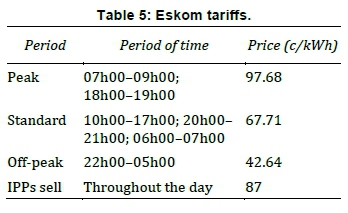
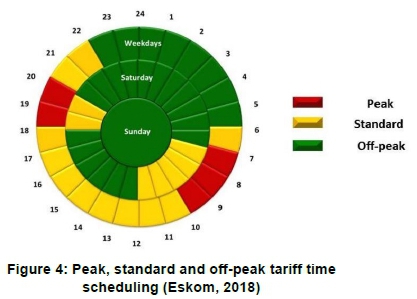
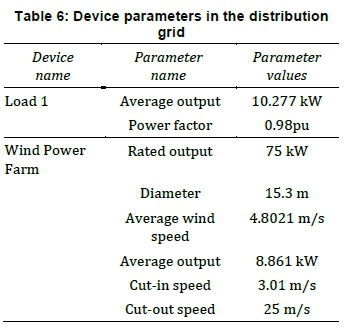
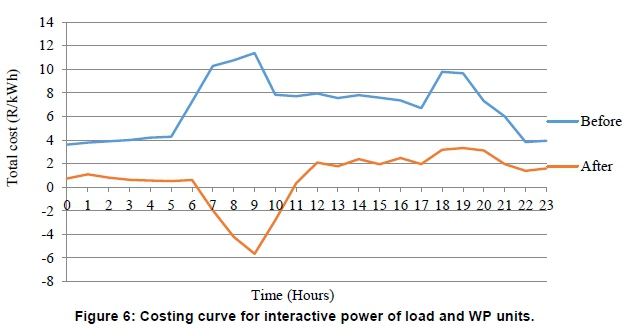
The assessment of the radial distribution network is carried out in the study by utilising the prerequisites listed in the categories A1 and A2 (0-100 kVA) for LV connection in the distribution networks. This is in accordance with the South African grid code requirements for RPPs, SANS 10142-1 and IEEE 1547 (Eskom Transmission Division, 2014; South African National Standard, 2012; Basso et al., 2004). An interactive operational strategy is applied to the proposed distribution network that is composed of an onshore 75 kW WP plant. A single load representing the sum of all the connected loads in the distribution network feeder is shown in Figure 3. It is a 22 kV/400 V feeder located in Port Elizabeth, South Africa. The connected load uses an average power of 10.277 kW/day and an estimated power of 7.4 MW/month. The metering point used in this investigation is located on the LV side of the 16 KVA transformer. The electricity tariff scheduling and list of the time of use (TOU) charges of Eskom are presented in Table 5 and Figure 4 respectively. The tariff cost comparison is based on a non-local authority (Eskom, 2018) and considering a low demand season (September to May) as well as a wholesale electricity pricing system rate. The basic information about the WP plant and connected load is presented in Table 6. The hourly output of the WP plant and simplified connected load of a typical day in May is shown in Figure 5. Using information from Tables 4 and 5, the hourly cost estimation is presented in Figure 6.
7. Results and discussion
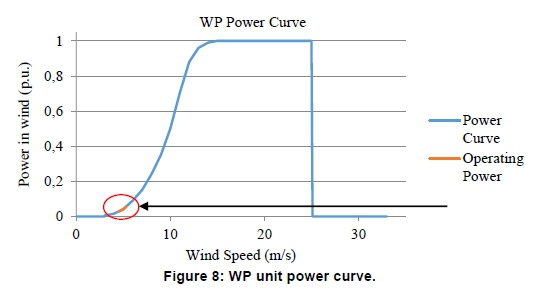
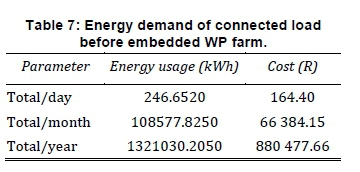
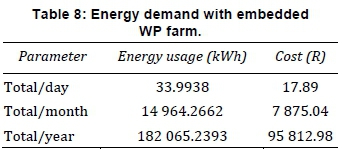
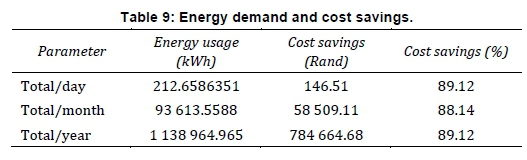
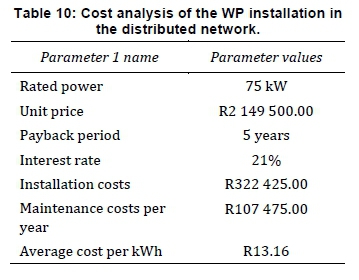
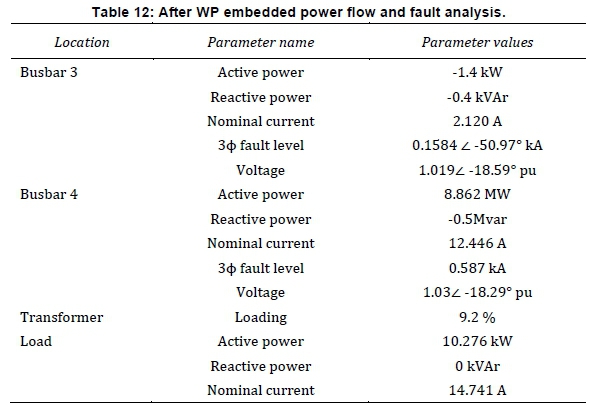
This case study has been adapted from a local Eskom LV-RDN and referred to as Feeder A, as can be seen in Figure 7. The information was used to simulate the load flow and fault current levels in Digsilent PowerFactory. From Equation 19, it can be seen that the power balance constraint is met where minimal bi-directional power flow occurs. This is essential to maintain the condition between existing protection devices in the distribution network. This shows that the grid only needs to supply a total of 1.415 kW to the connected load, whilst the WP plant supplies the remaining 8.862 kW. Feeder A is an 11 kV network, stepped down to 400 V, using a 200 kVA distribution transformer. The LV side of the distribution transformer supplies load point 1, as can be seen in Figure 7. The 400 V aluminium cross-linked polyethylene insulated 150 mm2 underground cable is rated at 292 A. The overhead lines (rabbit-type aluminum conductor steel reinforced) have a current-carrying capacity of 186 A. Based on the cable capacity, it will be possible to feed approximately 200 kVA, where each overhead line can feed approximately 140 kVA in the LV RDN before overloading occurs. This is adequate for the radial distribution network component for transferring power to the LV network loads. The power curve of the WP plant can be seen in Figure 8, where the average power in the wind operation is 0.03593 pu The information can then be used to determine the daily, monthly, and yearly energy output and costs of the load and the WP plant, as seen in Tables 6 and 7. The average cost per kWh of Table 6 is 67 cents (c), whereas the average cost per kWh with the embedded WP farm is 53 c. Using the information presented in Tables 7-9, the cost and payback time are estimated. The annual cost savings with the application of WP is R784 664.68 per annum; this translates to annual savings of 89.12% when the present scenario is compared with before embedded WP farm scenario. The average cost per kW for a wind turbine is R15403.23 and the estimated costs are presented in Table 10. The annual maintenance cost is 25% of the initial cost price of the WP unit. An assumption is made that the tariff rate increases by 7% every two years.
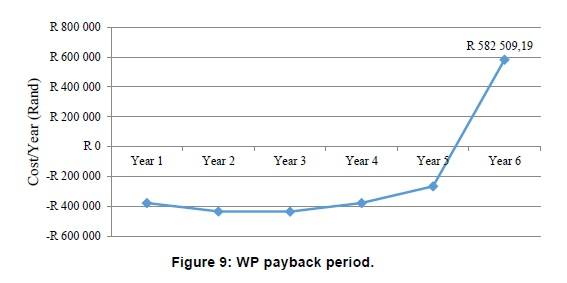
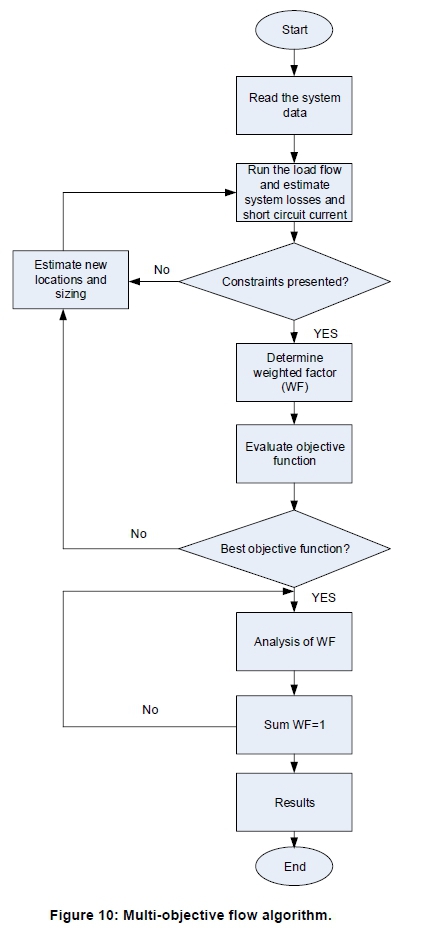
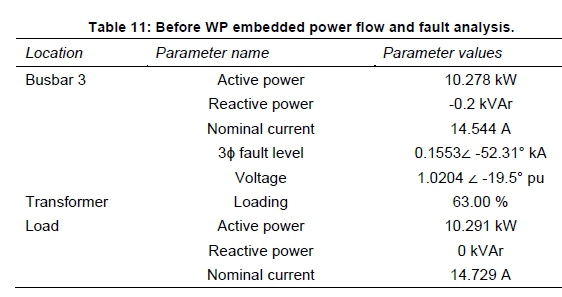
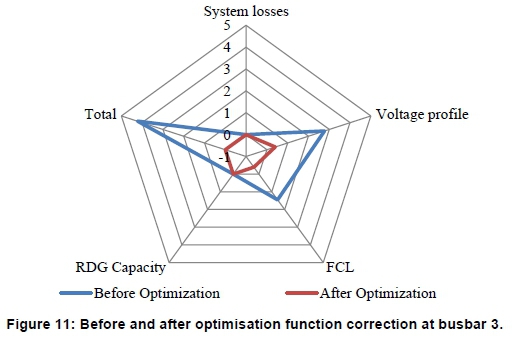
It can be seen from Figure 9 that in the first year a total of R378 638.75 is owed, and that after five years the wind turbine is paid back, with a profit of R582 509.19 in the sixth year. This motivates the total cost expenditure of the WP plant in the distribution feeder as it supplies enough power on average to power the connected load. It can be seen that the voltage constraint is met when the minimum and maximum voltage is maintained in the distribution network with the embedded WP farm. It was previously mentioned that randomly placed WP units can cause technical problems such as voltage fluctuations, unwanted harmonics and system transients. By using a multi-objective function and following the flow algorithm in Figure 10, it can be determined whether the embedded WP farm is optimally placed in the distribution network. If not, the optimisation constraints need to be corrected to ensure increased system reliability, power loss reduction, and minimal protection miscoordination in the distribution network. The results in Table 10 have been determined using Digsilent PowerFactory. The results are analysed both before and after the embedded WP plant, as seen in Tables 11 and 12. The results obtained from the simulation are presented in Table 13.
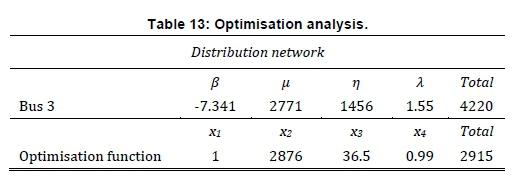
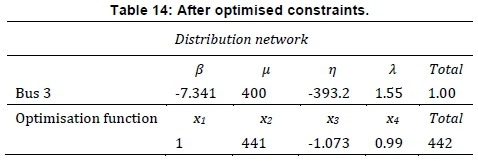
It can be seen in Table 13 that the embedded power system is not optimised in a situation where the sum of the weighted factor constraints is not equal to 1. By increasing the voltage from 1.03 pu to 1.05 pu at bus 3, the weighted factor of the voltage profile (μ) can be maximised. By decreasing the fault level from 0.1584 kA to 0.05241 kA with the application of a fault current limiter, the fault current level weight factor (n) can be minimised. The optimised result can be seen in Table 13. From Table 13, the sum of the weighted factor constraints is now equal to 1. This ensures an optimised system performance with minimal losses and maximise system performance. It can be seen from the results obtained in Figure 11 that the operation of bus 3 is utilised as the losses, voltage profile and short-circuit level have been minimised.
8. Comparing the results obtained with the results of other state-of-the-art methods
The novelty and contribution of the study have been justified by comparing the results obtained with other state-of-the-art methods that operate in similar conditions under the same or different system configurations (see Table 15. The outcomes of the proposed linear distribution system based on the technique adopted in the study show that there is a considerable improvement in the annual energy cost savings when compared with (Azarousal, et al., 2021a; Zhang, el al., 2019; Kusakana, 2018; Mbungu et al., 2019; Numbi, et al., 2017; Supriya, et al., 2011; Azarousal, et al., 2019b). This demonstrates a significant contribution to the existing body of knowledge, and the outcomes of the research work can be used in the power sector to manage the optimal operation of the distribution systems.
9. Conclusion
The evaluation of a WP farm performance can be carried out by analysing cost, power quality, benefits, etc. The results obtained from the assessment of the radial distribution system with the application of some key performance indicators can be used for placing and sizing WP units. The cost and benefits, such as environmental pollution reduction, annual energy savings and revenue, are significant factors that should be considered by the stakeholders in the power sector while taking managerial decisions on the installation of renewable energy units in the distribution network. This is to ensure both the end-user and generation industry benefit from integrated WP. From the presented results, it can be seen that the integration of a WP farm in a distribution network has its financial benefits. The outcomes of the paper can be used by key players, financiers and local partners in the wind energy sector to ensure the smooth implementation of renewable energy projects. The paper presented the technical and financial indicators that many countries need to take into consideration when planning and designing wind energy projects. The results obtained from the study show that the integration of an optimally sized WP in the distribution system is economically profitable and technically viable. The results obtained from the study can be utilised by the South African government and international organisations to achieve sustainable energy planning processes and strategic grid planning for electricity.
10. Recommendation for future work
The protection coordination of the embedded WP farm in the power system needs further research to fully utilise the WP plant in a distribution network. Further studies can be done to look at an adaptive distance protection method, using the developed hybrid adaptive algorithm, to solve for the new admittance settings. The adaptive distance protection and adaptive overcurrent protection can be set as main and back-up, respectively, for a renewable-based AC microgrid. This will further enhance the protection and reliability of the overall renewable-based AC microgrid system. In addition to this, further research work can be carried out on different components of microgrids system such as geother-mal, thermal load, gas turbine, fuel cells, hydro pumped storage, thermal load and microturbine, and on evaluating their performance on the low voltage radial distribution system.
Author roles
Conceptualisation: M. Zietsman, T. Adefarati, R. C. Bansal
Data curating: M. Zietsman, T. Adefarati
Formal analysis: M. Zietsman, T. Adefarati and R. C. Bansal
Investigation: M. Zietsman, T. Adefarati, R. C. Bansal and R. Naidoo
Methodology: M. Zietsman, T. Adefarati, R. C. Bansal and R. Naidoo
Project administration: R. C. Bansal and R. Naidoo
Supervision: R. C. Bansal and R. Naidoo
Validation: M. Zietsman, T. Adefarati, R. C. Bansal and R. Naidoo
Visualisation: M. Zietsman, T. Adefarati, R. C. Bansal and R. Naidoo
Writing - original draft: M. Zietsman and T. Adefarati
Writing - review & editing: T. Adefarati and R. C. Bansal
References
Abri, R. S. A., El-Saadany E. F. and Atwa, Y. M. 2013. Optimal placement and sizing method to improve the voltage stability margin in a distribution system using distributed generation. IEEE Transactions on Power Systems, 28(1):326-34. [ Links ]
Acharya, N., Mahat, P. and Mithulananthan, N. 2006. An analytical approach for DG allocation in primary distribution network. International Journal of Electrical Power & Energy Systems, 28:669-78. https://doi.org/10.1016/j.ijepes.2006.02.013. [ Links ]
Adefarati, T. and Bansal, R. C. 2016. Integration of renewable distributed generators into the distribution system: a review. IET-Renewable Power Generation, 10 (7): 873-884. DOI: 10.1049/iet-rpg.2015.0378. [ Links ]
Adefarati, T. and Bansal, R. C. 2019. Energizing renewable energy systems and distributed generation. In pathways to a smarter power system. Academic Press, Elsevier: 29-65. DOI:10.1016/C2017-0-03015-X. [ Links ]
Adefarati, T. and Bansal, R. C. 2019. Reliability, economic and environmental analysis of a microgrid system in the presence of renewable energy resources. Applied Energy, 236: 1089-1114. DOI: 10.1016/j.apenergy.2018.12.050. [ Links ]
Adefarati, T. and Bansal, R.C. 2017. Reliability and economic assessment of a microgrid power system with the integrationof renewable energy resources. Applied Energy, 206: 911-933. DOI: 10.1016/j.apenergy.2017.08.228. [ Links ]
Adefarati, T. and Bansal, R. C. 2017. Impacts of PV-wind-diesel-electric storage hybrid system on the reliability of a power system. Energy Procedia, 105: 616-621. [ Links ]
Adefarati, T. and Bansal, R. C. 2017. Reliability and economic evaluation of a micro grid power system. Energy Procedia, 142: 43-48. [ Links ]
Almasabi, S., Sulaeman, S., Nguyen, N. and Mitra, J. 2017. Cost Benefit Analysis for Wind Power Penetration. In Proc. IEEE North American Power Symposium (NAPS), Morgantown, WV, USA, 16th November, 2017. DOI: 10.1109/NAPS.2017.8107316. [ Links ]
Aman, M. M., Jasmon, G. B. Bakar, A. H. A. Mokhlis, H. 2014. A new approach for optimum simultaneous multi-DG distributed generation units placement and sizing based on maximisation of system loadability using HPSO (hybrid particle swarm optimisation) algorithm. Energy, 66:202-15. [ Links ]
Atwa, Y. M., El-Saadany, E. F., Salama M. M. A. and Seethapathy. R. 2010. Optimal renewable resources mix for distribution system energy loss minimisation. IEEE Transactions on Power Systems, 25(1): 360-70. [ Links ]
Azarousal, M., Ouassaid, M. and Maaroufi, M. 2021. Optimal energy flow management of a grid-tied photovoltaic-wind-battery system considering cost, reliability and CO2 emission. International Journal of Photoenergy, 2021:1-20. [ Links ]
Azarousal, M., Ouassaid, M. and Maaroufi, M. Optimal control for energy dispatch of a smart grid tied PV-wind-battery hybrid power system. 2019. Third International conference on Intelligent Computing in Data Sciences (ICDS), 2830th Oct. 2019, Marrakech, Morocco. [ Links ]
Bansal, R. C. 2017. Handbook of Distributed Generation: Electric Power Technologies, Economics and Environmental Impacts, Springer, Cham, Switzerland. DOI: 10.1007/978-3-319-51343-0. [ Links ]
Bansal, R. C., Bhatti, T. S. and Kothari, D. P. 2001. Some aspects of grid connected wind electric energy conversion systems. Interdisciplinary Journal of Institution on Engineers (India), 82 (1): 25-28. [ Links ]
Bansal, R.C. and Bhatti, T. S. 2008. Small Signal Analysis of Isolated Hybrid Power Systems: Reactive Power and Frequency Control Analysis. Alpha Science International, Oxford, U.K. [ Links ]
Bansal, R. C. Bhatti, T. S. and Kumar. V. 2007. Reactive power control of autonomous wind-diesel hybrid power systems using ANN. Proc. 8th International Power Engineering Conference (IPEC), Singapore, 3rd to 6th December, 2007. 1376-1381. [ Links ]
Basso, T. S. and DeBlasio, R. 2004. IEEE 1547 series of standards: Interconnection issues. IEEE Transactions on Power Electronics, 19 (5): 1159-1162. DOI: 10.1109/TPEL.2004.834000. [ Links ]
Bie, P., Zhang, B., Deng, W., Luo, Y., Zhao, S., Li, M., Zeng, Y., Guojun, L., Yong, W. and Guoyan, C. 2016. Economic benefits evaluating of wind power integration considering transmission congestion. Clemson University Power Systems Conference (PSC), Clemson, SC, USA, 8th to 11th March, 2016. DOI: 10.1109/PSC.2016.7462830. [ Links ]
Chen, H., Jiang, X., Yu, Y. and Wu, Y. 2016. Optimisation of energy storage system capacity for wind farms based on cost-benefit analysis. IEEE PES Asia-Pacific Power Energy Engineering Conference (APPEEC), Xi'an, China, 25th to 28th October, 2016. DOI: 10.1109/APPEEC.2016.7779743. [ Links ]
Cole, S., Martinot, P, Rapoport, S. and Papaefthymiou, G. 2015.Cost-benefit analysis of a coordinated grid development in the North Sea, in IEEE Eindhoven PowerTech, PowerTech, Eindhoven, Netherlands, 29th June to 2nd July, 2015. DOI: 10.1109/PTC.2015.7232385. [ Links ]
Department of Mineral Resources and Energy, Independent producer procurement programme. Available online: https://www.ipp-renewables.co.za/. Accessed: January, 2022. [ Links ]
Dongxue, L., Jiye, Y., Dayong, Y., Songnan, L., Tianqi, L., Meijun, L. and Tao, L. 2017. Analysis of operation benefit of wind power integration based on wind-thermal power price compensation model. International Conference on Sensing, Diagnostics, Prognostics, and Control (SDPC), Shanghai, China, 16th to 18th, Aug., 2017. DOI: 10.1109/SDPC.2017.150. [ Links ]
EE publishers, Small scale on-grid solar photovoltaic embedded generation in South Africa. Available online: https://www.ee.co.za/wp-content/uploads/2014/06/energize-re-vol2-pg-54-58.pdf, Accessed: January, 2022. [ Links ]
El Naily, N., Saad, S. M., Rajab, Z. and Mohamed, F. 2017. An intelligent protection scheme to mitigate the impact of integrating large share wind energy resources in a weak distribution network. Wind Engineering, 41 (6): 383-396. DOI:10.1177/0309524X17721995. [ Links ]
Eskom transmission division. 2014. South African grid code requirements for renewable power plants - Version 2.8, Available online: https://www.sseg.org.za/wp-content/uploads/2019/03/South-African-Grid-Code-Requirements-for-Renewable-Power-Plants-Version-2-8.pdf, Accessed: January, 2022. [ Links ]
Eksom, 2018. Schedule of standard prices for ESKOM tariffs 1 April 2018 to 31 March 2019 for non-local authority supplies, and 1 July 2018 to 30 June 2019 for local authority supplies. Avaialble online: https://rise.es-map.org/data/files/library/south-africa/Documents/Energy%20Access/South%20Africa_Tariffs%20and%20charges%202018.pdf, Accessed: January, 2022. [ Links ]
Hung, D. Q. and Mithulananthan, N. 2013. Multiple distributed generator placement in primary distribution networks for loss reduction. IEEE Transactions on Industrial Electronics, 60(4):1700-8. [ Links ]
Jiandong, D., Qian, S. and Lupeng, C. 2018. Optimal Operation of Distribution Network in Pursuit of High Effective Consumption of Distributed Wind. 13th IEEE Conf. Ind. Electron. Appl., Wuhan, China, 31st, May to 2nd June, 2018. DOI: 10.1109/ICIEA.2018.8397976. [ Links ]
Kanwar, N. Gupta, N. Niazi, K. R. Swarnkar, A. Bansal, R. C. 2017. Simultaneous allocation of distributed energy resource using improved particle swarm optimisation. Appl. Energy, 185:1684-93. [ Links ]
Kumar, A., Meena, N.K., Singh, A.R., Deng, Y., He, X., Bansal, R. C. and Kumar, P. 2019. Strategic integration of battery energy storage systems with the provision of distributed ancillary services in active distribution systems. Applied Energy. 253 (113503): 1-16, 2019. DOI: 10.1016/j.apenergy.2019.113503. [ Links ]
Kusakana, K. 2018. Impact of different South African demand sectors on grid-connected PV systems optimal energy dispatch under time of use tariff. In Sustainable Cloud and Energy Services, Springer, Cham, 243-260. [ Links ]
Lee, S. H. and Park, J. W. 2009. Selection of optimal location and size of multiple distributed generations by using Kal-man filter algorithm. IEEE Transactions on Power Systems, 24 (3):1393-400. [ Links ]
Li, R., Wang, W., Chen, Z., Jiang, J. and Zhang, W. 2017. A review of optimal planning active distribution system: Models, methods, and future researches, Energies, 10(11): 1-27. DOI: 10.3390/en10111715. [ Links ]
Lia, Y. Fenga, B. Lia, G. Qib, J. Zhaoc, D. Mud, Y. 2021. Optimal distributed generation planning in active distribution networks considering integration of energy storage, Applied Energy, doi.org/10.1016/j.apenergy.2017.08.008. [ Links ]
Martins, V. F. and Borges, C. L. T. 2011. Active distribution network integrated planning incorporating distributed generation and load response uncertainties. IEEE Transactions on Power Systems, 26:2164-72. [ Links ]
Mbungu, T. N., Bansal, R. C. and Naidoo, R. M. 2019. Smart energy coordination of autonomous residential home. IET Smart Grid, 2(3): 336-346. [ Links ]
Numbi, B.P. and Malinga, S. J. 2017. Optimal energy cost and economic analysis of a residential grid-interactive solar PV system- case of eThekwini municipality in South Africa. Applied Energy, 185: 28-45. [ Links ]
Pesaran, M., Huy, P. D. and Ramachandaramurthy, V. K. 2016. A review of the optimal allocation of distributed generation: Objectives, constraints, methods, and algorithms. Renewable and Sustainable Energy Reviews, 75: 293-312, 2017.DOI: 10.1016/j.rser.2016.10.071. [ Links ]
Prakash P. and Alternate, D. K. K. 2016. Optimal sizing and siting techniques for distributed generation in distribution systems: A review. Renewable and Sustainable Energy Reviews, 57: 111-130. DOI: 10.1016/j.rser.2015.12.099. [ Links ]
Shaaban, M. F, Atwa, Y. M, El-Saadany, E. F. 2013. DG allocation for benefit maximisation in distribution networks. IEEE Transactions on Power Systems, 28(2): 639-49. [ Links ]
South African National Standard (SANS), SANS 10142-1: 2012 The wiring of premises Part 1: Low-voltage installations. 2012. [ Links ]
Supriya, C. S. and Siddarthan, M. 2011. Optimisation and sizing of a grid-connected hybrid PV-Wind energy system. International Journal of Engineering Science and Technology, 3(5): 4296-4323. [ Links ]
Viral, R. Khatod, D. K. 2015. An analytical approach for sizing and siting of DGs in balanced radial distribution networks for loss minimisation. International Journal of Electrical Power and Energy Systems, 67:191-201. [ Links ]
Wang, C. and Nehrir, M. H. 2004. Analytical approaches for optimal placement of distributed generation sources in power systems. IEEE Trans. Power Syst., 19(4):2068-76. [ Links ]
Wang, Y., Yu, Y. and Zhang, J. 2017. Analysis for distribution network on hosting capacity of distributed wind turbines considering additional income under procedure conditions. The Journal of Engineering, 2017 (13): 19-20. DOI: 10.1049/joe.2017.0556. [ Links ]
Wikipedia, List of power stations in South Africa. Available online: https://en.wikipedia.org/wiki/List_of_power_stations_in_South_Africa. Accessed: January, 2022. [ Links ]
Wind Atlas for South Africa (WASA). Available online: http://www.wasaproject.info/. Accessed: January, 2022. [ Links ]
Winkler, H. 2005. Renewable energy policy in South Africa: policy options for renewable electricity. Energy Policy, 33: 27-38 [ Links ]
Xia, S., Chan, K. W., Luo, X., Bu, S., Ding, Z. and Zhou, B. 2018. Optimal sizing of energy storage system and its cost-benefit analysis for power grid planning with intermittent wind generation. Renewable Energy, 122: 472-486. DOI: 10.1016/j.renene.2018.02.010. [ Links ]
Yu, H., Zhang, C., Deng, Z. and Bian, H. 2018. Economic optimisation for configuration and sizing of micro integrated energy systems. Journal of Modern Power Systems and Clean Energy, 6:330-341. DOI: 10.1007/s40565-017-0291-2. [ Links ]
Zhang, S. and Tang, Y. 2019. Optimal schedule of grid-connected residential PV generation systems with battery storages under time-of-use and step tariffs. Journal of Energy Storage, 23:175-182. [ Links ]
* Corresponding author: Email: rcbansal@ieee.org

