


Services on Demand
Article
 English (pdf)
 Article in xml format
 Article references
Indicators

Related links
-
 Cited by Google
 -
 Similars in Google
Share

 Permalink
Journal of Energy in Southern Africa
On-line version ISSN 2413-3051
Print version ISSN 1021-447X
J. energy South. Afr. vol.33 n.1 Cape Town Feb. 2022
http://dx.doi.org/10.17159/2413-3051/2022/v33i1a8611
ARTICLES
https://dx.doi.org/10.17159/2413-3051/2022/v33i1a8611
Monitoring the natural recovery of potential induced degradation in poly-crystalline photovoltaic modules
I.M. Kwembur*; J.L. Crozier McCleland; E.E. van Dyk; F.J. Vorster
Department of Physics, Nelson Mandela University, Port Elizabeth, South Africa
ABSTRACT
Potential induced degradation (PID) is a defect that has a severe effect on the performance of photovoltaic (PV) modules in field conditions. It is caused by leakage currents and the accumulation of sodium ions (Na+) between the anti-reflective coating and the encapsulation. In the experiment reported on here, PID was artificially induced through a PID stress test, where the surface of a poly-crystalline p-ttype module was covered with an aluminium sheet connected to the positive terminal of a high voltage power supply (1000 V), while the short-circuited module terminals was biased to the negative terminal. This stress test was applied to two similar poly-crystalline p-type modules, A and B, for 48 hours and 20 hours respectively. The duration of the stress test determines the degree of PID severity induced. The length of the test resulted in Module A's power decreasing by 88% and Module B's by 40%. Electroluminescence and current-voltage measurements were taken at regular intervals over a period of more than a year to monitor the natural recovery of the modules. These measurements show that the natural recovery of severe PID modules is possible, but slow. After the test period, the maximum power of Module A and Module B had recovered to 63% and 96% of the original level. PID experienced in the field is generally less severe than for the modules in this study, so PID recovery could be achieved by adopting a process of setting affected strings at open-circuit in turns.
HIGHLIGHTS:
• Natural recovery of PID-affected modules is possible.
• Susceptibility of a module to PID is dependent on the bill of materials.
• Modules adversely affected by PID may only recover to a limited extent.
Keywords: electroluminescence; open circuit voltage; current-voltage measurements
1. Introduction
Photovoltaics (PV) has been recognised as a cost-competitive source of renewable energy because it is clean, noise-free, inexhaustible, and requires minimal maintenance (Nelson, 2008). In the past decade, the number and size of PV power plants has grown, with the largest in South Africa being in the order of 100 MW (Jäger-Waldau, 2019). New large-scale PV plants are increasingly using longer strings of modules, increasing the string voltages to 1500 V. Using higher string voltages has the advantage of using fewer inverters, achieving more efficient AC to DC conversion, lowering the balance of system costs, and minimising power losses at the step-up transformers (West, 2012). Modules in long strings are, however, susceptible to potential induced degradation (PID) because increased string voltage increases the potential difference between the modules and ground (Pingel, et al., 2010). Studies of failures in the field have indicated that PID results in a mean degradation rate of 15% per annum (Köntges, et al., 2010).
The increased use of new high energy-efficiency transformer-less string inverters, as opposed to bulkier and low energy-efficient transformer-based inverters, causes high voltages to develop between module frames (grounded) and the DC circuit of the module string (Kumar and Kumar, 2014). The grounding of either the positive or negative of a string depends on the type of modules in use (n-type or p-type) and helps to isolate the grid circuitry from the PV string, which minimises the chances of PID occurrence (Oh Jaewon, 2016). The high system voltage may drive an electrical leakage current between the cells and the module's cover glass and frame. The high voltage difference between the cells and the glass may cause sodium ions (Na+) that are present in soda-lime glass to drift to the surface of the cells via the polymeric encapsulant material. Eventually, at a high enough concentration, sodium ions Na+ may end up diffusing into solar cells, causing the performance-limiting defect known as PID (Naumann et al., 2013; Luo et al., 2017; Boulhidja et al., 2020). PID causes a significant drop in the power output of modules, and so is a major reliability concern in any type of solar PV (Hacke et al., 2013; Akcaoglu et al., 2019). As modules age in the field, the likelihood of PID occurrence increases, due to moisture ingress that may promote leakage currents and the mobility of sodium ions Na+ present in the glass (Luo et al., 2017).
PID-affected modules can be detected using electroluminescence (EL) imaging and light current-voltage (L-IV) measurements. The EL images of a PID-free module display nearly uniform brightness except for areas along the fingers, busbars and randomly distributed dark spots. PID-affected cells appear less bright and seem to be shunted (Naumann et al., 2014; Luo et al., 2017; Fuyuki and Kitiyanan, 2009). PID-affected modules tend to exhibit a 'checker-board' EL intensity pattern, especially at a forward current corresponding to 10% of the short circuit current for modules least affected by PID (Kwembur et al., 2020). In a module, an individual cell's PID susceptibility may depend on its position within the module strings and is uniquely affected (Wang et al., 2019; Luo et al., 2017; Martínez-Moreno, Figueiredo, & Lorenzo, 2018).
2. PID mechanism in PV modules
The negative impact of PID on PV modules is continually studied, and theories on the causes continue to evolve and hence remain work in progress. This is because modules from the same technology with the same manufacturing specifications or bill of materials, may exhibit PID effects that are different under similar induced environmental stress conditions (Luo et al., 2017). The possible leakage current paths for a module under high voltage PID-induced stress are the following (Luo et al., 2017):
• along the surface of the front glass;
• through the bulk of the glass;
• along the interface between the glass and the encapsulation;
• through the bulk of the encapsulation;
• along the interface between the encapsulation and the backsheet;
• through the backsheet bulk; and
• along the backsheet surface.
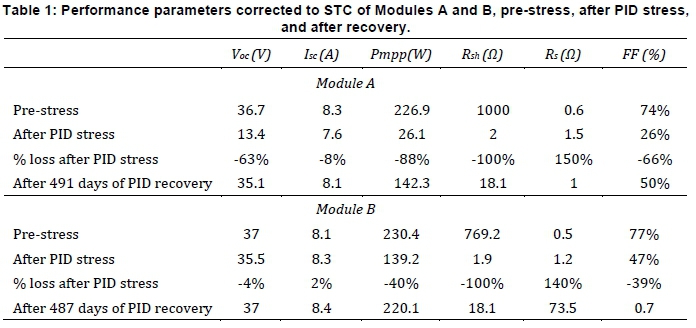
The magnitude of leakage currents through the seven possible paths varies depending on humidity, dew condensation, encapsulation materials and temperatures. The p-type modules used in this study are mostly susceptible to a form of PID known as PID shunting (PID-s) (Lausch, Naumann, Breitenstein, et al. 2014). PID-s is associated with decrease in shunt resistance (Rsh) and increase in series resistance (Rs) which results in increased electron-hole pair (e-h) recombination (Carolus et al., 2019). Sodium ions Na+ drifting from the glass surface through the encapsulation to the surface of the cells and eventually into the crystal structure cause increased shunting at the pn-junction, resulting in cell degradation and eventually a decrease in the module power output (Wilson et al. 2015). According to Naumann et al. (2014), the shunted cells observed in an EL image after PID stress coincide with sodium ions Na+ accumulation. Sodium ions Na+ originate from soda-lime glass and possibly the surface of the cell contamination during cell processing or module assembly (Naumann et al., 2014).
3. PID mitigation and recovery
PV manufacturers have introduced various mitigation measures in the module fabrication process in order to minimise PID occurrence. The deposition of anti-reflective coating (ARC) with high enough refractive index (<2.1) and better electrical conductivity in order to inhibit or eliminate chances of sodium ions Na+ drifting towards the pn-junction in the event that PID-favourable conditions occur (Oh et al., 2017). The other approach is to introduce a silicon dioxide layer between the cell and ARC; in some cases ion implantation in the cells emitter was implemented (Singh, 2015). This may increase the doping profiles of the cells. To prevent sodium ions Na+ diffusion, an encapsulation polymer with high electrical resistivity - such as polyolefin, ionomer or high quality ethylene-vinyl acetate (EVA) - has been used (Braisaz et al., 2016). EVA with a higher crosslinking, if used, may offer higher electrical resistance hence limiting sodium ions (Na+) migration (Jonai et al., 2015). Chemically strengthened glass with reduced sodium content may further decrease PID susceptibility of a module (Singh, 2015).
During PV plant planning, possible PID mitigation measures include ensuring proper grounding of modules in a string; using good quality inverters; using modules without frames; and choosing modules made from materials such as glass, encapsulations, backsheet and solar cells with desirable anti-PID properties (Berghold et al. 2013; Virtuani, Annigoni and Ballif 2019).
Several practical mitigation options are available to PV power plant owners when confronted with PID during PV plant operation. They include changing the electrical configuration of the PV plant; replacing the affected modules with new ones; and installing additional equipment like a PID offset box (Luo et al., 2017). The use of a commercially available PID offset box to manage PID on strings in a PV plant requires that it be connected either in series or in parallel to the string circuitry. During the night the PID offset box sends a small current to the string which takes several months or years with minimal or no guarantee of 100% PID recovery (Hinz et al. 2016). The disadvantage of a PID offset box is the possibility of PID re-occurrences and additional cost to the PV plant operations (Hinz et al., 2016).
PID-s is a reversible form of PID since it involves migration of sodium ions Na+ under high electric potential (Luo et al., 2017). Methods such as reverse polarity and exposing the affected module to high temperatures in environmental chambers have been used to reverse PID-s (Lausch, Naumann, Graff, et al., 2014). In the study described below, the modules are instead left in open circuit in the dark to recover naturally.
4. Experimental procedure
4.1 Module specification
Two identical 240 W poly-crystalline PV modules, from the same manufacturer and commercially available in the market, were used in this study. They were labelled as Module A and Module B. The modules are composed of 60 cells in three strings of 20 cells each connected in series and three bypass diodes. The modules had been deployed in the field in an embedded PV generation system for five years. The modules were cleaned and dried before initial power and EL measurements were recorded.
4.2 PID stress test
Figure 1 illustrates the high voltage stress process used to induce PID, and shows a cross-section of the experimental PID induction process. The set-up includes an aluminium sheet placed on the surface of the module's glass, with a high voltage power supply connected to the modules connectors and to the metal plate. The aluminium sheet produces an electric field as indicated in Figure 1. The module structure, seen in Figure 1, is the glass, encapsulant, anti-reflective coating (ARC), cells, encapsulant, backsheet surrounded by an aluminium frame.
An environmental chamber was custom-made to provide appropriate environmental conditions and a safe environment for high voltage experiments, as shown in Figure 1. The temperature of the experimental environment was set at 35 °C ± 1 °C and the humidity levels were kept at less than 40 RH % for the duration of the PID stress test. The test was done with a conductive aluminium sheet covering all 60 cells without touching the aluminium frame. This is an adaption of the method included in the IEC 62804 standard (IEC, 2015). The aluminium sheet was 1625 mm long, 955 mm wide and 3 mm thick. The aluminium plate was flexible enough to rest on the surface of the glass. Using an aluminium sheet covering the glass surface aimed to reproduce the high conductivity of a wet glass surface and the high humidity that a module may experience from rain or dew in the field. The module terminals were short-circuited and biased to the negative terminal of the high voltage power supply, while the aluminium sheet had a positive bias. Every module was first placed inside the chamber for at least 30 minutes to acclimatise before the high voltage power supply was switched on - for 48 hours and 20 hours for modules A and B respectively. The duration of the test was set to induce severe and moderate PID degradation. After 48 hours Module A had severely degraded so Module B was only subjected to half the time. The IEC test requires modules to have less than 5% degradation in performance parameters after 192 hours in order to be considered PID-resistant (Doyle, Desharnais, and Erion-Lorico, 2020). Modules A and B had power performance degradation of 88% and 40% respectively. This can be attributed to the modules being over five years old and thus not benefitting from the PID mitigation approaches that have been introduced in modules of more recent manufacture.
4.3 Module PID recovery
The modules were kept at room temperature in open-circuit after post-stress EL imaging and L-IV measurements. The modules were periodically tested and returned to storage until the next measurement. The degradation induced by the PID stress test is determined by the power loss relative to the pre-stress maximum power measurement (Pimpp), where (Pfmpp) is the maximum power measured at each interval, as expressed in Equation 1.
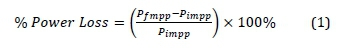
The first measurement taken after the PID stress test was at 0 hours and the module's recovery was monitored from that point until the end of the monitoring period.
4.4 L-IV measurements and EL imaging
L-IV measurements were obtained using a class AAA solar simulator, which is classified according to its spectral distribution match, irradiance uniformity in the test plane and temporal instability of irradiance (IEC, 2020). The measured results are corrected to standard test condition, which is a temperature of 25 °C, irradiance of 1000 W.m-2, and global reference spectral irradiance of AM 1.5 (IEC, 2020).
The EL images were taken before PID stress, after PID stress (0 hours recovery), and at subsequent time intervals to monitor recovery. The EL imaging setup comprised a power supply, computer controls, and a Silicon CCD camera. The measurements were made in a dark environment in order to eliminate natural light interference during the EL imaging process (Fuyuki and Kitiyanan, 2009). For Module A, EL images were taken at a current corresponding to Isc, while for Module B the EL image was taken at current corresponding to 10% of Isc. EL imaging at low currents is more sensitive to the effects of PID, as the presence of decreased shunt resistance is more visible.
5. Results and discussion
Modules A and B were subjected to PID stress using an aluminium plate method as described in section 4.2. Module A was subjected to the PID stress test for 48 hours, after which the performance parameters were measured, as listed in Table 1. Module A had PID induced resulting in a severe power loss of 88%. The shunt and series resistance were extracted from the IV curve using curve-fitting techniques.
Figure 2 shows the L-IV measurements taken pre-PID stress and used as a initial result against which recovery was compared. The L-IV measurements taken immediately after PID were used to calculate power drop and marked the start of power recovery from PID; this was recorded as 0 hours, representing the worst affected L-IV in Figure 2. The L-IV measurements taken subsequently - at indicated time intervals starting from three days and seven days up to 487 days and 491 days for modules A and B respectively - show PID recovery.
The I-V curve of Module A is shown in Figure 2a. Immediately after PID was induced the power dropped significantly, due to the decrease in open-circuit voltage (Voc) and shunt resistance. The drop in Voc is much higher because Na+ ions penetrate into the pn-junction, causing a sharp increase in photo-generated charge recombination resulting in decreased charge built up across the pn-junction (Naumann et al., 2014; Ziebarth et al., 2014).
The I-V curve of Module B is shown in Figure 2b. The drop in Voc was less than for Module A and with time it recovered to the pre-stress value because of low PID severity on it. The effects of PID shunting caused the fill factor to be decreased. The L-IV graphs of both modules show a shift toward the initial L-IV measurements with time, as the effects of PID shunting dissipate with back diffusion of the sodium ions Na+ (Masuda et al., 2016).
Figure 3 plots the recovery of the modules by plotting the measured power of the modules as a percentage of the original pre-stress power. For both modules, the rate of natural recovery was faster initially and then slowed with time. For adversely affected Module A, sodium ions (Na+) are forced into the pn-junction, resulting in sodium stacking faults to exist and thus an increased depletion at the pn-junction. Therefore, it takes longer to completely evacuate the ions from the pn-junction. For the less-affected Module B, recovery is faster, because the Na+ ions are still on the surface of the cell, so it is easy to evacuate them back to the glass (Wang et al., 2019). It is possible that the PID consists of reversible and irreversible processes related to the diffusion of sodium ions (Na+), and that these modules will never full recover naturally (Masunda, 2016).
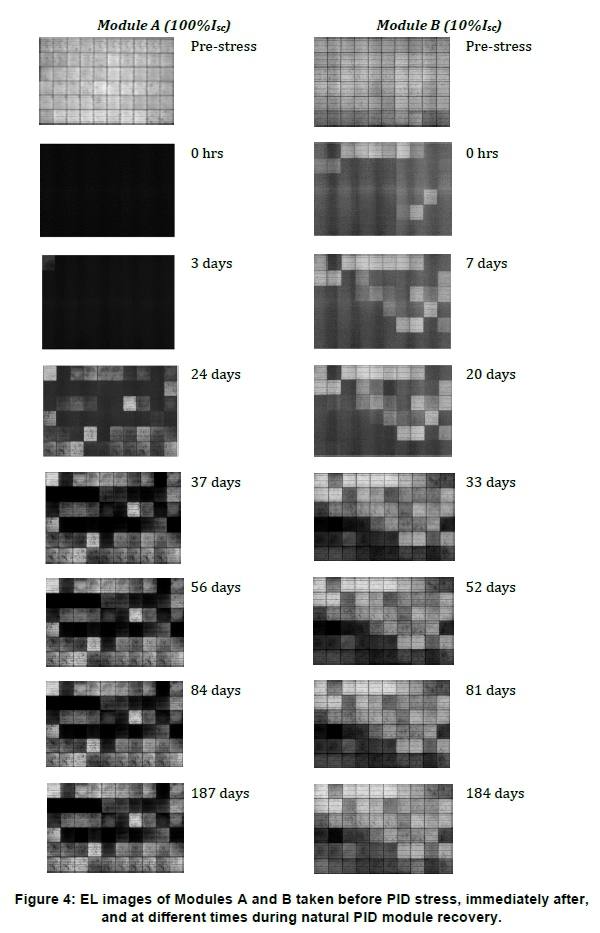
Figure 4 shows the EL measurements taken pre-PID stress, immediately after PID stress, and at subsequent indicated recovery time intervals. For Module A, the EL images are captured at an applied current equal to the short circuit current (Isc) of the modules. In the first EL image, taken before PID stress, the level of brightness of EL images is nearly uniform, except for busbars, fingers, inter-cell spaces and some notable dark spots. The initial EL images taken immediately after PID stress shows all cells in module A appearing completely dark, due to the severe PID shunting. PID-affected cells in a module appear darker in EL images than the remainder, indicating accumulation of Na+ ions between ARC and encapsulation and the pn-junction resulting in shunting as observed on the EL images. As a module undergoes natural PID recovery, the EL images show many cells becoming progressively brighter, as fewer modules are affected by PID shunting. By the final measurement, many cells have returned to their original intensity but several remain black and hence shunted.
The EL images for Module B were taken at applied current equal to 10% Isc, as the effects of the PID are more visible at a lower applied current. For Module B, the EL images taken immediately after PID stress show the majority of the cells appearing dark, with a few cells unaffected by PID appearing bright. In Module B, the EL intensity on all the cells became brighter and nearly uniform after 487 days, supporting the conclusion drawn from the power measurements that the module had almost completely recovered.
6. Conclusions
PID in the two poly-crystalline modules was successfully induced, which resulted in module power performance dropping by 88% and 40% of their initial power measurements. PID recovery in the modules was observed to occur naturally at room temperature of 20-25 °C, without any applied voltage or elevated temperatures. The PID severity was much higher in Module A than Module B, due to the longer stress period and it took longer for the severely affected modules to recover completely than those least affected. Some modules may never fully recover naturally due to the irreversible nature of induced PID shunting.
PID-affected cells in a module appear darker in EL images than the remainder, indicating accumulation of Na+ ions between ARC and encapsulation and the pn-junction, resulting in shunting as observed on the EL images. The shunting further caused a significant drop of Rsh, Voc and Pmpp as depicted in the L-IV measurements. After over a year, there was a considerable increase in the number of cells appearing with normal brightness, which indicates diffusion of Na+ ions back to the glass and the PID recovery of individual PV module cells. The recovery was further confirmed by an increase in Rsh, Pmpp, Vocand Isc. The susceptibility of a module to PID is dependent on the bill of materials of the module. Modules with the same module type can have different bills of materials, and even modules with the same one are known to behave differently under PID stress. For this reason, no specific conclusions can be drawn from the rate of recovery of the small sample presented in this paper. However, generally, the results show that natural recovery of power performance is possible in severely affected PID modules. The initial recovery is fast and then slows, and some modules may never fully recover due to irreversible effects of PID. To mitigate against catastrophic PID power loss, PV plant operators can adopt a rotational open circuit strings in strings of interest in a solar power plant in order to allow for PID recovery. This, in addition to applying reverse bias voltage using a PID offset box, could mitigate the effects of PID for moderately affected modules or those detected at early stages of PID.
References
Akcaoglu S.C., Martinopoulos, G., Koidis, C., Kiymaz, D. and Zafer, C. 2019. Investigation of cell-level potential-induced degradation mechanisms on perovskite, dye-sensitized and organic photovoltaics. Solar Energy, 190 (8): 301-318. [ Links ]
Berghold, J., Koch, S., Leers, M. and Grunow, P. 2013. Potential-induced degradation ( PID ) and its correlation with experience in the field. Photovoltaics International, 19 (7): 82-93. [ Links ]
Boulhidja, S., Mellit, A., Voswinckel, S., Lughi, V., Ciocia, A., Spertino, F. and Pavan, A.M. 2020. Experimental evidence of PID effect on CIGS photovoltaic modules. Energies, 13 (3): 1-16. [ Links ]
Braisaz, B., Commault, B., Quang, N. Le, Gerritsen, E., Joanny, M., Binesti, D., Goaer, G. and Radouane, K. 2016. Improved 1500V PID resistance: encapsulants, cover glass and ion implanted cells, 32nd European Photovoltaic Solar Energy Conference and Exhibition, Munich, Germany, 20-26 June, 2016: 1874-1878. [ Links ]
Carolus, J., Tsanakas, J.A., Heide, A. van der, Voroshazi, E., Ceuninck, W. De and Daenen, M. 2019. Physics of potential-induced degradation in bifacial p-PERC solar cells. Solar Energy Materials and Solar Cells, 200 (5): 1-6. [ Links ]
Doyle, T., Desharnais, R., and Erion-Lorico, T. 2020. 2020 PV Module Reliability Scorecard [Online]. Available: https://www.pvel.com/wp-content/uploads/2020-PVEL-PV-Module-Reliability-Scorecard.pdf [Accessed 21 June 2021] [ Links ]
Fuyuki, T. and Kitiyanan, A. 2009. Electroluminescence characterization of crystalline silicon solar cells. Applied Physics A: Materials Science and Processing, 96 (1): 189-196. [ Links ]
Hacke, P., Terwilliger, K., Koch, S., Weber, T., Berghold, J., Hoffmann, S., Koehl, M., Dietrich, S., Ebert, M. and Mathiak, G. 2013. Results of IEC 62804 draft round robin testing. NREL Presentation PR-5200-60493. Golden, Colorado, USA. September, 2013: 1-14. [ Links ]
Hinz, C., Koch, S., Weber, T. and Berghold, J. 2016. Regeneration of potential induced degradation affected modules, 32nd European Photovoltaic Solar Energy Conference and Exhibition, Munich, Germany, 20-26 June, 2016: 15521557 [ Links ]
International Electrotechnical Commission 2020. Photovoltaic devices - Part 1: Measurement of photovoltaic current-voltage characteristics, IEC 60904-1:2020, Geneva, IEC [ Links ]
International Electrotechnical Commission 2020. Photovoltaic devices -Part 9: Classification of solar simulator characteristics, standard, IEC 60904-9:2020, Geneva, IEC [ Links ]
International Electrotechnical Commission 2015. Photovoltaic (PV) modules - Test methods for the detection of potential-induced degradation - Part 1: Crystalline silicon, IEC TS 62804-1:2015, Geneva: IEC [ Links ]
Oh, J. 2016. Elimination of potential-induced degradation for crystalline silicon solar cells. PhD thesis, Arizona State University, USA . [ Links ]
Jäger-Waldau, A. 2019. PV Status Report 2019, EUR 29938 EN, Publications Office of the European Union, Luxembourg. doi:10.2760/326629, JRC118058. [ Links ]
Jonai, S., Hara, K., Tsutsui, Y., Nakahama, H. and Masuda, A. 2015. Relationship between cross-linking conditions of ethylene vinyl acetate and potential induced degradation for crystalline silicon photovoltaic modules. Japanese Journal of Applied Physics 54 (8S1): 08KG01-1- 08KG01-5. https://doi.org/10.7567/JJAP.54.08KG01. [ Links ]
Köntges, M., Kurtz, S., Packard, C., Jahn, U., Berger, K. A., Kato, K., Friesen, T., Liu, H., Van Iseghem, M., Wohlgemuth, J., Miller, D., Kempe, M., Hacke, P., Reil, F., Bogdanski, N., Herrmann, W., Buerhop-Lutz, C., Razongles, G. and Friesen, G. 2017. Review of failures of photovoltaic modules. [Online]. Available: https://iea-pvps.org/wp-content/uploads/2020/01/IEA-PVPS_T13-01_2014_Review_of_Failures_of_Photovoltaic_Modules_Final.pdf [Accessed 21 June 2021] [ Links ]
Kumar, L.A. and Kumar, S. 2014. Design and analysis of highly efficient and reliable single-phase transformerless inverter for PV systems. International Journal of Energy and Power Engineering, 8(9): 1405-1410. [ Links ]
Kwembur, I.M., Crozier McCleland, J.L., van Dyk, E.E. and Vorster, F.J. 2020. Detection of potential induced degradation in mono and multi-crystalline silicon photovoltaic modules. Physica B: Condensed Matter, 581: 1-6. [ Links ]
Lausch, D., Naumann, V., Breitenstein, O., Bauer, J., Graff, A., Bagdahn, J. and Hagendorf, C. 2014. Potential-induced degradation (PID): Introduction of a novel test approach and explanation of increased depletion region recombination. IEEE Journal of Photovoltaics, 4(3): 834-840. [ Links ]
Lausch, D., Naumann, V., Graff, A., Hähnel, A., Hagendorf, C. and Bagdahn, J. 2014. Sodium outdiffusion from stacking faults as root cause for the recovery process of potential-induced degradation ( PID ), Energy Procedia, 55: 486493. [ Links ]
Luo, W., Khoo, Y.S., Hacke, P., Naumann, V., Lausch, D., Harvey, S.P., Singh, J.P., Chai, J., Wang, Y, Aberle, A.G. and Ramakrishna, S. 2017. Potential-induced degradation in photovoltaic modules: a critical review, Energy & Environmental Science, 10 (1): 43-68. [ Links ]
Martinez-Moreno, F., Figueiredo, G., and Lorenzo, E. 2018. In-the-field PID related experiences. Solar Energy Materials and Solar Cells, 174: 485-493. [ Links ]
Masuda, A., Akitomi, M., Inoue, M., Okuwaki, K., Okugawa, A., Ueno, K. and Hara, K. 2016. Microscopic aspects of potential-induced degradation phenomena and their recovery processes for p-type crystalline Si photovoltaic modules. Current Applied Physics, 16 (12): 1659-1665. [ Links ]
Naumann, V., Lausch, D., Großer, S., Werner, M., Swatek, S., Hagendorf, C. and Bagdahn, J. 2013. Microstructural analysis of crystal defects leading to potential-induced degradation (PID) of Si solar cells, Energy Procedia, 33: 7683. [ Links ]
Naumann, V., Lausch, D., Hähnel, A., Bauer, J., Breitenstein, O., Graff, A., Werner, M., Swatek, S., Großer, S., Bagdahn, J. and Hagendorf, C. 2014. Explanation of potential-induced degradation of the shunting type by Na decoration of stacking faults in Si solar cells. Solar Energy Materials and Solar Cells, 120: 383-389. [ Links ]
Nelson, J., 2008, The Physics of Solar Cells, sixth edition, London, UK: Imperial College Press. [ Links ]
Oh, W., Bae, S., Chan, S.-I., Lee, H.-S., Kim, D. and Park, N. 2017. Field degradation prediction of potential induced degradation of the crystalline silicon photovoltaic modules based on accelerated test and climatic data, Microelectronics Reliability, 76 (77): 596-600. [ Links ]
Pingel, S., Frank, O., Winkler, M., Oaryan, S., Geipel, T., Hoehne, H., and Berghold, J. 2010. Potential induced degradation of solar cells and panels. 35thIEEE Photovoltic specalist conferncce, Honolulu, Hi, USA, 20-25 June, 2010: 28172822. https://doi.org/10.1109/PVSC.2010.5616823 [ Links ]
Singh, R. 2015. Maximising power production of large PV systems: PID detection and mitigation, [Online] Available https://www.pv-tech.org/maximising_power_production_of_large_pv_systems_pid_detection_and_mitigatio/ [Accessed 17 June 2020] [ Links ]
Virtuani, A., Annigoni, E. and Ballif, C. 2019. One-type-fits-all-systems: Strategies for preventing potential-induced degradation in crystalline silicon solar photovoltaic modules, Progress in Photovoltaics: Research and Applications 27 (6): 13-21. [ Links ]
Wang, H., Xiaoli, C., Hong, Y., Wenshuang, H., Zhilei, C., Lianghui, and X., Dengyuan, S. 2019. Potential-induced degradation: Recombination behaviour, temperature coefficients and mismatch losses in crystalline silicon photovoltaic power plant, Solar Energy 188 (8): 258-264. [ Links ]
West, R., 2012, PV string to 3-phase inverter with highest voltage capabilities, highest efficiency and 25 year lifetime final technical report. [Online] Available: https://www.nrel.gov/docs/fy13osti/57247.pdf [Accessed 21 June 2021] [ Links ]
Wilson, M., Savtchouk, A., Edelman, P., Marinskiy, D. and Lagowski, J. 2015. Drift characteristics of mobile ions in SiN x films and solar cells, Solar Energy Materials and Solar Cells, 142: 102-106. [ Links ]
* Corresponding author: Tel.: +21 (0)41 504 2579; email: s215379446@mandela.ac.za

