


Servicios Personalizados
Articulo
 Inglés (pdf)
 Articulo en XML
 Referencias del artículo
Indicadores

Links relacionados
-
 Citado por Google
 -
 Similares en Google
Compartir

 Permalink
Journal of Energy in Southern Africa
versión On-line ISSN 2413-3051
versión impresa ISSN 1021-447X
J. energy South. Afr. vol.32 no.4 Cape Town nov. 2021
http://dx.doi.org/10.17159/2413-3051/2021/v32i4a11207
ARTICLES
Improving reliability of the power distribution system in Goma (DRC) using solar distributed generation
G. SengiI, II,*; E. NtagwirumugaraI
IAfrican Center of Excellence in Energy for Sustainable Development, College of Science and Technology, University of Rwanda, Kigali, Rwanda
IIDepartment of Applied Sciences, Sapientia Catholic University, Goma, Democratic Republic of the Congo
ABSTRACT
The existing power distribution system of the city of Goma in the Democratic Republic of the Congo has many problems, including the scarcity of electric energy, power unreliability, the low access rate of electrification, poor flexibility in the network topology, and lack of demand response, which lead to shedding of load, unbalancing and overloading the system. The reliability of the Goma power distribution system is very poor by international standards. The major cause of this is the lack of adequate energy supply to meet demand. To mitigate the power reliability problem, a solar-based distributed generation (DG) is modelled and evaluated in this study. Each feeder has been considered separately with an appropriately designed DG. The work has evaluated initial investment cost and life cycle cost of the investment to assess the feasibility of the proposed solution. Based on the unserved energy and electricity tariff, an economic analysis was conducted. The reliability indices are computed and the modelled solution is designed for each feeder in PV syst software and simulated using ETAP, whose simulation results show that the reliability can be improved by up to 76%.
Highlights
• Reliability analysis and determination for Goma.
• Reliability indices are mathematically calculated using IEEE 1366 standard.
• The distribution system reliability will improve by up to 76%.
• Solar distributed generation can greatly improve the reliability of electricity supply in Goma.
Keywords: reliability indices; distributed generation; photovoltaic system; energy investment cost
1. Introduction
The economic growth of a country relies on a stable and reliable electric power supply. The power system has to feed its customers with adequate electrical supply as economically as possible, with a reasonable level of reliability, as nowadays utilities are working in a competitive market and their survival will depend on how they attract and retain their customers. Different ways to improve reliability are used by distribution companies, such as installing switching devices (Khounnouvong and Premrudeepreechacharn, 2015), protective devices, automation system implementation, network reconfiguration, and distributed generation (DG) installation (Garamaw, 2020).
1.1 The present study
The city of Goma is located in North Kivu province in the eastern part of the Democratic Republic of the Congo (latitude -1.67409 and longitude 29.2284). Currently, the city is supplied by three major power plants: Ruzizi in Bukavu, South Kivu province, with an average capacity of 6 MW transmitted; Matebe in Rutshuru with an average capacity of 5 MW transmitted to the city; and NURU solar power plant in Goma, with a total capacity of 1.3 MW. The three plants are not interconnected, which contributes to poor reliability, while currently around 55 MW of electrical power is needed in Goma but only around 12.3 MW energy is supplied. The poor reliability of this network leads to many blackouts, outages, interruptions and load shedding.
This paper evaluates the reliability of a distribution system in Goma. Based on the study and evaluation of the solution, a solar PV distributed generation is designed and modelled for its availability, feasibility and cost-effectiveness to improve the distribution network indices. A literature review follows. Section 2 describes the methodology and the study case. Results are discussed in section 3, considering system design of PV DG and analysis of the investment cost. Reliability indices are improved with PV DG in section 4. Conclusions are drawn in section 5.
The papers described in the literature review propose the performance of reliability, different improvement of reliability indices techniques used and calculated using IEEE 1366 standard and compared to international standard. However, none of them has evaluated the energy not supplied, the relevant cause of interruptions, and then chosen the improvement technique accordingly. Therefore, based on the formulated problem and causes of interruptions and outages, this paper aims to find the reliability indices of the existing network, to use solar distributed generation as a way to improve it, and establishes the cost of the investment. The cost analysis for the designed system is also included.
1.2 Literature review
Power distribution system reliability is a major consideration in system operation and planning and several studies have been conducted to improve the reliability indices of power distribution system networks. They suggest different techniques for improvements. Khounnouvong and Premrudeepree-chacharn (2015) proposed protective equipment, such as recloser and switching for reliability improvement in an electrical distribution system. Rah-mawati and Hariyanto (2015) studied the optimal placement of switches in a distribution system and conducted a cost/worth analysis of the reliability improvement method. Chandhra Sekharet al. (2017) presented the reliability parameters and reliability indices of the Indian electricity network and compared the indices to national standard. Gono et al. (2011) conducted an empirical reliability computation. Hossein and Arani (2015) considered a case study where reliability indices were computed, analysed and compared with the standard, while Xu (2019) used reliability tracking to identify the weak points at which DG could be incorporated to improve the system reliability. In Gara-maw (2020), the power reliability of a city in Ethiopia was evaluated, using the potential impacts of DG units on mitigating the power system reliability problem of the network. Two cases were considered: DG installed at 15 kV feeders, and DG connected at low-voltage sites (15/0.4 kV).
Reliability assessment of renewable energy interfaced electrical distribution system considering the electrical loss minimisation was developed by Kumar et al. (no date), using the optimal location(s) and sizing(s) of the renewable energy sources (RESs), and incorporating a battery storage system. Jose and Jorge (2020) reviewed and classified the state-of-the-art of reliability assessment in a mi-crogrid. It has been established that more research studies are needed to assess how new control strategies and information and communications technology impact DGs' reliability. Agrawal et al. (2020) suggested a suitable modification in existing reliability indices in order to make them more appropriate for underground distribution systems. They addressed a new methodology for the reliability evaluation of underground distribution systems by proposing dynamic failure rates of feeders and suggests network reconfiguration to enhance the reliability and performance of distribution systems. Ghulomzoda et al. (2020) studied the method of control using reclosers in Tajikistan with distributed small generation. Based on modified reclosers, a method of decentralised synchronisation and restoration of the grid normal operation after the loss of the main power source was proposed.
A combined power generation system constituted with DG, battery storage and electric vehicles in a microglia was applied by Bai et al. (2015) to achieve a reliable evaluation of a distribution network with microgrids. A methodology to model charging load and discharging capacity of multiple electric vehicle batteries was developed. The reliability of the distribution system was improved, based on determining the optimal capacity according to an economic and reliability evaluation. A predictive based reliability analysis of an electrical hybrid distributed generation was presented by Fu et al. (2018). The effect of a battery bank, as an electrical storage system, was investigated on the reliability of a DG system that forms an EHDG with a photovoltaic (PV) system as the main source.
Many papers have discussed the design and integration of PV systems in a grid. Garamaw (2020) focused on the key technical issues and design optimisation of large solar power plants. Gonen (2007) designed and built a PV power system installed on a rooftop over an area of 50 m2 with a power output of 6 kWp. The installation of PV was done with a slope of 6o and produced around 10 006.7 kWh of electrical energy per year. It was connected to the grid without a battery and the investment included the cost of maintenance and life cycle costs over 25 years. Gono et al. (2011) performed a techno-eco-nomic analysis of a solar PV power plant installed to meet the energy demand of a building in Delhi. Hossein and Arani (2015) showed that energy savings on net consumption and maximum demand can be maximised via optimal sizing of the solar PV-battery system, using the MATLAB genetic algorithm tool. The study revealed that optimal sizing of the solar PV-battery system contributed to energy bill savings up to 20% of net consumption via solar PV self-consumption, 3% of maximum demand (MD) via MD shaving and 2% of surplus power supplied to grid via net energy metering in regard to the Malaysian electricity tariff scheme and cost of the overall system.
2. Methodology
2.1. Reliability indices
Reliability can be taken as the ability of a system to perform its required function with specified conditions in a time interval. It is also the percentage of time a voltage source is uninterrupted (Williset al., 2009). Reliability indices are found to consider the downtime and uptime of a component or element. Most reliability indices are average values of a particular reliability characteristic for a given system. The indices for distribution analysis include customer-oriented indices and load- or energy-oriented indices.
2.1.1. Customer-oriented indices
System average interruption frequency index (SAIFI):
This index, in units of 1/C/a, shows the number of sustained interruptions that a given or average number of customers are facing during a specified period (Power and Energy Society, 2012). It is calculated as in Equation 1.
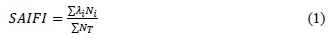
where λi is the failure rate at load point i, Ni is the total number of customers interrupted at load point i, and NT is the total number of customers at load point i.
System average interruption duration index (SAIDI): This index, in units of h/C/a, represents the total duration of interruption that a certain number of customers are facing during the period (Power and Energy Society, 2012) and calculated as in Equation 2.
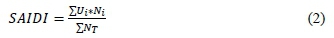
where Ui is the restoration time in minutes, Ni is the total numbers of customers interrupted, and NT is the total numbers of customers.
Customer average interruption duration index (CAIDI): This index, in units of h, is the sum of customer interruption durations divided by the total number of customer interruptions (Power and Energy Society, 2012), and calculated as in Equation 3.
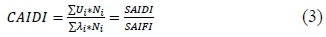
where Ui is the restoration time in minutes, Ni is the total number of customers interrupted, and λi is the failure rate at load point i.
Customer average interruption frequency index (CAIFI): This index gives the average frequency of sustained interruptions for those customers experiencing sustained interruptions. The customer is counted once regardless of the number of times interrupted for this calculation (Power and Energy Society, 2012), and calculated as in Equation 4.
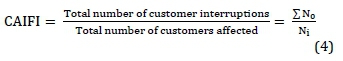
where N0 is the number of interruptions, and Ni is the total number of customers interrupted.
Average service availability index (ASAI): This index indicates a period of time (often in percentage) that a customer has power provided during one year (or other defined reporting period). It is the ratio of the total number of customer hours that service was available during a given period to the total customer hours demanded (Power and Energy Society, 2012), and calculated as in Equation 5.
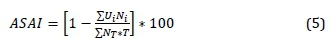
where T is the time period understudy in an hour, Uiis the restoration time, in an hour, Ni is the total number of customers interrupted at load point I, and Nr is the total number of customers served.
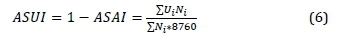
Average service unavailability index (ASUI): This index is the probability of having loads unsupplied and it is the complementary value to the ASAI (Power and Energy Society, 2012), and is calculated as in Equation 6.
2.1.2. Load and energy-oriented indices
Energy not supplied index (ENS): This index, in units of MWh/a, is the amount of unserved energy or the energy not delivered to the customers in a given period (Power and Energy Society, 2012) and expressed as in Equation 7.
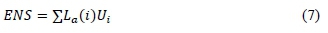
where La(i) is the average load.
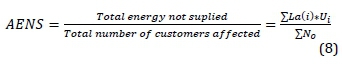
Average energy not supplied index (AENS): This index, in units of MWh/Ca, shows the average amount of energy not supplied or served, for all users known as customers (Power and Energy Society, 2012), and mathematically represented by Equation 8.
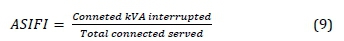
Average system interruption frequency index (ASIFI): The calculation of this index is based on load rather than customers affected. ASIFI is sometimes used to measure distribution performance in areas that serve relatively few customers that have relatively large concentrations of load, predominantly industrial/commercial customers (Power and Energy Society, 2012), as expressed in Equation 9.
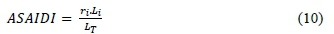
Average system interruption duration index (ASIDI): The calculation of the ASIDI is based on load rather than customers affected (Power and Energy Society, 2012), as expressed in Equation 10.
2.2 Description of the case study
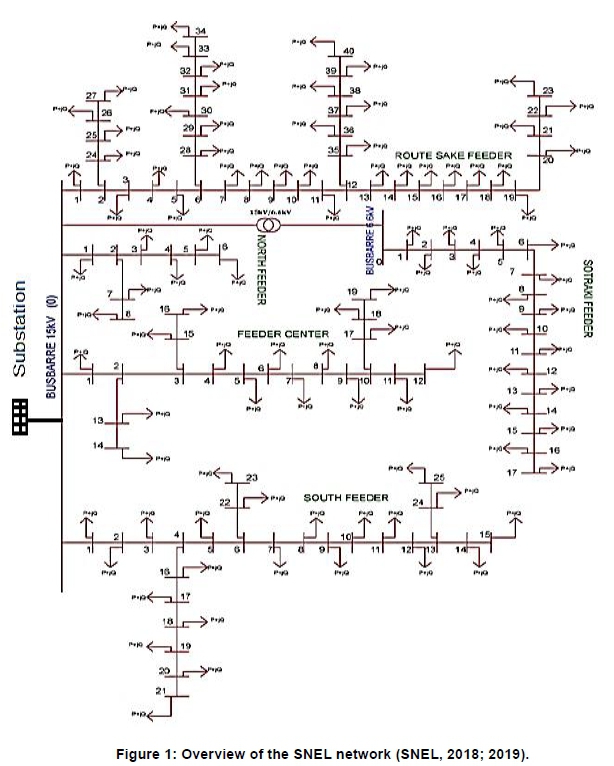
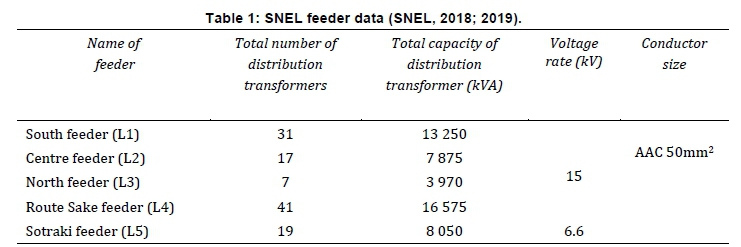
The Société Nationale d'Electricité (SNEL) network is the main supplier in Goma and covers 18% electrification access rate of the city. A 70kV transmission line is extended from Ruzizi to Goma substation. The distribution system in the city has primary voltages of 15 kV and 6.6 kV and it is stepped down to 380 and 220 V for the customer level. It has one substation, with an installed power of two transformers working alternately as 2 x 10 MVA / 110-70 kV/15kV ratings and one thermal power plant with 1.1 MVA rating but not used due to its high fuel cost. Its topology is radial, as shown in Figure 1, and contains five feeders. Table 1 describes several power transformers, the total installed capacity for each feeder, as well as conductor size.
Table 2 gives the frequency and duration of interruptions due to non-momentary and planned interruptions in the existing grid of SNEL in Goma, while Figures 2 and 3 show the planned and momentary interruptions of each feeder of each year in the distribution system from the recorded data of the SNEL substation from June 2018 to May 2020.
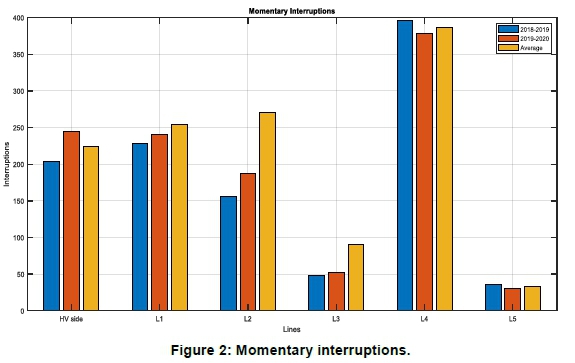
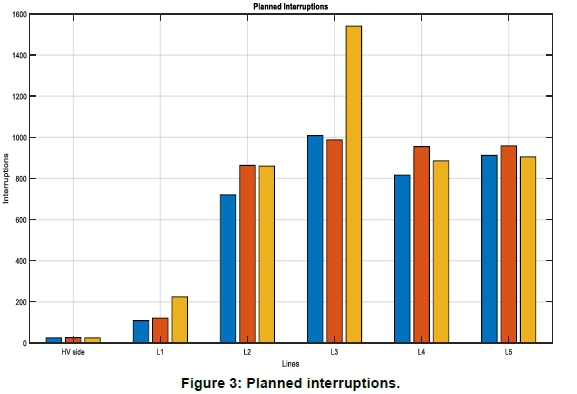
Figure 4 shows the frequency of interruptions for each cause as well as its duration classified for each feeder and it gives also the percentage of each cause of interruption in the system.
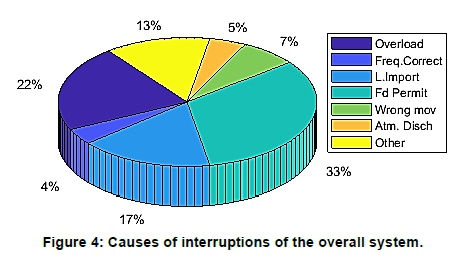
Based on Figure 4, the percentage contributions of each cause of interruptions of the total frequency and duration of interruptions of each feeder and the overall system are analysed. Thus, load shedding (permutation of feeders) is the greatest cause of interruptions (33% of them) and its long duration is due to the scarcity of electric energy produced. Overload is the second-largest cause of interruption (22%) in the system - often due to the high customer demand and the inability of the system to meet it.
As the demand for energy is much greater than the supply and cannot be easily controlled, a power limiter has been installed at the beginning of the high voltage transmission line to ensure that Goma's network does not exceed its predefined portion. Interruptions caused by the power limiter in the network account for 17% of all interruptions, 7% represents some human error occurring in the exploitation of the network, atmospheric discharges account for 5%, and frequency corrections account for 4%. Other causes represent 13% of all interruptions, including birds, component failure, insulator perforation, poles damaged by cars, and burned wires.
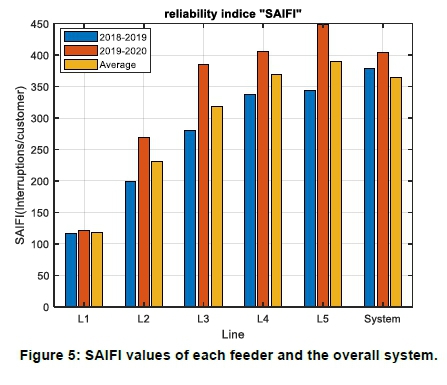
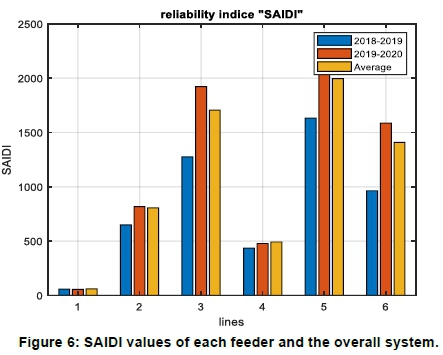
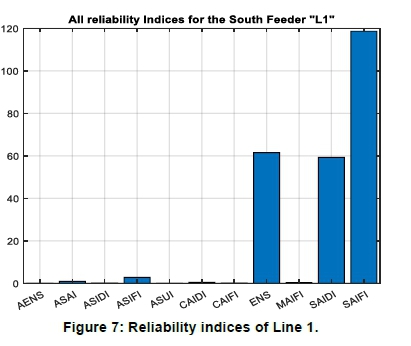
Based on the recorded data for interruption between 2018 and 2020, the reliability indices for each feeder are calculated as shown in Table 3. Figures 5 and 6 illustrate the comparison of the commonly used reliability indices SAIFI and SAIDI, which are the major indicators of the level of reliability. Figure 7 shows all calculated reliability indices of Line 1, from which it can be seen that some indices are not visible, due to the higher value of certain indices.
The economic impact of poor reliability of SNEL's distribution system, based on the highlighted descriptions and analysis, is shown in Table 4. The economic evaluation of the reliability shows the cost of an outage at the utility side illustrated in Equation 12. Utility outage costs include the loss of revenue for energy not supplied, and the increased maintenance and repair costs to restore power to the customers affected. The maintenance and repair costs can be quantified by Equation 11 (Gonen, 2007).
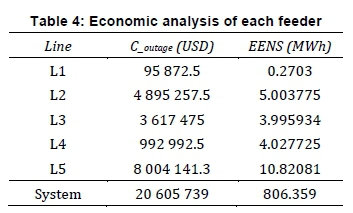

where Ci is the labour cost for each repair and maintenance action, and Ccompis the replacement or repair cost. Therefore, the total utility cost for an outage is expressed in Equation 12.

where ENS is the energy not supplied.
In the expected energy not supplied (EENS) index, energy per customer unit time is defined by Equation 13.
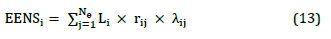
where Neis the total number of elements in the distribution system, L¡ is the average load at load point i, rijis the failure duration at point i due to component j, and λijis the failure rate at load point i due to component j.
3. Results
3.1. Design of solar distributed generation
Around 76% of interruptions are caused by lack of energy produced, as demonstrated by the difference between the installed capacity and average power transmitted through transmission lines of each feeder, as shown in Table 5.
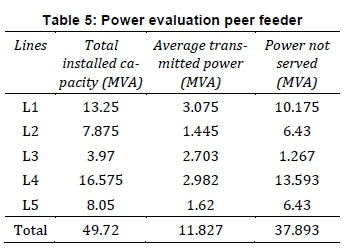
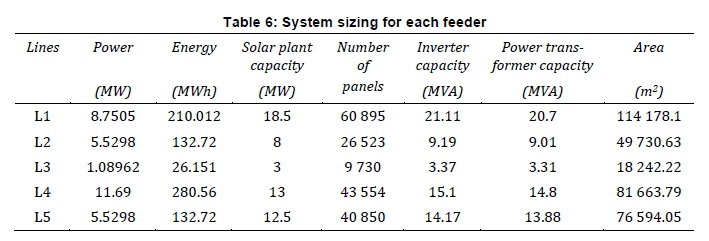
Based on the power not served (Table 5), the capacity of the powerplant, the area, number of PV module needed, inverter capacity and converter size of each feeder were sized, as shown in Table 6. These steps have been considered when sizing the system (Nwaigwe et al., 2019; Diantari, 2016).
i) Calculate total Watt-hours per day needed from the PV modules.
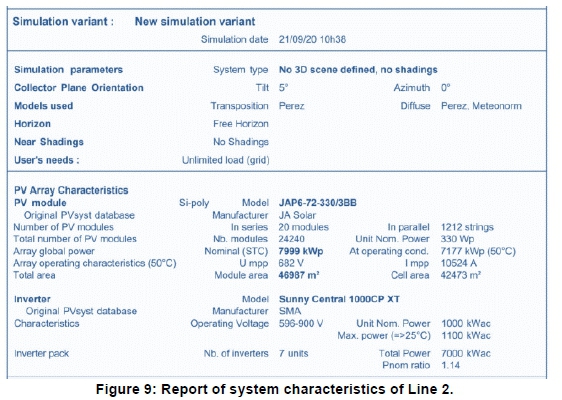
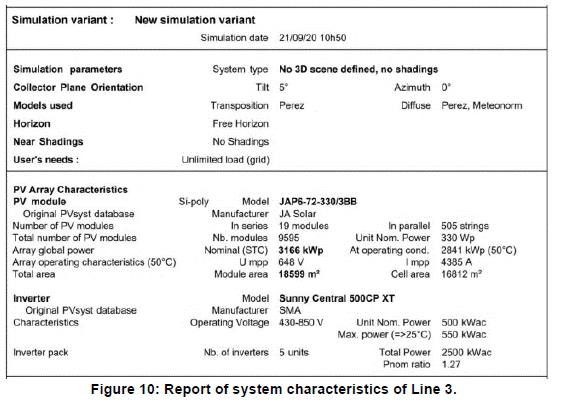
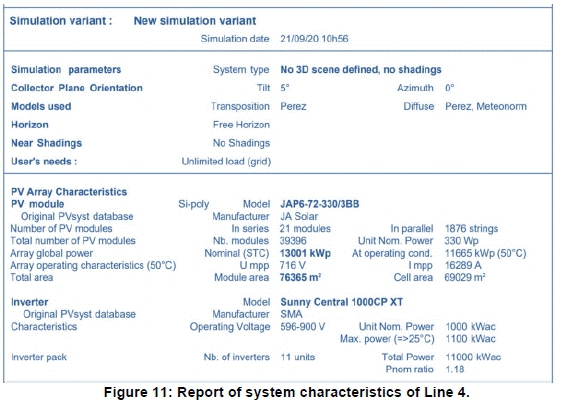
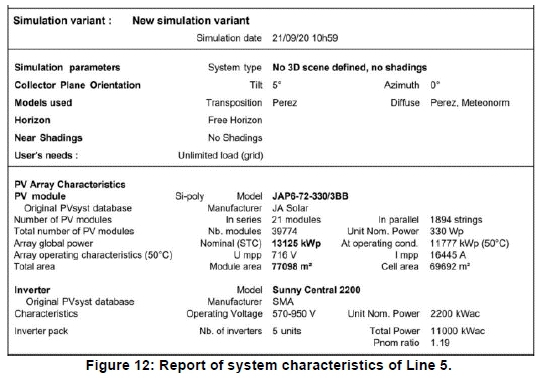
PV syst software has been used to verify and ensure that the results given in Table 6 were calculated properly. Figure 8 shows the way the system has been configured in the software. In Figures 9-12, different reports of system design of each feeder have been given and described.
3.2 Cost of investment
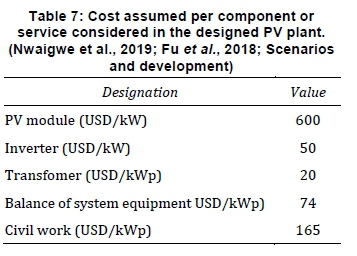
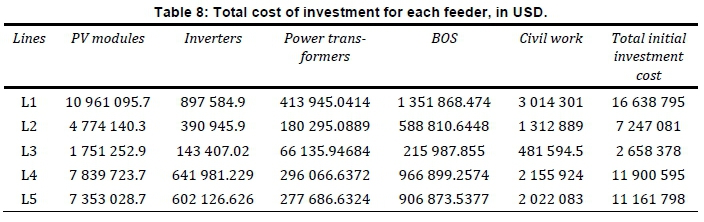
The total capital cost includes the cost of the PV array, cost of the inverters, cost of the step-up transformers, and the balance of system equipment -which includes the cost of electrical wiring, meter, protections, junction boxes, cabinets, switchgear, combiners, fuses, breaker and other non-electrical components, and the cost of civil work and structure. The assumed cost of each component is shown in Table 7. Table 8 describes the investment cost. The study does not consider storage, as it has been conducted for grid connected system; therefore cost related to storage will not be given.
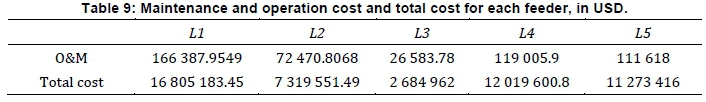
According to Stapleton and Neill (2012) and Renewable Energy Agency, 2019, the maintenance and operational costs per year generally account for 1-2% of the total cost of investment, which includes the cost of purchased components. Therefore, in the present study, 1% as maintenance and operation has been considered. Table 9 shows the cost of maintenance and operation for each feeder, and the total capital cost.
Life cycle cost (Lcc) will be calculated considering the initial investment costs (C) and the maintenance and operational (M&.0) long-term costs (Stapleton and Neill, 2012; Diantari, 2016), as shown in Equation 14.

It is assumed that the solar PV power plant has 25 years of life, based on expected PV lifespan. The discount rate (i) that is used to calculate the present value in this study is 8% (Villafuerte and al. (2019). This value is chosen based on the actual interest rate bank loans in DRC. Actual value of the maintenance and operational costs during the project life of 25 years is calculated, based on Stapleton and Neill (2012) and Diantari (2016), as shown in Equation 15.

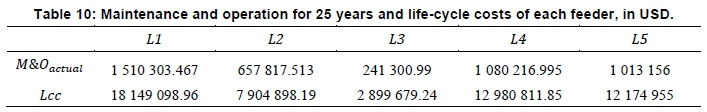
With the initial investment cost (C) and the calculation of the actual maintenance and operational (M&O), life cycle costs for solar to be built during the project life of 25 years is shown in Table 10 for each feeder.
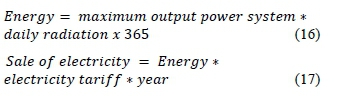
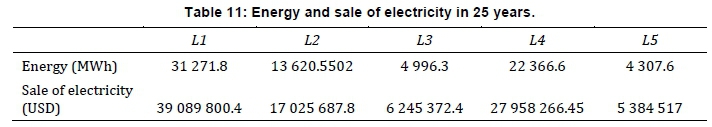
Based on the local radiation and output power found in Table 6 at the power transformer side, the annual energy that can be produced by solar PV power plant is calculated using Equation 16, and sale of electricity after 25 years is given by Equation 17. Both are represented in Table 11.
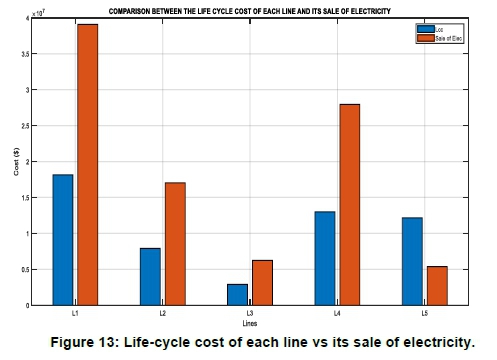
Based on the life cycle cost of the investment shown in Table 10 and the sale of electricity described in Table 11, it is seen that the project leads to profit.
The life cycle cost of Line 1 is USD 18 149 098.96 and the sale of electricity for Line 1 gives USD 39 089 800.4, while the lifecycle cost of Line 5 is USD 12 174 955 and its sale of electricity gives USD 5 384 517. It could be argued that the sale of electricity of Line 5 leads to a loss, but this is compensated for by the sale of electricity of other lines. Figure 13 shows the comparison between the life cycle cost of each line and its sale of electricity.
4. Discussion
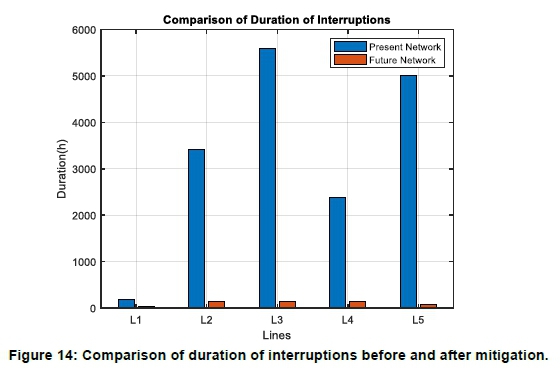
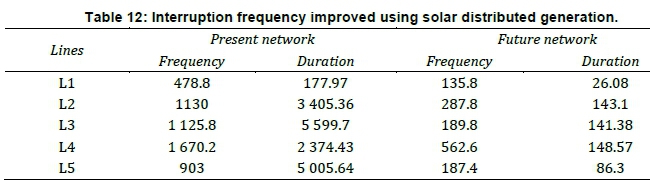
When applying solar DG to a power plant, the interruption frequency as well as duration will be reduced, as shown in Table 12 and Figures 13 and 14, considering the same load and same number and category of customer. The frequencies of interruptions and durations of interruptions of Line 1 are reduced by 72% and 86% respectively. The frequency and duration of interruptions of Line1 are 478.8 interruptions per year and 177.932 hour per year respectively. When the line is fed using solar DG, the frequency of interruptions is reduced to 135.8 per year. The duration of interruptions of Line 1 is 177.97 hours per year, but when the line is fed using solar DG, this is reduced to 26.08 hours per year.
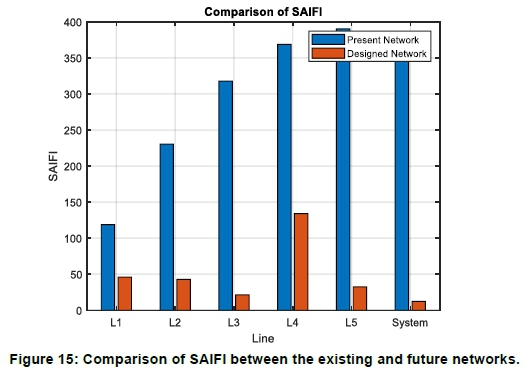
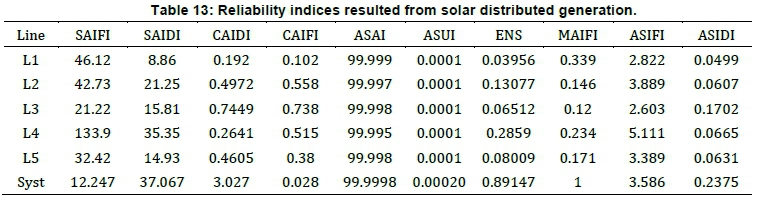
The reliability indices of the designed distributed generation system are calculated, with results given in Table 13, which shows reliability indices calculated using the predicted frequency and duration of interruptions of the designed grid system using solar photovoltaic DG. The SAIFI value of the overall system is reduced by using it.
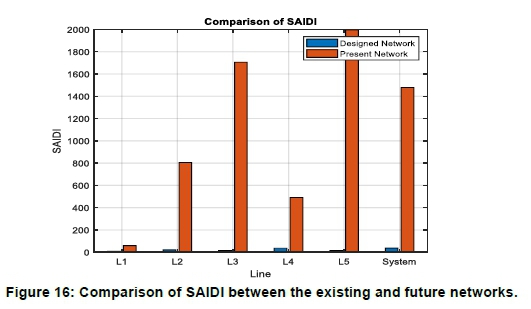
The SAIDI value of the overall system is reduced as shown in Figure 15 and, therefore, the reliability of the existing network is improved. SAIDI improvement is higher than SAIFI because the causes leading to more hours of the outages were solved using DG.
4.1 Simulation of reliability analysis
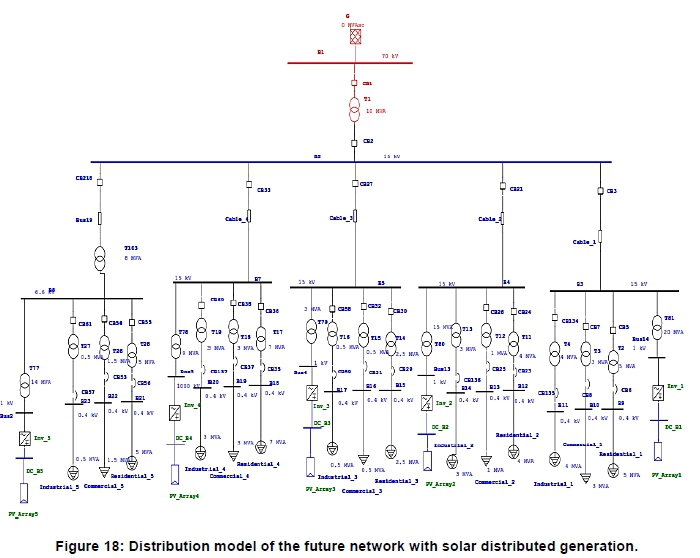
The distribution model of the existing grid shown in Figure 17 is done to verify the calculated reliability indices values. Figure 18 shows the simulation model of the designed system. The system model is an overhead line, using step-down power transformers, with loads categorised considering residential load, commercial load, and industrial load. The summary report provides a listing of reliability indices for the overall system of distribution model of the existing network.
The report presented in Table 14 describes the values of the reliability indices of the overall system such as SAIFI, SAIDI, CAIDI, ASAI, ALIFI, and ALIDI of the existing network. This simulation result verifies that the prediction of the values of each reliability index shown in Table 3 is done properly. It proves that the reliability of the existing network is very poor and has to be improved. For instance, from the simulation report shown, it can be seen that the SAIFI is 326.6100 interruptions per customer per year and SAIDI is 1319.8180 hours per customer per year, which verifies that the prediction of SAIFI and SAIDI in Table 13 is done properly.
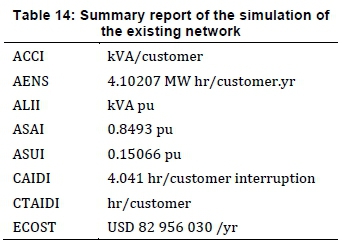
Similarly, CAIDI, ASAI, ALIFI, and ALIDI values in Figure 17 verify the mathematically calculated values given in Table 3. Additional to this, the summary report gives the values of expected customer outage cost (ECOST), expected energy not supplied (EENS), and interrupted energy assessment rate (IEAR).
The summary report shown in Table 15 confirms that the reliability indices found using mathematical methods are correct. The result proves that the reliability of the system has been improved as it was calculated mathematically, as shown in Table 13. From the simulation summary report, we can see that SAIFI is 11.2 while is 12.2 in Table 13; SAIDI is 38.49 while it is 37.06 as calculated value. As SAIFI and SAIDI are based on how frequency interruptions and duration of the interruptions have been improved, it proves that the reliability the power distribution system has been improved.
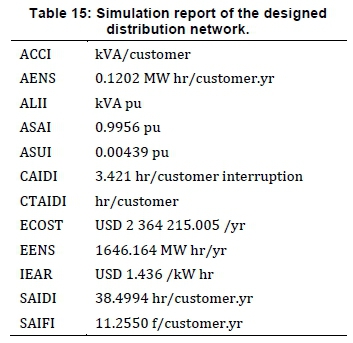
The result found in ETAP software 16.0 for the overall system certifies that the predictive values were properly calculated. However, some values found by calculation are slightly different from the one obtained by simulation, such as AENS and EENS.
5. Conclusion
This research has shown that the reliability of Goma power distribution system is very poor, due to the lack of energy produced leading to scarcity of the energy in the city. The reliability has been improved using solar distributed generation, as the main cause of interruption was the lack of energy produced which resulted in demand exceeding supply. The average frequency of interruptions of Goma network is 364.87 interruptions per customer per year and the average duration of interruptions is 1478.7 hours per customer per year for the overall system, which have been improved to 12.247 for the system average interruption frequency index (SAIFI) and 37.067 for the system average interruption duration index (SAIDI). Investment cost was calculated based on the standard cost of each equipment, and the life cycle cost was calculated considering the discount rate in the cost of operational and maintenance for the designed system. Applying photovoltaic distributed generation has improved the reliability of the system by up to 76%.
Author contributions
G. Sengi was responsible for data curation, writing original draft preparation, writing the review and editing visualisation, methodology, investigation and resource organisation.
E. Ntagwirumugara was responsible for visualisation, supervision of formal analysis, funding acquisition, writing the review and editing visualisation, project administration and resources.
Acknowledgments
The authors would like to express their sincere thanks to Dr-Ing. Getachew Biru for his contribution and advice in this paper and to Mr Jean Louis Nshuti, Chief Operating Officer at SNEL's substation for the data provided. We wish to acknowledge the World Bank's sponsorship of the research through the positions of the authors at the African Center of Excellence in Energy for Sustainable Development at the University of Rwanda College of Science and Technology.
References
Agrawal, P., Kanwar, N., Gupta, N., Niazi, N. K., Swarnkar, A., Meena, K. N., Yang, J., 2020. Reliability and network performance enhancement by reconfiguring underground distribution systems, Energies, 13(18): 4719. https://doi.org/10.3390/en13184719. [ Links ]
Bahrami, M., Eslami, Sh., Zandi, M., Gavagsaz-ghoachani, R., Payman, A., Phattanasak, M., Nahid-Mobarakeh, B. and Pierfederici, S.. 2015. Predictive based reliability analysis of electrical hybrid distributed generation, 15687250, IEEE: 515-518. doi: 10.1109/TICST.2015.7369408. [ Links ]
Bai, H., Miao, S., Zhang, P. and Bai, Z., 2015, reliability evaluation of a distribution network with microgrid based on a combined power generation system, Energies, 8(2): 1216-1241. doi: 10.3390/en8021216. [ Links ]
Camm, E. H. and Williams, S. E., 2011. Solar power plant design and interconnection, IEEE, 12303808. [ Links ]
Chandhra Sekhar, P., Deshpande, R. A. and Sankar, V. 2017.Evaluation and improvement of reliability indices of electrical power distribution system, IEEE: 16720178, Bhubaneswar, India. doi: 10.1109/NPSC.2016.7858838. [ Links ]
Diantari, R. A., 2016. Calculation of electrical energy with solar power plant design, IEEE: 16618947, 443-446. doi: 10.1109/ISITIA.2016.7828701. [ Links ]
Energiewende, A., 2015. Current and future cost of photovoltaics, Long-term Scenarios for Market Development, System Prices and LCOE of Utility-Scale PV Systems, Mara Marthe Kleiner, www.agora-energiewende.de [ Links ]
Fu, R., Feldman, D., Margolis, R., 2018. U.S Solar photovoltaic system cost benchmark: Q1 2018, National Renewable Energy Laboratory. [ Links ]
Garamaw, L. Y., Worku, B. G., 2020. Study of power system reliability and improvement potential by using distributed generation. International Journal of Engineering & Scientific Research, 08(01). [ Links ]
Ghulomzoda, A., Gulakhmadov, A., Fishov, M. S., 2020. Recloser-based decentralized control of the grid with distributed generation in the Lahsh District of the Rasht Grid in Tajikistan, Central Asia, Energies, 13(14): 3673. https://doi.org/10.3390/en13143673 [ Links ]
Gonen, T. 2007. Electric power distribution system engineering. Second Ed. C. Press. California. [ Links ]
Gono, R., Rusek, S. and Kratky, M., 2011. Reliability analysis of electric distribution system, IEEE: 12061649, Rome, Italy. doi: 10.1109/EEEIC.2011.5874842 [ Links ]
Hossein, A. and Arani, B., 2015. Reliability analysis : A case study in designing power distribution system of Tehran oil refinery, 15324672, IEEE, Rome, Italy. doi: 10.1109/EEEIC.2015.7165312 [ Links ]
IRENA. 2019. Renewable power generation costs in 2019. Abu Dhabi,www.irena.org/publications. [ Links ]
Jose, L. L. and Jorge, I. V., 2020. Reliability evaluation in distribution networks with microgrids : review and classification of the literature, Energies, 13(23): 6189. https://doi.org/10.3390/en13236189. [ Links ]
Khounnouvong, S. and Premrudeepreechacharn, S. and Ngamsanroaj, K., 2015. Reliability improvement of the electrical distribution system of the thanaleng substation in Vientiane capital, Laos, 15617579, IEEE, Charlotte, NC, USA. doi:10.1109/NAPS.2015.7335177. [ Links ]
Kumar, S. et Sarita, K., Singh S. and Vardhan, A., 2020. Reliability assessment of wind-solar pv integrated distribution system using electrical loss minimization technique, Energies, 13(21): 5631. doi: 10.3390/en13215631. [ Links ]
Nwaigwe, K. N., Mutabilwa, P. and Dintwa, E., 2019. An overview of solar power (PV systems ) integration into electricity grids materials science for energy technologies an overview of solar power ( pv systems ) integration into electricity grids. doi: 10.1016/j.mset.2019.07.002. [ Links ]
Pan, J., Hou, X., Xu, B., Kou, L., 2019. Weaknesses identification using reliability tracking in distribution system with distribution generation. 2019 IEEE Innovative Smart Grid Technologies - Asia (ISGT Asia). IEEE: 3407-3412. doi: 10.1109/ISGT-Asia.2019.8881645 [ Links ]
Powerand Energy Society, I., 2012. IEEE guide for electric power distribution reliability indices. IEEE, https://ieeex-plore.ieee.org/servlet/opac?punumber=6329908 [ Links ]
Rahmawati, F. and Hariyanto, N., 2015. Optimal switch placement in radial distribution system based on reliability worth analysis, 15663980, IEEE: 568-572. doi: 10.1109/ICEEI.2015.7352564 [ Links ]
Sharma, A., Mahajan, P., Garg, M., 2016. Techno-economic analysis of solar photovoltaic power plant for Delhi secretariat building, IEEE: 16689574, Delhi, India. doi:10.1109/ICPEICES.2016.7853620. [ Links ]
SNEL. 2018. SNEL Goma annual report, Goma, DRC. [ Links ]
SNEL. 2019. SNEL Goma annual report. Goma, DRC. [ Links ]
Stapleton, G. and Neill, S., 2012. Grid-connected solar electric systems: the Earthscan expert handbook for planning, design and installation. Routledge. [ Links ]
Subramani, G., Ramachandaramurthy, V. K., Sanjeevikumar, P. and Jens Bo, H.-N., 2019. Techno-economic optimization of grid-connected photovoltaic (PV) and battery systems based on maximum demand reduction (MDRED) modelling in Malaysia. Energies, 12(18): 3531. doi.org/10.3390/en12183531 [ Links ]
Villafuerte, M., Gicquel, M. Perez-Saiz, Moreau, M. Egoumé, M. G. et F., 2019. Programme de reference et de demande de décaissement au titre de la facilité de crédit rapide - Un communiqué de presse; le rapport des services du FMI; et une declaration de l'administrateur du FMI pour la République Démocratique du Congo, Kinshasa, DRC. [ Links ]
Willis, H. L., Carolina, N. and Rashid, M. H., 2009. Electric power distribution reliability. Second edition. Richard E. Brown. [ Links ]
* Corresponding author: Email: gislsengi@gmail.com

