


Servicios Personalizados
Articulo
 Inglés (pdf)
 Articulo en XML
 Referencias del artículo
Indicadores

Links relacionados
-
 Citado por Google
 -
 Similares en Google
Compartir

 Permalink
Journal of Energy in Southern Africa
versión On-line ISSN 2413-3051
versión impresa ISSN 1021-447X
J. energy South. Afr. vol.32 no.4 Cape Town nov. 2021
http://dx.doi.org/10.17159/2413-3051/2021/v32i4a9430
ARTICLES
Electric energy planning in Namibe, Angola: Inserting renewable energies in search of a sustainable energy mix
Lemba I.I; Ferreira Dias M.II,*; Robaina M.II
IDepartment of Electrical Engineering, Faculty of Engineering and Technology, University of Namibe, Namibe, Angola
IIResearch Unit on Governance, Competitiveness and Public Policies and Department of Economics, Management, Industrial Engineering and Tourism, University of Aveiro, Aveiro, Portugal
ABSTRACT
The socioeconomic development of any region requires electricity for operating the various sectors of the economy. Sometimes energy is scarce, not only because of the lack of energy resources, but also because energy policy is inadequate or non-existent. This paper examines the situation in the province of Namibe, Angola, characterising the energy sector, and proposing an energy mix for the security of electricity supply, environmental protection and sustainable economic development. Using the Long -range Energy Alternative and Planning System, energy scenarios were simulated and the greenhouse gas emissions (GHGs) for the period 2014-2040 calculated and analysed. The most sustainable scenario, in terms of energy mix diversification and GHG reduction, as well as the least costly (considering electricity production and carbon costs), has an increase of hydro capacity and the insertion of wind, solar photovoltaic, thermoelectric sources and natural gas. Given the intermittency of photovoltaic and wind systems, natural gas appears in this scenario as a way to avoid interruptions in the electricity supply. This scenario is the one with the largest production reserve margin of 24.47 %, and emissions are avoided at 386 550 tCO2eq compared to the base scenario in 2040. Energy policymakers can take this scenario as a model to assist in making decisions on how power capacities can be installed over the planned time for the desired energy output.
Keywords: renewable energy sources, electricity, energy policy, LEAP
1. Introduction
Electricity is essential for the economic development of any country or region. In the case of Angola, and Namibe province in particular, the rate of electricity access is very low. Only about 30% of the Angolan population had access to electricity in 2017, and for Namibe the rate was 32% (ENDE EP, 2018), depriving the majority of the population of the goods and services provided by electricity. One of the biggest challenges for this province is the way its energy needs will be met for the coming decades. The provincial government of Namibe, in its Master Plan for Socioeconomic Development for 2013 -2017 (GPN, 2013), aimed to develop fundamental infrastructures, highlighting the increase of energy capacity with the construction of more thermoelectric power plants and the rehabilitation of another. This increase intended to include energy from the Tômbwa wind farm, from the Baynes dam on the Cunene River, and from the Tômbwa diesel-solar photovoltaic hybrid plant. However, only the last of these is in an advanced stage of implementation, and all the projects are nationwide (DNERL, 2018; GPIESTN, 2018; MINEA, 2015; Rede Angola, 2016).
Angola's primary sources of electricity are hydro, diesel and natural gas. Projects concerning the use of solar resources are underway, in an experimental phase, and they will operate in a hybrid regime alongside diesel. The use of natural gas requires adequate infrastructures, from transportation to storage, and it seems that these conditions have not yet been created for Namibe, as in many parts of Angola. The Namibe energy sector is dependent on the decisions of the central government, and local government has no direct decision on the planned projects. Furthermore, local projects will not bring significant improvements to the energy sector, because they are low-level investments, and there seems to be virtually no energy planning at the province level.
The energy problems are nearly the same for all Angola. The major cities still struggle with the lack of energy supply; for the majority of municipal headquarters, which are the secondary cities, the main source of energy is thermal, also with limitations. There is a need to review the country's energy policy. The lack of access to modern energy services is considered as energy poverty, and constitutes a global challenge for development (Dornan, 2014). Energy has always played a key role in social development of societies (Sebri & Ben-Salha, 2014), and this should also be expected for Namibe. This energy must be efficient, uninterrupted, capable of satisfying demand; and its generation, transport and distribution must consider not only the preservation of the environment, but also the rationalisation of natural resources.
In this context, the main objective of this work is to propose an energy mix that guarantees security of electricity supply, environmental protection and sustainable socio-economic development for Na-mibe. The choice of Namibe as a case study is based on the following considerations: the sources that make up the power generation sector in Namibe do not have the capacity to produce the electricity necessary to meet the growing demand and drive the desired socio-economic development, and in turn these sources of energy generation continue to be unsustainable with regard to protection of the environment and security of the electricity supply. These problems are associated inadequate or non-existent energy policies. Consequently, it is important to create energy scenarios to obtain the most diversified, least costly, and most sustainable supply, while at the same time guaranteeing access to electricity for the entire population, in order to minimise the energy crisis in the province. To this end, this paper has specific aims: (i) to characterise the current state of Namibe's energy sector; (ii) to determine the electricity consumption needs for the coming decades; (iii) to analyse greenhouse gas (GHG) emissions in all scenarios; (iv) to analyse the energy production costs by technology and the equivalent CO2 emission costs by scenario in the year 2040. The Long-range Energy Alternative and Planning System (LEAP) program is used to simulate and analyse future energy scenarios for electricity supply and GHG emissions for the period 2014-2040.
Several models of energy planning have been developed to help policymakers on energy supply and demand policies internationally. These are tools that help identify the best combination of supply options for the short, medium and long terms (Vilar et al., 2012), providing insights into how energy systems may evolve in the future, but they do not require a specific tool for a specific task (Ouedraogo, 2017a). According to Ouedraogo (2017a), the models with the purpose of creating scenarios stand out from MARKAL/TIMES, MESSAGE and LEAP.
For MARKAL/TIMES, they are general use model generators adapted by the input data to represent the evolution over a period, generally 20 to 50 or 100 years, of a specific energy-environmental system at a global, multi-regional, national, state/province, or community level. This model was used in the study carried out by Contaldi et al. (2007), which evaluated the general effects of the Italian obligation to supply renewable electricity and compared the contribution of each energy source expected to the economic equilibrium mix resulting from computable economic equilibrium scenarios. Bouckaert et al. (2014) carried out a
study in Reunion Island, where the program used was also MARKAL/TIMES, which enabled the assessment of the impact of demand response on future electrical systems and the extent to which they could facilitate the dissemination of large amounts of renewable energy, maintaining a certain level of reliability.
The MESSAGE model is used to optimise energy investment decisions in order to find the best solutions. This means that operating and investment cost data are of primary importance in this model. This model was used in the study of Hainoun et al. (2010) in Syria, which consisted of a long-term energy supply optimisation strategy based on mi nimising the total system costs for the entire study period, 2003-2030. The model was also used by Fairuz et al. (2013), to analyse the cost of energy expansion and the resulting carbon footprint in Malaysia for the period 2009-2030.
This paper highlights LEAP, developed by the Stockholm Environmental Institute, and adopted by thousands of organisations in more than 190 countries (SEI, 2005). LEAP is a scenario-based energy-environment modelling tool, in which the scenarios are based on comprehensively accounting for the way energy is generated, converted and consumed in a particular region or economy, under a set of hypotheses about population, economic and techno -logical development and costs, among others. It has flexible structures and allows a rich analysis of the technological specifications and details that may be chosen by the user (SEI, 2005).
Some works based on this tool have focused on the projection of the energy supply and/or analysis of GHG emissions in some countries, and their implications in the respective energy policies. LEAP was used by Ouedraogo (2017a; 2017b) to analyse and forecast energy demand and related emissions under alternative strategies in Africa. The results allowed defining the policies for accelerating the electricity access and for promoting renewable energy sources, energy efficiency and their environmental implications. To our knowledge, these are the only two studies applying LEAP in African countries. Nevertheless, there are other relevant studies applied to China, Brazil, Iran and India. For China, Zhou et al. (2014) used LEAP to simulate energy demand and carbon dioxide (CO 2) trends by 2050. For a substantial reduction in CO2 emissions, it was recommended to establish a long-term low-carbon development strategy that consists of improving energy efficiency, optimising the energy structure, implementing low-carbon technologies, and establishing market-based economic instruments (in this case the removal of clean energy subsidies). In the study by De Andrade et al. (2015), based on the evolution trend of the Brazilian energy matrix, where the probable scenarios of GHG mitigation are exposed, the LEAP tool was used to assess future scenarios and trends in energy generation, as well as projections of demand and supply of electricity in the period 2010-2030. These scenarios highlight the promotion of the combination of renewable energy sources and energy efficiency, which allows Brazil to have a differentiated performance in the generation and use of energy. Nojedehi et al. (2016) used LEAP to estimate the energy and non-energy emissions of the city of Tehran (Iran) for the period 2012-2035. The results showed that, of the two scenarios created, business-as-usual and sustainabl e waste management, the latter presents a GHG reduction, and that the landfill gas plant could provide around 0.5 GWh of energy in 2016, with an incremental trend that in 2035 could reach 0.9 GWh, which could represent a service of 1.77% of energy demand for Tehran in that year. For India, Kumar & Madlener (2016) assessed the effects of the use of renewable energy sources on electricity supply systems and estimated CO2 emissions through the development of several scenarios under the lowest-cost approach for the period 2010-2050, using the LEAP tool. The results showed that, in a scenario of accelerated renewable energy technology, the energy generated by renewable energy sources would have a share of 23% in the energy mix and 74% of CO2 emissions would be reduced by 2050 compared to the business-as-usual scenario. However, if this scenario is combined with the maximum potential for energy savings, the share of renewable energy sources in the generation of electricity could rise to 36%, but the reduction of emissions would remai n at 74%.
For the present work, given its objectives, the LEAP tool was chosen for its flexibility and ease of use, and for allowing that even with few variables related to population, consumption, production and installed power of sources, it was possible to estimate energy supply and the calculation of GHG emissions, which are key data in this work. The limited availability of data for Namibe, the studied region, made this the obvious choice. This fact is reinforced by Ouedraogo (2017b) regarding developing countries in Africa. These countries do not have enough information to ensure the quality of time series data, which are required in other modelling tools, so that using LEAP, whose energy modelling structure requires only detailed statistical data for the base year, is advisable.
This research on Namibe is the first of its kind in Angola, and may be seen as a starting point to support future research in the energy sector in the country. It may serve to stimulate work for the development of renewable energy sources and may serve as an instrument to assist energy policymakers in decision-making on the supply and demand of electricity for Namibe, and may be extended to other regions of Angola. It may also make Angolan society aware of the benefits that the development of renewable energy sources may bring to socio-economic development, to improvements in education, information and health. Moreover, despite being a local study, both the methodology and the type of policies proposed can be replicated in other regions of Africa. There is a gap in the literature, since there are practically no studies on this theme for Africa, and there is much similarity among African regions in relation to: (i) the current state of energy consumption, particularly in situations of energy poverty; (ii) the structure of energy consumption, composed essentially of fossil fuels; (iii) the potential for the development of renewable energies; and (iv) the obstacles to a balanced and sustainable energy supply.
This paper is structured as follows. This introduction is followed by section 2, presenting data and details about the methodology; section 3 presents the results and discussion; and section 4 offers conclusions and policy recommendations.
2. Methodology and data
As described above, LEAP software was used in creating future energy scenarios and in calculating GHG emissions in electricity generation for 20202040 for Namibe.
The selection of energy generation technologies that integrate each energy scenario created by LEAP assumed the proposals of the local and central governments and the objectives mentioned above. Likewise, it began with the identification of energy resources of greater availability both locally and nationally, given their potential to integrate the proposed energy scenarios. The energy policy proposals were based on modelling policies already successfully implemented in other African countries such as Morocco (Kousksou, Allouhi et al., 2015; Kousksou, Arid et al., 2015), Ghana (Abubakar Mas'Ud et al., 2016; Atsu et al., 2016), Kenya (Abubakar Mas'Ud et al., 2016), Cameroon (Wirba et al., 2015), and Nigeria (Ohunakin et al., 2014; Emodi & Boo, 2015).
Based on the defined aims and on the chosen methodology, the composition of the sustainable energy mix for Namibe is proposed. Electricity consumption is forecast for 2020-2040, based on the ratio established between the population projected for the same period and the average per capita electricity consumption of the six top Southern African Development Community (SADC) countries in 2016. Four energy supply scenarios were created, including GHG emissions projections. It was possible to determine the most sustainable scenario regarding the diversification of sources and the minimisation of GHG emissions.
Population data was obtained from the National Statistics Institute of Angola (INE) projection for 2014-2050. Per capita energy consumption, population and rate of access to electricity from SADC were taken from the websites of the International Energy Agency (IEA), Populationf.inf, The Global Economy, and Worldmeters. The factorisation of the average value of per capita consumption by the projected population allowed determining the consumptions of electric energy required for Namibe in 2020-2040.
Until the 8th Consultative Council of Ministry of Energy and Water Angola's (MINEA) electricity production had two generation sources, hydro and thermal, with installed capacity of 2662.12 Megawatts (MW) and 1746.99 MW respectively, totalling 4409.11 MW by 2018 (PRODEL EP, 2018). Figure 1 shows the evolution of installed capacity in 2012 -2018 in the different electricity systems of Angola. Figure 2 shows the evolution of electricity supply in 2012-2018 (ENDE EP, 2018).
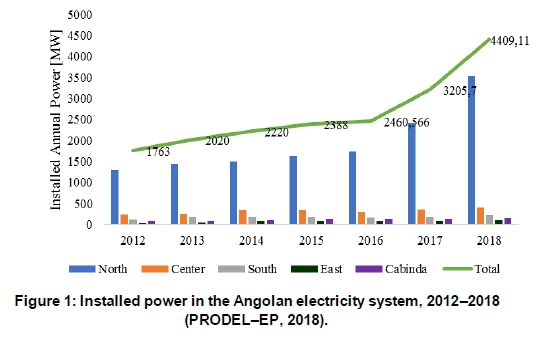
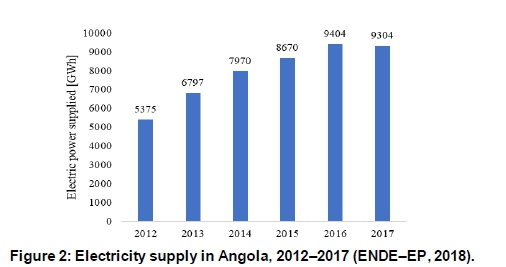
In 2017, there was a reduction in the supply of electricity. This resulted from the disturbances of power generation in the Capanda and Cambam be hydroelectric plants due to the filling of the reservoir of the Lauca hydroelectric project, since all of them were built on the Cuanza River (PRODEL EP, 2018). Similarly, the droughts of 2017 contributed negatively to generation in that year (PRODEL EP, 2018). It is expected that in 2018 energy produced was higher than in 2016 due to the increase in installed capacity of 1203.41 MW and because there were no known disturbances in the main hydroelectric plants during 2018.
Angola has a land area of 1 246 700 square kilometres (km2). Its population was estimated at 28.36 million in 2017, of which 61% were living in urban areas, and 30% had access to electricity distributed by ENDE-EP (ENDE EP, 2018; INE, 2016a). Table 1 shows the evolution of population and access to electricity in the years 2014 and 2017.

From 2014 to 2017, only about 272 240 additional people benefited from the electricity supply distributed by ENDE-EP, which accrued 8 507 890 beneficiaries, but the difference in populatio n growth was 2 570 610 inhabitants. This shows that the pace of population growth is not followed by the electricity supply. Even in urban areas, most people do not have access to electricity.
The province of Namibe has only two sources of electricity: hydro, located in Matala, Huíla province, about 360 km from the city of Moçâmedes (Namibe),
from which 9 MW of power has been made available, and a diesel thermoelectric plant, which in 2018 had 42.6 MW of available power (GPIESTN, 2018). The thermoelectric source is dominant,and supplied 100% of the electricity generated in 2018, due to the unavailability of hydro due to rehabilitati o n and modernisation issues (GPIESTH, 2018; GPIESTN, 2018).
In 2014, it was not possible to meet the energy needs of the population, and 70% of the populatio n of Namibe had no access to electricity from the network. The situation has worsened, and in 2017 only 32% of the population had access (ENDE EP, 2018). Namibe's energy sector has shown to have no significant investments to increase the installation capacity or to expand the electricity distributio n network to meet the demand, partly justified by population growth (ENDE EP, 2015).
2.1 Base year
The year 2014 was chosen as base year as it was the year that gathers more official information about the variables that were used in LEAP. Moreover, in this year the INE conducted the first census of the population after independence (INE, 2016c). This source allowed data to be obtained for Namibe and for Angola, on the number of inhabitants, on access to electricity from the network, on the number of households, and on the average number of individuals per household. Moreover, in this year, the 5th Consultative Council of MINEA published historical data on energy consumption and generati o n (MINEA, 2015). This information reported in 2014, both by INEA and MINEA, was the main input data for LEAP. In the base year, Namibe installed capacity was 34.20 MW for all sources supplying electricity and the electricity produced was 164 700 Megawatt-hours (MWh) (DPEAN, 2014; ENDE EP, 2015). The population was estimated at 495 326, 63.73% of whom live in cities, and only 30% of the province's total population had access to electricity; the number of households was 97 018 each with an average of five members (INE, 2016c).
For the energy balance discussed here, only electricity was considered. There was no information about energy for cooking and heating purposes from firewood/biomass and liquefied petroleum gas (LPG). The emissions presented for the use of diesel and natural gas were obtained on the standard emission factors suggested by the Intergovernmental Panel on Climate Change, incorporated by the LEAP software itself. Processes that represent the two central power generators in 2014 are shown in Table 2.

2.2 Reference year
The reference year was 2040, allowing planning over a long period, with a 20-year timeframe (2020-2040). Predictions for Namibe points to 1 100 773 inhabitants (INE, 2016b) and to an electricity consumption of 2 540 000 MWh. Due to a lack of current information on the breakdown of energy consumption by consumers, it was also not possible to predict their unbundling for the reference year. In this way, the projected energy generation will be for the fulfilment of total annual consumption over the period 2020-2040.
From 2020 onwards, other energy sources such as wind, solar photovoltaic, thermoelectric and natural gas were added, as well as the increase of hydro capacity installed. The introduction was initially made on a small scale, and gradually progressed up to the year 2040. Four energy scenarios were simulated: A, B, C and D, with data for the resident population, energy sources, energy consumed and generated. In addition, the prospects of local and central governments were considered.
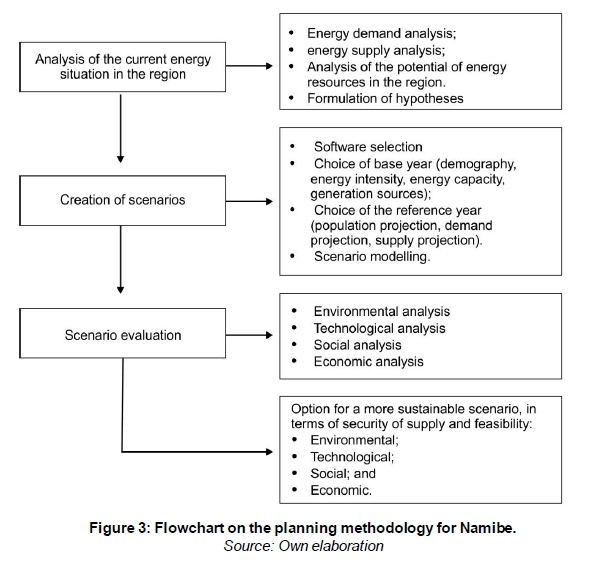
Despite being a local study, both the methodology and the type of policies proposed can be replicated to other regions of Africa. Therefore, in Figure 3, a flowchart is presented on the steps followed for the application of this study in Namibe, and in Angola as a whole, and elsewhere in Africa.
3. Results and discussion
In all scenarios, installed generation capacity remained constant from the base year until 2016. In 2017, there was an increase of 10 MW in the installed capacity of diesel thermoelectric (from 25.2 MW to 35.2 MW). In addition, the thermal power available was increased in 2018, to 42.6 MW, but hydro power was out of service due to the rehabilitation and modernisation of the Matala plant. In the other years installed capacity increased due to LEAP simulation, in line with the projected energy requirements for 2040, as there was no information on the local or central government strategy to increase production capacity. After 2018, the scenarios differ in their installed capacity, given the nature of electricity sources that integrate the respective scenarios. These installed capacities suggested by LEAP in each scenario may serve as a guiding map on how installation capacities may be inserted throughout the planning period so as to meet the expected demand in each year. The production of electricity was planned to satisfy the energy requirements in the reference year 2040, in which the expected electricity consumption is about 2 540 000 MWh.
3.1 Scenario A
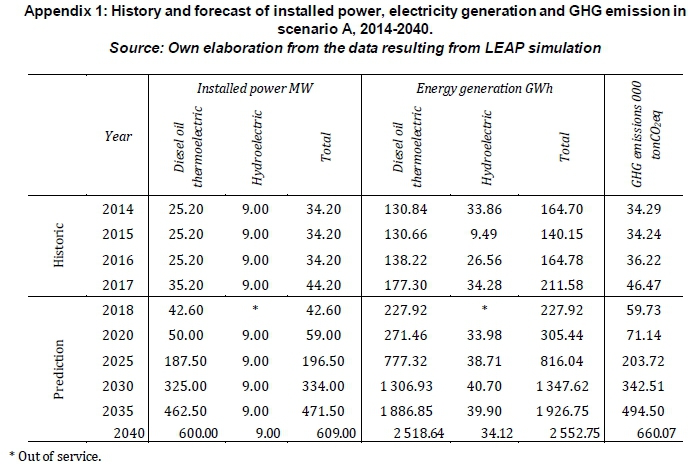
This scenario only considered the actual sources of electricity generation: thermoelectric diesel plant and hydro. It considered an increase in the thermoelectric plant capacity, whose projected installation power is 600 MW, after simulation in LEAP, to meet the projected needs in 2040. Hydro remains with the same energy supply capacity. These hypotheses considered the local government prospects, that point to an increase in the use of diesel thermoelectric sources (GPN, 2013). However, the total installed power of the two power sources is 609 MW, which corresponds to the installed power required to produce the desired electricity for 2040.
From 2018 to 2040, an increase of 1308.45% of thermoelectric installed capacity would be expected, to produce the energy required for that year.
Table 3 lists the processes that represent the two sources of electricity in the reference year 2040 and Appendix 1 presents the installation capacity (MW), the generation of electricity (GWh) and the emission of GHG (thousand metric tons of CO2e) and their history for scenario A.

3.2 Scenario B
Considering the projects of national scope, there was an increase of hydro capacity and the insertion of wind and solar sources after 2018. In 2040, it is intended that 100 MW of capacity would be available from the Baynes hydroelectric plant (DNERL, 2018; MINEA, 2011, 2015; MPDT, 2012) making 109 MW of hydropower available to Namibe. At this point, wind and solar photovoltaic sources are also integrated - two projects of national scope. In the region under study, there are winds with average annual speeds of 4-8 m/s at 50 m high, fulfilling the necessary requirements for the production of wind energy (GWA, 2018; MINEA, 2018b), while the average annual solar irradiation varies between 2000 and the 2400 kWh/m2, (MINEA, 2018b; SolarGis, 2014), which represents a considerable energy potential for the production of electrical energy. The wind source is located in Tigres Bay, Tômbwa municipality (Namibe), with an expected capacity of 100 MW (DNERL, 2018; MINEA, 2011, 2015; MPDT, 2012), and the solar photovoltaic source is located in Tômbwa, with an expected capacity of 2 MW, which will operate in a hybrid regime with diesel (DNERL, 2018; GPIESTN, 2018). In this scenario, the diesel power plant will have an installed capacity of 500 MW in the simulation of LEAP. The total installed power in this scenario is 711 MW, and the expected electricity generation from these sources is 2 579 830 MWh in 2040. The insertion of wind, solar and the Baynes hydroelectric power sources result from the plan of the central government to increase electricity generation capacity from these sources. The diesel source decreased by 16.67% in 2040 in its installation capacity compared to the same year of scenario A, due to the entrance of wind and solar in the generation mix. The processes that represent the three power generation plants are shown in Table 4.

After the LEAP simulation, the results of the history and prediction of the installation capacity, the electricity generation and the GHG emission for scenario B are presented in Appendix 2.
3.3 Scenario C
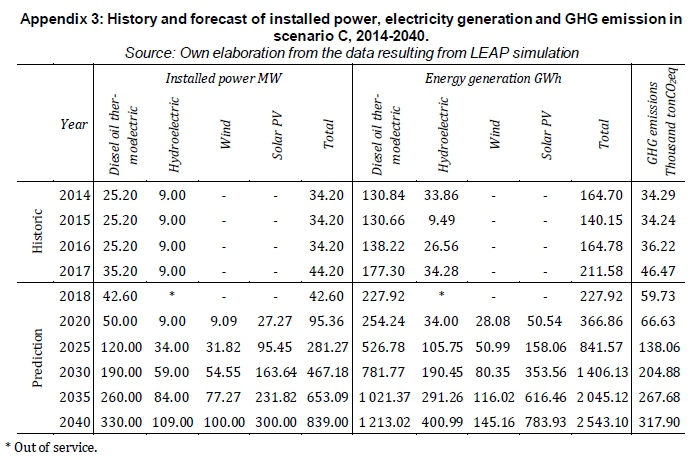
In this scenario, the highlight is the increase of solar photovoltaic, whose expected capacity is 300 MW of installed power in 2040, obtained from the simulation on LEAP, considering the capacity of other sources already set out in the previous scenario. The projected capacities of hydro and wind power sources remain unchanged, according to central government projects. Meanwhile, the capacity of the diesel oil thermoelectric plant is reduced by the increase in photovoltaics. The purpose of the investment in a photovoltaic system is to reduce GHG emissions, diversify electricity sources, and ensure access to electricity for the population of Namibe. The total installed capacity foreseen in 2040 for this scenario is 839 MW of power, whose expected energy generation is 2 543 100 MWh for the same year. In this case, the processes that represent the various power generation plants are shown in Table 5.
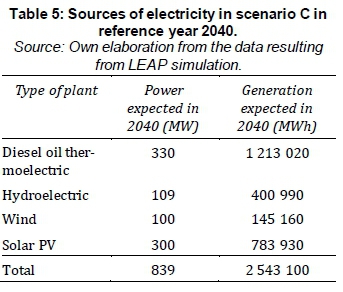
The insertion of solar photovoltaics allowed the reduction of the projected installed power of the diesel thermoelectric compared to the previous scenarios for the reference year 2040. The solar photovoltaic source for this scenario will represent 35.76% of total installed power. The installed capacity, electricity generation and expected GHG emission and their historical for scenario C are given in Appendix 3.
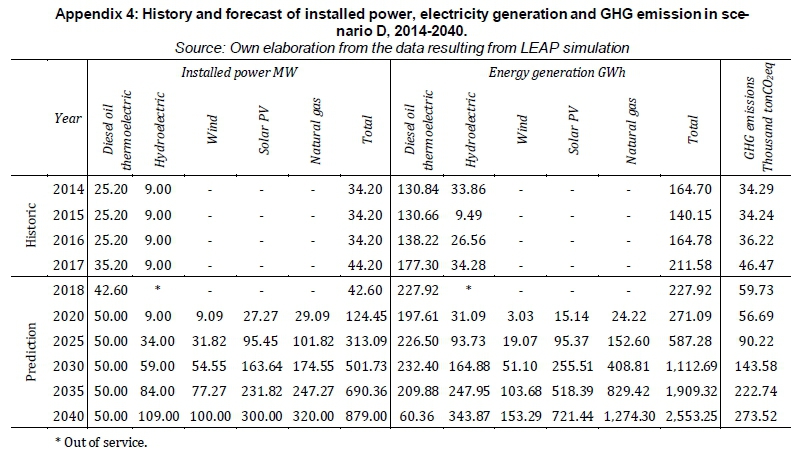
3.4 Scenario D
Scenario D, as with scenarios B and C, differs from scenario A after 2018, in which the insertion of wind, solar photovoltaic and thermoelectric sources and natural gas is projected. This scenario has five sources of electricity, and therefore is the most diversified. The natural gas thermoelectric source, whose proposed installed power is 320 MW, was included in this scenario with the purpose of limiting the increase of diesel thermoelectric. For 2020-2040, the installed power of the diesel thermoelectric has remained unchanged, while the other sources have undergone a gradual increase. The expected total electricity generation is 2 553 250 MWh, the installed power projected is 879 MW, being 36.4% of the natural gas thermoelectric plant, 34.13% of the solar photovoltaic plant, 12.4% of hydro, 11.38% of wind, and 5.69% of diesel thermoelectric. The processes that represent power generation plants and installation capacity are shown in Table 6. Appendix 4 shows the history and prediction of the installation capacity, the electricity generation and the GHG emission for scenario D.

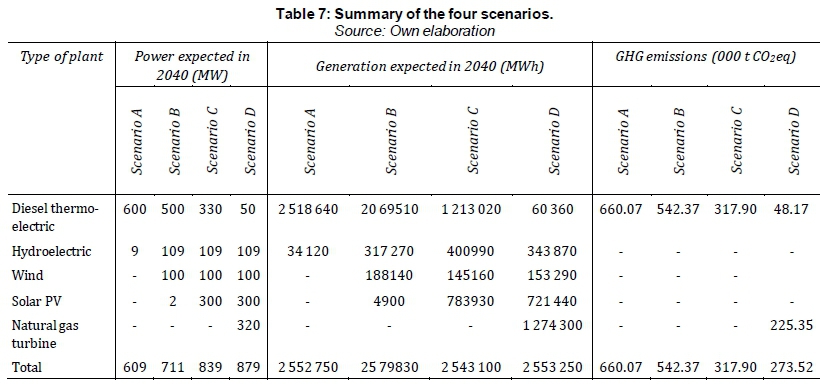
3.5 Summary of the scenarios
Table 7 presents the summary of the four scenarios of this work, where the installed capacity of power, the production of electric energy and the GHG emissions, projected for the year 2040, can be compared.
3.5 Greenhouse gas emissions analysis
Carbon dioxide, methane and nitrous oxide are the main GHGs that LEAP has in its assumptions, and the global warming potential (PAG) of each element for 20 years is 1 tCO2eq, 56 tCO2eq and 280 tCO2eq, and up to 100 years is 1 tCO2eq, 21 tCO2eq and 310 tCO2eq, respectively.
In all scenarios, GHG emissions were equal until 2018, due to historic data. In 2015 there was a slight decrease in GHG emissions compared to the previous year, because the diesel-based energy generation is lower than in 2014. From 2018 to 2040 the scenarios show a variation in the type of sources, the fossil fuel-based electricity generation capacity differs and consequently also the level of emissions.
Figure 4 shows the evolution of GHG emissions for 2014-2040 for each scenario (according to the data given in the appendices). The data are derived from the LEAP software simulation, considering the standard emission factors suggested by the IPCC. For the reference year 2040 the projected GHG emissions will be 660 070 tCO2eq for scenario A, 542 370 tCO2eq for scenario B, 317 900 tCO2eq for scenario C, and 273 520 tCO2eq for scenario D.
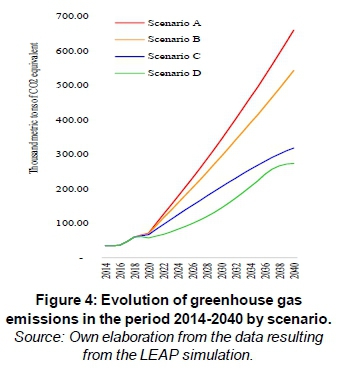
Scenario A is the one that presents more GHG emissions over the period. In 2040, GHG emissions are expected to be 19.25 times higher than those issued in 2014. It is the scenario where there is a higher generation of diesel-based electricity, accounting for 98.67% of the total electricity generation foreseen for 2040. In Scenario B there is a decrease in the generation of energy based on gas oil, and a consequent reduction in the GHG emission in relation to the scenario A. In the reference year the projected GHG emissions will be 15.82 times higher than the emissions issued in 2014. In scenario C, the insertion of the solar photovoltaic source allowed the reduction of diesel thermoelectricity. Consequently, emissions would be reduced considerably compared to scenarios A and B. However, GHG emissions forecast in the reference year will be 9.27 times higher than those in 2014. In scenario D, the insertion of a natural gas thermoelectric source was done with the aim of minimising the increase in the generation of electricity based on diesel. There was a decrease in GHG emissions in the reference year compared to the previous scenarios. However, the GHG emissions forecast in 2040 will be 7.98 times higher than those issued in 2014 and represent a reduction of about 59% compared to scenario A for the same year. It worth highlighting that in scenario D the expected electricity generation based on fossil fuels in 2040 corresponds to a 52.27% share of clean sources, this scenario being the one that emits least GHGs.
3.6 Economic analysis of scenarios
Two important costs were considered for the economic analysis of the scenarios: the cost of generation by technology and the cost of GHG emissions. Regarding generation costs, it was necessary to use the levelised costs of the generation technologies that MINEA defined in its energy projects until 2025 (Lusa, 2014; MINEA, 2018a), because only the information on the projected costs for investments in the Tômbwa wind farm and the Baynes hydroelectric power plant was available. The Tômbwa wind farm costs are estimated at EUR 176.6 million (Rede Angola, 2016), while Baynes hydroelectric power costs at EUR 1.2 billion, of which 70% will be financed by banks, and the remaining 30% will be allocated 50% for both countries (Angola and Namibia) (África 21 Online, 2014; MACAUHUB, 2013; Sapo, 2014).
Recent information on the levelised costs of energy generation in Angola, calculated by technologies, based on Lusa (2014) and MINEA (2018b) indicates that: the diesel thermal was evaluated at USD 220 per MWh; the hydroelectric plant varies from USD 100-600 per MWh according to the power capacity to be installed; natural gas-thermal for USD 153 per MWh; wind power for USD 135 per MWh and solar photovoltaic at USD 55 per MWh. Considering these levelised costs and the estimated energy generation for 2040, some calculations were made to determine the cost of generating electricity by technology (see Table 8).
As a way of internalising environmental externalities related with GHG emissions, the energy sector has to take responsibility for emissions of carbon costs and that represents a financial commitment, that may be translated into a tax on the environmental externality, based on the polluter pays principle. There is no reference to the cost of carbon in Angola but, according to world projections, by 2040 it could cost EUR 50/tCO2eq (EC, 2016) (about USD 57 in 2019 2019)), increasing to EUR 100/tCO2eq in 2050 as a way to coerce the responsible agents for GHG emissions to rethink their investments in generation and consumption units regarding the use of fossil fuel for generating of energy and heat. Calculations of CO2 costs have also been made considering GHG emissions by scenario, as shown in Appendices 1, 2, 3 and 4, and the estimated value for the carbon cost in the year 2040 is presented in Table 8.
Scenario A is practically dominated by the diesel source, with costs reaching USD 554 100 800. Considering the costs of GHG emissions and other technology the total value of the scenario corresponds at USD 593 431 070. Scenario B consists of four generation technologies. Depending on the share of each of these technologies and on the variation of the levelised cost of hydroelectric generation, the total cost ranges from USD 541 623 308 to USD 700 258 308. Scenario C is also made up of four generation technologies but differs in the share of each. Diesel thermal, although with a reduced generation, continues being the most expensive source, whereas solar photovoltaic presents least cost. The cost of generation plus the cost of GHG emissions for this scenario ranges from USD 386 345 012 to USD 586 840 012. Scenario D consists of five technologies. The total cost of the scenario ranges from USD 317 065 103 to USD 489 000 103. Natural gas technology is more cost-effective, as there is a reduction in both the cost of generation and the emission of GHG compared to diesel technology.
For the levelised cost condition of the hydroelectric technology to be evaluated at USD 100 /MWh, or below this, scenario A proves to be the costliest, while scenario D is the one with the lowest costs, with a reduction of 46% compared to scenario A. When the cost of generation is stipulated at USD 600 /MWh, scenario B is the costliest, while scenario D shows the lowest costs (less 30% compared to scenario B), representing a saving of USD 211 356 205. Generally speaking, scenario D has less costs for each hydroelectric technology option (USDD 100 /MWh or USD 600 /MWh), since in scenario A the generation with diesel represents only 2.4% of the total generation of scenario D in the reference year. This means that the generation of diesel-based electricity for the scenarios created in this paper is very costly.
4. Conclusions
To meet the energy needs of Namibe's population, it is necessary to change the current picture of the electric power system in order to increase its generation capacity. Faced with the referred challenges, it is imperative to diversify energy sources, considering those that are least aggressive to the environment.
Of the scenarios created in this study, D is the most sustainable, in terms of the diversification of the energy mix and GHG reduction, as well as the least costly (considering electricity generation and carbon costs). Energy policy makers can take the example of this scenario as a model to assist in making decisions on how power capacities can be installed over the planned time for the desired energy output. In this scenario, emissions are avoided at 386 550 tCO2eq compared to scenario A in 2040, and given the intermittency of photovoltaic and wind solar systems, natural gas appears in this scenario as an alternative resource to avoid interruptions in the supply of electricity. Although natural gas is not a clean resource, it is, however, the lowest GHG emitter compared to diesel.
Given that the province of Namibe has many dispersed localities, distributed generation of energy based on photovoltaic solar systems and natural gas thermoelectric plants would be a good option to ensure the supply to these localities and provision of universal access to electricity.
Due to data limitation issues, some subjects were not treated with greater rigour and depth, and others were not even addressed in this work. Therefore, for future studies, in the case of cost investments in generation technologies, a more detailed economic analysis of investment projects, calculation of green job generation, and projection of energy demand is needed. It also makes it imperative to create solar and wind maps that allow the identification of the energy potential in each locality or region of Namibe province.
Author contributions
Conceptualization, IL, MFD, MR; methodology, IL, MFD, MR; validation, IL, MFD, MR.; formal analysis, IL, MFD, MR. and L.J.R.N.; investigation, IL, MFD, MR; writing- original draft preparation, IL, MFD, MR.; writing-review and editing, MFD and MR; supervision, MFD, MR. All authors have read and agreed to the published version of the manuscript.
Acknowledgements
This work was financially supported by the research unit on Governance, Competitiveness and Public Policy (UIDB/04058/2020), funded by national funds through Fundação para a Ciência e Tecnologia, Portugal.
References
Abubakar Mas'Ud, A., Wirba, A. V., Muhammad-Sukki, F., Albarracín, R., Abu-Bakar, S. H., Munir, A. B., & Bani, N. A. 2016. A review on the recent progress made on solar photovoltaic in selected countries of sub-Saharan Africa. Renewable and Sustainable Energy Reviews, 62, 441-452. https://doi.org/10.1016/j.rser.2016.04.055 [ Links ]
África 21 Online. 2014. Angola e Namíbia juntam-se para construir barragem de 1,4 mil milhões de dólares. Página Inicial» Economia » Artigo. http://africa21online.com/artigo.php?a=6748&e=economia&page=30,5&npg=7 [ Links ]
Atsu, D., Agyemang, E. O., & Tsike, S. A. K. 2016. Solar electricity development and policy support in Ghana. Renewable and Sustainable Energy Reviews, 53, 792-800. https://doi.org/10.1016/j.rser.2015.09.031 [ Links ]
Banco de Portugal. 2019. Conversor de moeda. Banco de Portugal Estatísticas Consultar Dados Conversor de Moeda. https://www.bportugal.pt/conversor-moeda [ Links ]
Bouckaert, S., Mazauric, V., & Maïzi, N. 2014. Expanding renewable energy by implementing demand response. Energy Procedia 61: 1844-1847. https://doi.org/10.1016/j.egypro.2014.12.226 [ Links ]
Contaldi, M., Gracceva, F., & Tosato, G. 2007. Evaluation of green-certificates policies using the Markal-Macro-Italy model.Energy Policy. 35, 797-808. https://doi.org/10.1016/j.enpol.2006.03.011 [ Links ]
De Andrade Guerra, J. B. S. O., Dutra, L., Schwinden, N. B. C., & Andrade, S. F. De. 2015. Future scenarios and trends in energy generation in Brazil: Supply and demand and mitigation forecasts. Journal of Cleaner Production, 103, 197210. https://doi.org/10.1016ZJ.jclepro.2014.09.082 [ Links ]
DNERL [Direcção Nacional de Electrificação Rural e Local]. 2018. Melhorar o acesso aos serviços de energia nas zonas rurais. MINEA » Entrada » Conselho Consultivo » CC2018 » IIIo Painel-Balanço dos Órgãos Centrais. http://www.minea.gv.ao/index.php/conselho-consultivo/category/134-painel-iii [ Links ]
Dornan, M. 2014. Access to electricity in small island developing States of the Pacific: Issues and challenges. Renewable and Sustainable Energy Reviews,31, 726-735. https://doi.org/10.1016/j.rser.2013.12.037 [ Links ]
DPEAN [Direcção Provincial de Energia e Águas do Namibe]. 2014. Quadro das localidades dos municípios do Namibe pp. 1-11. [ Links ]
EC [European Commission]. 2016. EU Reference Scenario: Energy, transport and GHG emissions Trends to 2050. Main results. In European Commission. https://doi.org/10.2833 [ Links ]
Emodi, N. V., & Boo, K.-J. 2015. Sustainable energy development in Nigeria: Current status and policy options. Renewable and Sustainable Energy Reviews, 51, 356-381. https://doi.org/10.1016/j.rser.2015.06.016 [ Links ]
ENDE EP [Empresa Nacional de Distribuição de Electricidade - Empresa Pública]. 2015. Ponto de situação sobre o funcionamento de energia em Namibe pp. 1 -5. Momorandum. [ Links ]
ENDE EP [Empresa Nacional de Distribuição de Electricidade - Empresa Pública]. 2018. Foco na distribuição para um crescimento integrado. MINEA » Entrada » Conselho Consultivo » CC2018 » IIVo Painel-Balanço Das Empresas Públicas, Comissões de Gestão e GEPE MINEA. http://www.minea.gv.ao/index.php/conselho-consultivo/category/135-painel-iv [ Links ]
Fairuz, S.M.C., Sulaiman, M.Y., Lim, C.H., Mat, S., Ali, B., Saadatian, O., Ruslan, M.H., Salleh, E., & Sopian, K. 2013. Fairuz S, et al. Long term strategy for electricity generation in Peninsular Malaysia-Analysis of cost and carbon footprint using MESSAGE. Energy Policy. 62, 493-502. [ Links ]
GPIESTH [Gabinete Provincial de Infra-Estruturas e Serviços Técnicos da Huíla]. 2018. Síntese sobre o sector da energia e águas. MINEA » Entrada » Conselho Consultivo » CC2018 » IIo Painel-Balanço Dos Órgãos Provinciais. http://www.minea.gv.ao/index.php/conselho-consultivo/category/133-painel-ii [ Links ]
GPIESTN [Gabinete Provincial de Infra-Estruturas e Serviços Técnicos do Namibe]. 2018. NAMIBE - Breve caracterização da província no sector da energia e águas. MINEA » Entrada » Conselho Consultivo » CC2018 » IIo Painel-Balanço Dos Órgãos Provinciais; Gabinete Provincial de Infra-Estruturas e Serviços Técnicos. http://www.minea.gv.ao/index.php/conselho-consultivo/category/133-painel-ii [ Links ]
GPN [Governo Provincial do Namibe]. 2013. Plano de desenvolvimento económico e social da província do Namibe para o período 2013-2017. In Boletim Issue GPN. http://sipangola.org/gis/documents/Plano_de_desenvolvimento_provincial_do_Namibe_2013-2017.pdf [ Links ]
GWA [Global Wind Atlas]. 2018. Windspeed map - Angola. Global Wind Atlas» Wind» Speed» Angola. https://globalwindatlas.info/en/area/Angola?print=true [ Links ]
Hainoun, A., Aldin M,S., & Almoustafa, S. 2010, Formulating an optimal long-term energy supply strategy for Syria using MESSAGE model. Energy Policy, 38, 1701-1714. https://doi.org/10.1016/j.enpol.2009.11.032 [ Links ]
INE [Instituto Nacional de Estatísticas de Angola]. 2014. Resultados preliminaires do recenseamentogeral da populaçao e da habitaçao de Angola 2014. Censo 2014» Arquivos »Relatorios. file:///C:/Users/SONY/Downloads/PublicaçãoResultados Preliminares Censo 2014_FINAL.pdf [ Links ]
INE [Instituto Nacional de Estatísticas de Angola]. 2016a. Projecção da população 2014-2050. In Instituto Nacional de Estatística Ed., Início » Publicações» População e Sociedade » Projecção Da População 2015-2050. Instituto Nacional de Estatística. http://www.ine.gov.ao/publicacoes/populacao-e-sociedade-artigos/324-projeccao-da-populacao-2015-2050 [ Links ]
INE [Instituto Nacional de Estatísticas de Angola]. 2016b. Projecção da população da província do Namibe 2014-2050. [ Links ]
In Instituto Nacional de Estatística Ed., Início » Publicações» População e Sociedade » Projecção Da População 2015- 2050.Instituto Nacional de Estatística. http://www.ine.gov.ao/publicacoes/populacao-e-sociedade-artigos/324-projeccao-da-populacao-2015-2050 [ Links ]
INE [Instituto Nacional de Estatísticas de Angola]. 2016c. Recenceamentogeral da população e habitação. Resultados definitivos. Início » Publicações » População e Sociedade » Apresentações Dos Resultados Definitivos Do Censo 2014. https://doi.org/10.1017/CBO9781107415324.004 [ Links ]
Kousksou, T., Allouhi, A., Belattar, M., Jamil, A., El Rhafiki, T., Arid, A., & Zeraouli, Y. 2015. Renewable energy potential and national policy directions for sustainable development in Morocco. Renewable and Sustainable Energy Reviews, 47, 46-57. https://doi.org/10.1016/j.rser.2015.02.056 [ Links ]
Kousksou, T., Allouhi, A., Belattar, M., Jamil, A., El Rhafiki, T., & Zeraouli, Y. 2015. Morocco's strategy for energy security and low-carbon growth. Energy, 84, 98-105. https://doi.org/10.1016/j.energy.2015.02.048 [ Links ]
Kumar, S., & Madlener, R 2016. CO2 emission reduction potential assessment using renewable energy in India. Energy, 97, 273-282. https://doi.org/10.1016/j.energy.2015.12.131 [ Links ]
Lusa. 2014, July 4. Angola troca gasóleo por gás natural na produção de eletricidade. Dinheiro Vivo» Economia. https://www.dinheirovivo.pt/economia/angola-troca-gasoleo-por-gas-natural-na-producao-de-eletricidade/ [ Links ]
MACAUHUB. 2013. Barragem Baynes no rio Cunene, em Angola, custará 1350 milhões de dólares. Países. https://macauhub.com.mo/pt/2013/05/15/portugues-barragem-baynes-no-rio-cunene-em-angola-custara-1350-milhoes-de-dolares/ [ Links ]
MINEA [Ministério da Energia e Águas de Angola]. 2011. Perspectiva de evolução do sistema eléctrico nacional 2011 -2016. https://www.minea.gv.ao/index.php/projectos/category/27-dnee-direccao-nacional-de-energia-electrica?download=102:sistema_elctrico_de_angola_evoluo_2011_2016 [ Links ]
MINEA [Ministério da Energia e Águas de Angola]. 2015. Realizações do sector das energias no âmbito do plano nacional de desenvolvimento 2013-2017. Publicações. Conselho Consultivo. Energia . DNEE.Pptx. http://www.minea.gv.ao/publicacoes/cca/category/36-energia.html [ Links ]
MINEA [Ministério da Energia e Águas de Angola]. 2018a. Angola energia 2025 - Visão de longo prazo para o sector eléctrico. In S. A. Gesto-Energia Ed., Ministério da Energia e Águas» Entrada » Subsector » Angola Energia 2025 » Documentos 1a Edição. http://www.angolaenergia2025.com/pt-pt/conteudo/geracao-0 [ Links ]
MINEA [Ministério da Energia e Águas de Angola]. 2018b. Atlas e estratégia nacional para as novas energias renováveis. Ministério da Energia e Águas de Angola » Subsector» Angola Energia 2025 » Saiba Mais Sobre a Angola Energia 2025 » Documentos. http://www.angolaenergia2025.com/sites/default/files/editor/atlas_e_estrategia_nacional_para_as_novas_energias_renovaveis.pdf [ Links ]
MPDT [Ministério do Planeamento e Desenvolvimento Territorial de Angola]. 2012. Plano nacional de desenvolvimento 2013 - 2017. http://www.ucm.minfin.gov.ao/cs/groups/public/documents/document/zmlu/mdmz/~edisp/minfin033820.pdf [ Links ]
Nojedehi, P., Heidari, M., Ataei, A., Nedaei, M., & Kurdestani, E. 2016. Environmental assessment of energy production from landfill gas plants by using Long-range Energy Alternative Planning LEAP and IPCC methane estimation methods: A case study of Tehran. Sustainable Energy Technologies and Assessments, 16, 33-42. https://doi.org/10.1016Zj.seta.2016.04.001 [ Links ]
Ohunakin, O. S., Adaramola, M. S., Oyewola, O. M., & Fagbenle, R O. 2014. Solar energy applications and development in Nigeria: Drivers and barriers. Renewable and Sustainable Energy Reviews, 32, 294-301. https://doi.org/10.1016/j.rser.2014.01.014 [ Links ]
Ouedraogo, N. S. 2017a. Africa energy future: Alternative scenarios and their implications for sustainable development strategies. Energy Policy, 106, 457-471. https://doi.org/10.1016/j.enpol.2017.03.021 [ Links ]
Ouedraogo, N. S. 2017b. Modeling sustainable long-term electricity supply-demand in Africa. Applied Energy, 190, 1047-1067. https://doi.org/10.1016/j.apenergy.2016.12.162 [ Links ]
PRODEL EP [Empresa Pública de Produção de Electridade]. 2018. Apresentação da empresa,situação operacional e perspectivas. MINEA » Entrada » Conselho Consultivo » CC2018 » IIVo Painel-Balanço Das Empresas Públicas, Comissões de Gestão e GEPE MINEA. http://www.minea.gv.ao/index.php/conselho-consultivo/category/135-painel-iv [ Links ]
Rede Angola. 2016. Potencial do parque eólico do Namibe em destaque na Alemanha. RA » Sociedade. http://m.redeangola.info/potencial-do-parque-eolico-do-namibe-em-destaque-na-alemanha/ [ Links ]
Sapo. 2014. Governos de Angola e Namíbia garantem que barragem comum reforça relações. Atualidade. https://24.sapo.pt/noticias/internacional/artigo/governos-de-angola-e-namibia-garantem-que-barragem-comum-reforca-relacoes_18477743.html [ Links ]
Sebri, M., & Ben-Salha, O. 2014. On the causal dynamics between economic growth, renewable energy consumption, CO2 emissions and trade openness: Fresh evidence from BRICS countries. Renewable and Sustainable Energy Reviews, 39, 14-23. https://doi.org/10.1016/j.rser.2014.07.033 [ Links ]
SEI [Stockholm Environment Institute ]. 2005. User guide for LEAP 2005. May, 205. http://www.energycommunity.org/default.asp?action=41 [ Links ]
SolarGis. 2014. Global horizontal irradiation - Angola. SolarGIS-Solar-Map-Angola-En. http://solargis.info/doc/_pics/freemaps/1000px/ghi/SolarGIS-Solar-map-Angola-en.png [ Links ]
Vilar, D., Elayo, H., Lugmayr, M., Kappiah, M., Fall, A. 2012. Energias renováveis na África Ocidental - Estado, esperências e tendências Casa África ed.; ECREEE. http://www.ecreee.org/sites/default/files/energias_renovaveis_na_africa_ocidental.pdf [ Links ]
Wirba, A. V., Abubakar Mas'ud, A., Muhammad -Sukki, F., Ahmad, S., Mat Tahar, R., Abdul Rahim, R., Munir, A. B., & Karim, M. E. 2015. Renewable energy potentials in Cameroon: Prospects and challenges. Renewable Energy, 76, 560-565. https://doi.org/10.1016/j.renene.2014.11.083 [ Links ]
Zhou, Y., Hao, F., Meng, W., & Fu, J. 2014. Scenario analysis of energy-based low-carbon development in China. Journal of Environmental Sciences China, 268, 1631-1640. https://doi.org/10.1016/j.jes.2014.06.003 [ Links ]
* Corresponding author: Email: mfdias@ua.pt


