


Servicios Personalizados
Articulo
 Inglés (pdf)
 Articulo en XML
 Referencias del artículo
Indicadores

Links relacionados
-
 Citado por Google
 -
 Similares en Google
Compartir

 Permalink
Journal of Energy in Southern Africa
versión On-line ISSN 2413-3051
versión impresa ISSN 1021-447X
J. energy South. Afr. vol.32 no.4 Cape Town nov. 2021
http://dx.doi.org/10.17159/2413-3051/2021/v32i4a8397
ARTICLES
International procurement policies influencing renewable energy siting - implications for South Africa
Thabang B.M. Mosaka; Ndamulelo Mararakanye*; Bernard Bekker
Department of Electrical and Electronic Engineering, Stellenbosch University, Stellenbosch, South Africa
ABSTRACT
The South African Renewable Independent Power Producer Procurement Programme selects bid winners based on bid tariff (70% weighting) and various economic development criteria (30% weighting). Locating renewable energy (RE) projects in areas with better resources increases their cost competitiveness. As a result, most successful bids for wind and solar photovoltaic (PV) systems to date have been concentrated in the Eastern Cape and Northern Cape provinces, respectively. Studies have shown that a wider geographic distribution of wind and solar PV projects mitigates the impacts of the variability of wind and solar PV resources, eases grid congestion and generally improves the power system's operation. This paper conducts a literature review to investigate the procurement methods used in different regions of the world to influence the placement of RE plants, the results of which then inform proposals on adjustments to the current REI4P. The study finds that, after congestion incidents due to concentration of RE plants, some regions implement location-based tariff, where high-resource areas receive the lowest tariff and vice versa. Other regions prioritise on building transmission infrastructure in high-resource areas, while others limit the size of RE installations in one area. Given the current generation and transmission constraints in South Africa, it is important to encourage geographical dispersion of RE plants and avoid RE curtailment, since this can escalate the cost of RE integration significantly.
Keywords: geographic dispersion; procurement policy; renewable energy; siting
1. Introduction
In South Africa, rising concerns about global warming, the inability of the current generation fleet to meet the country's energy needs, and rapidly falling technology costs have resulted in the growth of renewable energy (RE). The Renewable Energy Independent Power Producer Procurement Programme (REIPPPP or REI4P) was introduced in 2011 to facilitate private sector investment into utility-scale RE generation integrated into the national grid. In this programme, independent power producers (IPPs) are invited to submit bids for onshore wind, solar photovoltaic (PV), concentrated solar power (CSP), small hydro, biomass, biogas and landfill gas projects (Eberhard and Naude, 2017). By the end of 2018, a total of 6 422 MW had been procured under the REI4P from 112 preferred bids (GreenCape, 2020) (including 20 small-scale REI4P projects, accounting for 99 MW). Of this capacity, 3 366 MW is from onshore wind, 2 372 MW from PV, 600 MW from CSP and 84 MW from small hydro, biomass and landfill gas. In addition, the Integrated Resource Plan released in October 2019 proposed increasing the capacity of utility-scale wind and PV to 17 742 MW and 8 288 MW respectively by 2030 (Department of Energy, 2019). If this plan is realised, wind and PV (excluding small-scale embedded generation) will contribute 33% of total installed capacity in the country by 2030.
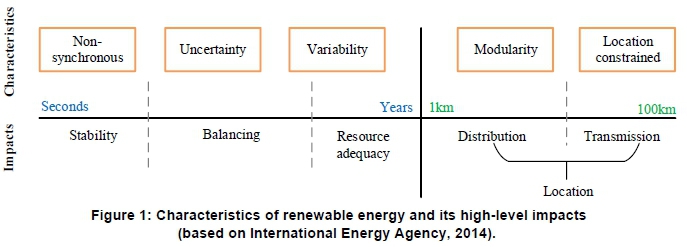
Wind and PV sources come with characteristics that, if not managed appropriately, may affect the reliability of the power system, as shown in Figure 1. Firstly, wind and PV are connected to the power system through power electronic converters, which reduce the rotating mass in the system (or inertia), potentially causing frequency stability problems when RE penetration levels exceed around 50% (Mararakanye and Bekker, 2019). In addition, the power output from wind and PV sources is variable and uncertain in all time scales (seconds to years), which can complicate balancing operations and resource adequacy planning once the instantaneous penetration level exceeds around 20% (Mararakanye and Bekker, 2019). Furthermore, these sources come in different sizes and are not always installed near load centres, which can cause congestion in distribution and transmission networks (resulting in RE curtailment) once the instantaneous penetration level exceeds around 10% (Mararakanye and Bekker, 2019).
Studies have shown that variability, uncertainty and network congestion can be reduced when the installations are distributed over a larger area, covering wider ranges of microclimates (Knorr et al., 2016; North American Electric Reliability Corporation, 2010; International Renewable Energy Agency, 2018; Lannoye et al., 2011; Imperial College and NERA Economic Consulting, 2015). In essence, geographic dispersion of RE plants is one of the technical options for reducing the need for power system flexibility. Other technical options available for reducing the need for flexibility, or increasing power system flexibility, include additional flexible generation, transmission and distribution expansion, energy storage, demand-side response and improved operations; most of which require significant investment (International Renewable Energy Agency, 2018; Lannoye et al., 2011; Imperial College and NERA Economic Consulting, 2015). To achieve geographic dispersion and limit some of these avoidable investments, there is a need for regulations that influence the location of RE installations.
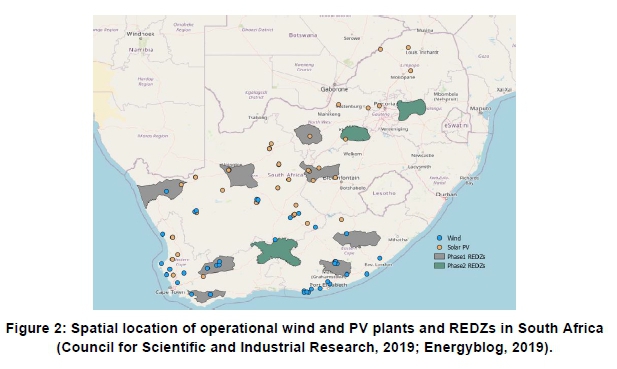
In South Africa, the bids submitted to the REI4P must first qualify for evaluation by meeting minimum compliance requirements, after which they are evaluated on price (bid tariff; 70%) and economic development (30%) criteria. The IPPs can comply with the economic development criteria by creating local jobs, manufacturing locally, meeting various black economic empowerment criteria, developing local communities etc. The bid tariff criterion evaluates the lowest R/kWh value (time-of-generation independent) proposed by the IPPs over the term of the agreement. The lowest R/kWh value is usually achieved when the proposed RE plant is located where the expected plant capacity factor is high (grid connection cost being the other typical major siting criterion) (Eberhard and Naude, 2017). As a result, most approved bids for onshore wind are concentrated in the Eastern Cape (high wind resource availability) while bids for PV are located in the Northern Cape (high solar irradiation levels), as shown in Figure 2. This indicates that the REI4P needs to be adjusted to encourage the geographic spread of RE projects.
In 2015, the Wind and Solar PV Strategic Environmental Assessment, conducted by the Department of Environmental Affairs, identified eight Renewable Energy Development Zones (REDZs) that are of strategic importance for large-scale wind and solar PV development (Department of Environmental Affairs, 2015). The main aim of REDZs is to streamline the planning, approval and implementation processes associated with appropriate large-scale wind and solar PV development in South Africa. The factors taken into account when identifying the REDZs included resource potential, infrastructure availability, environmental suitability, and socio-economic needs. In mid-2020, three more REDZs were proposed, with two in coal-mining areas (Department of Environment Forestry and Fisheries, 2019), because RE projects there can signifycantly contribute to mine rehabilitation. In addition, this will support just energy transition in areas where significant number of coal power stations are planned to be decommissioned by 2030. The spatial location of eleven REDZs in South Africa is also shown in Figure 2. REDZs have not been used in the first four bidding windows, but they are applicable going into the next bid windows. However, REDZs were identified based on best data available and are not sufficient to support project level decision-making in terms of the National Environmental Management Act. In addition, although the REDZs identify priority areas for RE development, they do not prevent development of RE projects in areas with good wind and solar resource that are outside the REDZs.
In essence, geographic dispersion of RE plants has been shown in the literature to reduce the need for power system flexibility, thereby allowing higher shares of RE to be integrated into the grid. Such geographical dispersion has so far not been explicitly encouraged in South Africa. This paper aims to inform decision makers in South Africa on policy adjustments that could be made to the REI4P towards increased geographical dispersion, as the country moves towards a decarbonised future. This is achieved by presenting a literature review on how different international policies and incentives (or their lack) influenced the siting of RE plants. The review focuses on the change in policies of different regions as the penetration of RE increased, and on what influenced those changes. The paper primarily considers wind and solar PV systems, since these are the most common RE sources in South Africa, as confirmed by the 2019 Integrated Resource Plan.
Section 2 reviews policy changes that were implemented by Denmark, Germany, China, Spain, Ireland, Texas, Karnataka and Argentina, acknowledging geographic dispersion. These regions were selected because their respective instantaneous penetration level of wind and PV has increased significantly over the past decade and their policy responses hold potential lessons for South Africa, both on what to do and what not to do regarding the siting of RE (International Renewable Energy Agency, 2019). Section 3 summarises the conclusions from this literature review, while section 4 discusses the implications for South Africa.
2. Review of international procurement policies influencing RE siting
2.1 Denmark
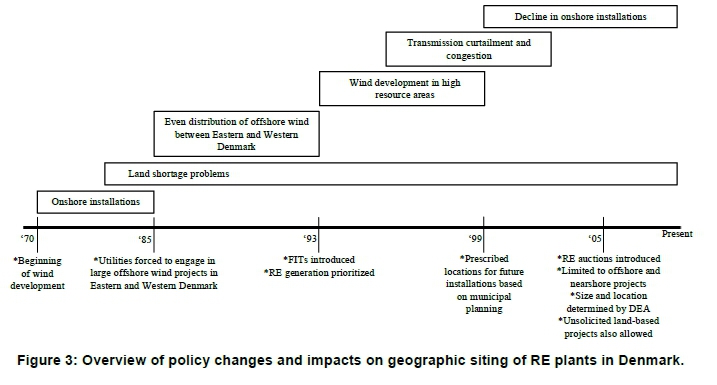
Denmark was a pioneer in wind turbine development between the 1970s and 1980s (Toke, 2015). During this period, wind turbines were typically installed onshore, but a shortage of land started to become a problem (Nielsen, 2017). Consequently, in 1985, the government directed the power utilities to engage in large offshore wind generation in eastern and western Denmark. Wind development in these geographically different areas ensured that, amongst other things, variability of wind generation was reduced through smoothing effects. There had been an even distribution of offshore wind between eastern and western Denmark until the country introduced feed-in-tariffs (FITs) in 1993 (Danish Energy Agency, 2015). The FITs encouraged wind plant developers to install wind turbines in high wind-yield onshore areas, since this was the most profitable (International Renewable Energy Agency and Global Wind Energy Council, 2013). In addition, RE generation was allocated priority in electricity supply scheduling, causing transmission congestion in the late 1990s and forcing the transmission system operator (Energinet) to curtail wind generation to ensure efficient and stable operation of the grid. In 1999, the country started setting out prescriptive locations for future installations based on broader categories of restrictions informed by municipal planning. This resulted in a decline in onshore wind installations, since the prescribed locations negatively influenced project economics (Albizu et al., 2018).
RE auctions were introduced in 2005, limited to the procurement of offshore and near-shore wind projects (Toke, 2015; Kruger et al., 2018). The Danish Energy Agency (also called Energistyrelsen) determines the specific size of the project and the geographical location for which interested developers can participate in the tender (Ropenus et al., 2015). Sites are chosen based on, amongst other things, average wind speeds, environmental concerns and technical grid limitations (Danish Energy Agency, 2015; Ram et al., 2017). In addition to auctions, Denmark allows land-based wind developers to submit unsolicited application for a licence to generate in areas of their own choice. These projects are compensated based on a nominal feed-in premium that is above the spot market price for the first 22 000 full-load hours (Vitina et al., 2015).
These projects should still meet minimum requirements in terms of size and number of turbines, and cannot be placed in areas that have already been designated for wind farms as part of the tendering procedure (Ropenus et al., 2015). Figure 3 summarises the policy changes and their impacts on geographic siting of RE plants in Denmark.
2.2 Germany
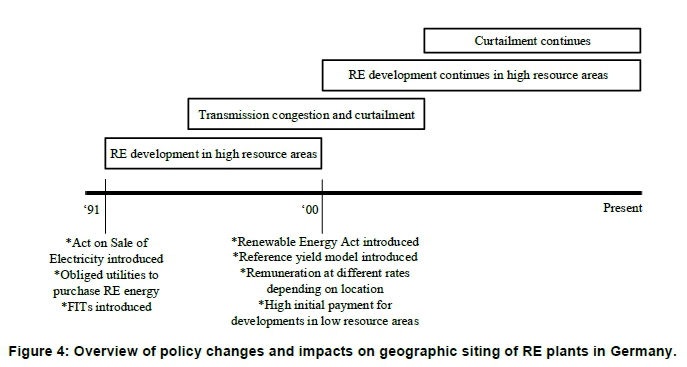
In 1991, Germany introduced the Act on the Sale of Electricity to the Grid (also known as StromEinspG) (Vitina et al., 2015). This obliged the public energy utilities to purchase electricity from renewables, based on stipulated FITs. With this tariff structure, wind farms located in high wind yield areas are more profitable as compared to those in low yield areas. As a result, most wind farms were installed in the German coastal regions with high wind-yield (Ateghang, 2016). This caused an imbalance in the transmission grid, as a high capacity of electricity was transmitted from the coast to the inland areas (Bechberger and Reiche, 2004). To remedy this shortcoming, StromEinspG was replaced by the Renewable Energy Act (also known as Erneuerbare Energien Gesetz or EEG) in 2000 (Vitina et al., 2015; Bechberger and Reiche, 2004; Lauf et al., 2018).
The EEG aimed to incentivise inland-based wind energy installations, by introducing the reference yield model (Bechberger and Reiche, 2004; Ohlhorst, 2015), which enabled the installation of wind farms throughout the federal territory by remunerating projects at different rates, depending on location (Tews, 2018). The EEG tariff structure included a high initial payment rate for the first five years of operation, after which the payment was to drop to the base rate for the subsequent 15 years (Vitina et al., 2015; Beckius and Magnusson, 2013). Wind farms in very high-yield sites (mostly coastal) receive no more than five years of the initial tariff and 15 years of the basic tariff. Wind farms in low-yield sites (mostly inland) get an extension of the claim duration for the high initial tariff up to 20 years (Vitina et al., 2015). Even though the reference yield model partly levelises regional differences in profitability, the overall profitability of investments still increased with the wind yield (Lauf et al., 2018). As a result, the coastal sites remained the more attractive choice for investors. The reference yield model therefore had no significant impact on the distribution of wind power in the federal territory. It just allowed a larger number of sites to become economically viable (Ohlhorst, 2015). Generation of wind has thus seen strong growth in northern Germany since 2000 and internal grid bottlenecks increasingly exist (Lauf et al., 2018; Peter et al., 2015). Figure 4 summarises the policy changes and impacts of those changes on geographic siting of RE plants in Germany.
2.3 China
Between 1986 and 1994, China mainly consisted of small-scale demonstration wind farms, primarily financed by foreign donor countries and loans (Wang et al., 2016). From 1994, the government, through the Ministry of Electric Power, started supporting wind power by mandating provincial utilities to facilitate grid connection and purchase of energy generated from wind farms. In 2003, the government introduced a tender scheme with the aim of meeting RE capacity targets set by the country (Wang et al., 2016). The provincial utility companies purchased the electricity generated from the winning projects at the bid price. Subsequently, the country introduced the Renewable Energy Law (REL) in 2005, of which the first implementation rules were issued in 2007. The law included, amongst other things, RE targets, FITs and a special fund for RE development. Both auctions and FITs encouraged developers to install most wind farms in the northern region where there is high wind yield (and hence more profit). This caused severe transmission bottlenecks, especially considering the fact that the country's load centres are located on the eastern coast (International Renewable Energy Agency and Global Wind Energy Council, 2013; Wang et al., 2016; Liu et al., 2013).
In 2009, the government published an Amendment to the REL, whereby new FITs were proposed. Under these, the country is divided into four regions, each with a different tariff. Areas with high wind-yield received lower tariffs, which resulted after 2009 in a minor spread of wind farms towards the south of the country. However, the development of wind farms in high wind-yield northern regions continued to grow beyond the level that could be accommodated by the grid, resulting in curtailments (International Renewable Energy Agency and Global Wind Energy Council, 2013; Wang et al., 2016). In addition, the 2009 FITs reflected the production cost at that time, and did not consider the fact that the production cost has decreased ever since. This further increased the financial burden on the government. In 2013, as a result, the government reduced the level of the FITs payable to wind farms, with the exception of those located in Zone IV, the area of weakest wind resource and lowest levels of project development (Du and Takeuchi, 2020). The projects in Zone IV became financially viable, resulting in more wind farms being developed there. In 2016, the tariff rates for all the zones were reduced as production cost of wind farms continued to decrease (Du and Takeuchi, 2020). However, the rate for Zone IV was reduced by a lower margin than were rates to the other three zones. Figure 5 summarises the policy changes and impacts of those changes on geographic siting of wind plants in China.
Solar PV development followed a similar policy trajectory as wind development. In 2011, the government introduced uniform FITs for grid-tied solar PV. This encouraged solar PV developers to install most farms in the western regions with rich solar resources. As a result, the government introduced the differentiated FITs. Under the new FITs, the country is divided into three regions, each with different tariffs based on the construction and production cost of solar PV. In 2016, the government reduced the rates in all regions as the construction and production cost continue to decrease (Du and Takeuchi, 2020).
2.4 Spain
In 2007, Spain introduced the FIT scheme, which led to a significant increase in installed capacity of renewable energy (Montoya et al., 2014). The site designation of a wind project is determined using the legislation of the specific autonomous community where the project is based. There are 17 autonomous communities in the Spanish State and each has its own legislation in terms of RE plants siting (Gabaldón-Estevan et al., 2018). Due to high FITs, most RE development were based in areas with the most resources, in order to maximise profit. From 2010, the FITs were significantly reduced, leading to a period of limited RE development (Montoya et al., 2014; Gabaldón-Estevan et al., 2018).
Spain is currently aiming to rapidly meet its RE obligations through auctions (Albizu et al., 2018). The first RE auction was held in 2016, without any limits in terms of project size. The auctions are geographically neutral and evaluation is based solely on price per kWh. Project developers continue to site RE plants in areas with the most resources. Curtailment has already resulted in a loss of approximately 70 million euros between January and March 2013, and furthermore, curtailment is expected to increase to 2.3 TWh per year in 2020, as there are no restrictions on site specifications in the auctions (Kies et al., 2016). Figure 6 summarises the policy changes and impacts of those changes on geographic siting of RE plants in Spain.
2.5 Ireland
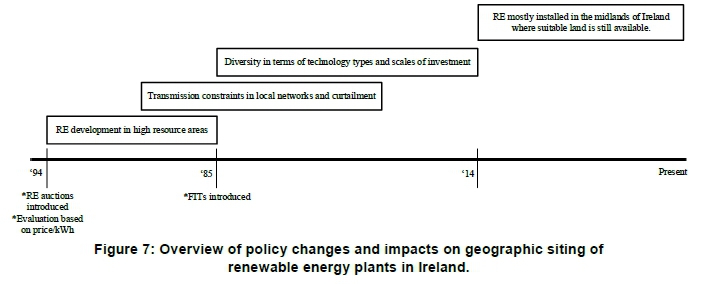
In 1994, Ireland launched the competitive tendering system called the Alternative Energy Requirement (AER) (Ó Gallachóir et al., 2005). In this
system, the prospective generators were invited to compete based on price per kWh of electricity. The lowest bids were preferred, and these were usually located on the country's west coast, where the wind yield is highest (Renewable Energy Strategy Group, 2000). One of the main challenges of AER was that planning permission of wind projects was not given significant weighting during the bidding phase. As a result, most winning projects were delayed due to difficulty in obtaining planning permission. The AER was replaced by a FIT scheme in 2006. The wind developers were still able to place their plants anywhere, but land zoning and the highly dispersed nature of rural settlements limited the area of land that could be used for individual wind project development, resulting in diversity in terms of technology types and scales of investment (Vitina et al., 2015).
By 2007, the average size of wind project in Ireland ranged between 10 MW and 17 MW, with owners ranging from individuals and community groups
groups to utilities. As the turbine capacity rating increased, a few large wind plants, ranging between 40 MW and 60 MW, were installed between 2008 and 2011. The connection of wind turbines in the western part of the country have, however, caused transmission constraints in local networks, resulting in wind energy curtailment (Kies et al., 2016; EirGrid Group, 2013). As of 2014, most wind turbines are installed in the midlands, where suitable land for wind project development is still available. These areas do not have high wind-yield, as compared to the coastal areas, and therefore may require larger wind turbines to ensure financial viability. Figure 7 summarises the policy changes and impacts of those changes on geographic siting of RE plants in Ireland.
2.6 Electric Reliability Council of Texas
In 1999, Texas introduced the Senate Bill 7, which included the first renewable portfolio standard (RPS) of the region. RPS obliged electricity providers of the region to meet certain targets of new RE capacity by 2009 (Drew, 2019; Staine, 2014). RPS also included a Renewable Energy Credit trading program that enabled electricity providers that do not own or purchase enough RE capacity to purchase credits instead of capacity from utilities with excess credits (Drew, 2019). Wind developers in Texas placed wind turbines in areas with high wind-yield in order to maximise profit, in this case the south-west of the state (Staine, 2014). However, the region started experiencing transmission congestion. As a result, the Electric Reliability Council of Texas (ERCOT) had to curtail wind farms periodically and wind plants could not provide the power that they were contractually obliged to provide.
In 2003, ERCOT started building transmission lines in those areas with high wind resources, in order to address the transmission congestion problem (Staine, 2014). In addition, legislation (Senate Bill 20) was passed in 2005 in an effort to improve transmission infrastructure and thus encourage RE production. The legislation required the Public Utility Commission of Texas to designate Competitive Renewable Energy Zones (CREZs) and required electric transmission infrastructure to be constructed (Drew, 2019; Staine, 2014). Five CREZs were identified in a planning process between the wind developers, the utilities and the regulators (Drew, 2019; Staine, 2014). The developers were assured that transmission network would be expanded appropriately to accommodate both existing and future developments (Staine, 2014; Fischlein et al., 2013). The CREZ investments were paid for by the taxpayers of Texas, regardless of whether they would directly benefit from the lines being built. The completion date for most projects was the end of 2013 (Staine, 2014). Since then, ER-COT has managed to reduce RE curtailment rates from 17% in 2009 to less than 4% in 2012 (Staine, 2014). Figure 8 summarises the policy changes and impacts of those changes on geographic siting of RE plants in Texas.
2.7 Other case studies
Karnataka leads India in solar capacity, with over 6 000 MW installed capacity by the end of 2019 (Balachandar, 2019). The state is also home to Pavagada Solar Park (with 2050 MW installed capacity), which was the largest solar farm in the world at the end of 2019. As a result of Pavagada, a lack of aggregation exists in solar generation within the state. A cloud passing through Pavagada causes power surges and drops in the state, which became a challenge to the system operator (Fairley, 2020). As a preliminary response to this problem, Karnataka capped subsequent solar farms at 200 MW, thereby forcing dispersion through policy changes (Fairley, 2020). This response, however, did not align with government policy favouring fast, cheap and larger installations, and Karnataka is considering other strategies, which may include building additional transmission lines.
In Argentina, the RenovAr programme was launched in 2016 to increase the country's share of RE generation (AURES II, 2019). RenovAr held RE auctions supported by risk mitigation methods and credit enhancement measures. The first two auction rounds, held in 2016 and 2017, awarded a total of 3.1 GW of wind energy projects. The maximum capacity that could be connected in a specific region was set by the system operator (Compañía Administradora del Mercado Eléctrico Mayorista S.A.)
based on the transmission capacity of that region (AURES II, 2019). This was done to limit RE curtailment due to transmission congestions. As a result, the onshore wind projects were mostly based in the southern half of Argentina, where there is adequate transmission capacity. The problem with this siting is that high wind resources and cheap land is found in rural areas of Argentina where there is a lack of transmission infrastructure (Oliver, 2016). Currently, the country has not presented plans to build transmission networks in rural areas or to allow private RE developers to include the cost of building transmission lines in power purchase agreement prices (Oliver, 2016).
3. Summary of the literature
The literature review in the preceding section focused on how different international policies and incentives influenced the siting of RE plants. The review can be summarised as follows.
During the initial stages of the respective RE programs that was reviewed, either FITs or competitive bidding was introduced, with projects evaluated solely based on price per kWh. As a result, RE developers typically installed RE plants in areas with the best resources in order to realise the best return on investment. However, RE resources are not distributed equally throughout the region and therefore most of these early installations were concentrated in a few locations with high resource yield. This caused local transmission congestion, which resulted in energy curtailment in these regions.
After several congestion incidents, these regions started acknowledging the need for geographical dispersion of RE plants. Different strategies were used, depending on specific conditions within the region. Denmark determined the sizes and geographical locations for which interested developers could participate in a tender programme. In addition, land-based projects in Denmark were remunerated with premiums above the spot market for a defined number of hours per year. Argentina offers an example where the location of RE projects was prescribed to areas where existing transmission infrastructure could support the development. Germany remunerated RE generation depending on the location, to ensure that installations in low wind-yield areas are financially viable. Similarly, China defined different FITs for various regions within the country, with regions in high wind-yield zones receiving the lowest FIT.
Spain does not necessarily acknowledge the need for geographic dispersion, so RE curtailment is expected to continue increasing. Texas prioritised transmission network expansion in order to reduce the congestion problems that were being experienced. In Ireland, the land zoning and the highly dispersed nature of rural settlement limits the area of land that could be used for individual RE projects. As a result, individual RE plants are small in terms of capacity, which helps in spreading them across the region. In Karnataka, the size of installations in one location was capped below a threshold, to force geographic dispersion of RE plants, while in parallel the transmission network of the region was expanded.
4. Implications for South Africa
As discussed earlier, South Africa's REI4P selects bid winners primarily based on price per kWh. This practice is causing concentration of wind and PV plants in the Eastern Cape and Northern Cape provinces respectively. If this practice continues, the international experience reviewed above shows that transmission congestion and RE curtailment is likely to follow. However, the consequences may be even more severe for South Africa as compared to other regions, due to the following:
• South Africa does not have adequate reserve margins to meet the load demand under various contingencies, as confirmed by the rolling blackouts that are being implemented. In addition, the country has limited mid-merit generation or flexible generation that can respond to variability and uncertainty introduced by wind and PV. In comparison, each of the countries reviewed above has adequate reserves as well as some strategy to maintain flexibility, as highlighted in Mararakanye and Bekker (2019). The strategy can be based on pumped storage, hydro, combined-cycle gas turbine, combined heat and power, or interconnections, all of which are limited in South Africa.
• Transmission constraints are also a problem in South Africa. This is linked to a lack of maintenance and inappropriate investment criteria applied in the past (Newbery and Eberhard, 2007). The available transmission capacity in areas with good RE resources is depleting quickly. This challenge will continue in future bid windows, particularly given that transmission expansion has longer lead times than RE installation. Therefore, there is a need to spread RE sources throughout the country, to ensure the existing transmission infrastructure is utilised while the necessary transmission expansion is implemented in regions with high RE resources.
Based on the case studies above, congestion and balancing operation may be a problem for South Africa before the instantaneous penetration levels of wind and PV exceed 10% and 20% indicated in the introduction above, respectively. If that happens, RE curtailment might be the only solution available for the system operator, which will come at a cost. Firstly, South African IPPs are compensated fully, whether or not the energy is curtailed. Secondly, the lost energy due to congestion-based curtailment must be replaced by other resources in the system that may be non-renewable and carry additional cost penalties: in South Africa, for example, electricity generation using fossil fuels and nuclear sources is subject to environmental levies and a carbon tax.
The above highlights the importance of encouraging geographical dispersion of RE plants and avoiding RE curtailment, given that this can escalate the cost of RE integration significantly. South Africa is already well positioned to do this: its REI4P provides an effective and proven procurement framework within which to implement RE siting policies; well-researched REDZ locations already exist, defined around existing/planned transmission corridors; and a growing body of research has been published aimed at informing the optimal placement of RE sites within these existing REDZs towards optimally supporting grid-balancing operations. For example, research published by Janse van Vuuren and Vermeulen (2019) categorises different regions within South Africa's already defined REDZs according to their predicted average daily and seasonal generation profiles.
Informed by the international experiences reviewed in this paper, and South Africa's unique context as discussed above, the REI4P should consider explicitly addressing geographical dispersion and the future curtailment of RE through adding RE siting considerations as part of its evaluation criteria and FIT model. It can do this in a variety of ways, for example by implementing varying FITs, although this might be difficult to model and complicated to implement. Potentially more quickly implementable adjustments might include not permitting RE siting outside of the already defined REDZs, and implementing quotas per bid window defined according to the daily and seasonal generation profiles of the procured RE sites required to optimally support grid-balancing. In essence, the country should move away from project-by-project procurement and focus on how the aggregated (or bulk) procurement supports the grid.
Acknowledgements
The authors acknowledge the facilities and support provided by the Centre for Renewable and Sustainable Energy Studies at Stellenbosch University. We would also like to acknowledge the World Wide Fund for Nature South Africa and European Climate Foundation for providing funding during various stages of this research.
Author roles
Thabang Mosaka: Conducted the literature review and wrote the first draft of the paper.
Ndamulelo Mararakanye: Corresponding author, revised the first draft and addressed reviewers' comments. Bernard Bekker: Revised draft paper, addressed reviewers' comments and provided supervision throughout the review process.
References
Albizu, L.G., Pagani, D. and Brink, T. 2018. Denmark - Germany - The Netherlands - Spain - United Kingdom. Germany: World Wind Energy Association. [ Links ]
Ateghang, E.W. 2016. Influence of the German renewable energy and climate policies on onshore wind energy generation: Implementation options in Cameroon. Doctoral dissertation. Germany: Brandenburg University of Technology. [ Links ]
AURES II. 2019. Auctions for the support of renewable energy in Argentina: Main results and lessons learned. Germany: AURES II. [ Links ]
Balachandar, G. 2019. Tamil Nadu and Karnataka remain key pillars of India's clean energy growth [Online]. Available from: https://www.thehindubusinessline.com/economy/tamil-nadu-and-karnataka-remain-key-pillars-of-indias-clean-energy-growth/article30156531.ece. [ Links ]
Bechberger, M. and Reiche, D. 2004. Renewable energy policy in Germany: pioneering and exemplary regulations. Energy for Sustainable Development 8 (1): 47-57. [ Links ]
Beckius, D. and Magnusson, D. 2013. The German wind energy market and its developers: A study of sourcing models, success factors and challenges. Stockholm, Sweden: KTH, School of Industrial Engineering and Management. [ Links ]
Council for Scientific and Industrial Research. 2019. Additional renewable energy development zones proposed for wind and solar PV [Online]. Available from: https://www.csir.co.za/renewable-energy-development-zones. [ Links ]
Danish Energy Agency. 2015. Danish experiences from offshore wind. Denmark: Danish Energy Agency. [ Links ]
Department of Energy. 2019. Integrated Resource Plan. South Africa: Department of Energy. [ Links ]
Department of Environment Forestry and Fisheries. 2019. Phase 2 Strategic environmental Assessment for wind and solar PV energy in South Africa. Stellenbosch, South Africa: Council for Scientific and Industrial Research. [ Links ]
Department of Environmental Affairs. 2015. Strategic Environmental Assessment for wind and solar photovoltaic energy in South Africa, Stellenbosch, South Africa: Council for Scientific and Induatrial Research. [ Links ]
Drew, T. 2008. Texas wind energy: Past, present, and future [Online]. Available from: https://www.wind-watch.org/documents/texas-wind-energy-past-present-and-future/. [ Links ]
Du, Y., Takeuchi K. 2020. Does small difference make a difference? Impact of feed-in tariff on renewable power generation in China. Energy Economics 87:104710. [ Links ]
Eberhard, A. and Naude, R. 2017. The South African Renewable Energy IPP Procurement Programme - Review, lessons learned and proposals to reduce transaction costs. South Africa: University of Cape Town, Graduate School of Business. [ Links ]
EirGrid Group. 2013. Transmission development plan 2013-2023. Ireland: EirGrid Group. [ Links ]
Energyblog. Utility-scale renewable energy generation sites - South Africa [Online]. Available from: http://www.energy.org.za/map-south-african-generation-projects. [ Links ]
Fairley, P. 2020. India grapples with vast solar parks: The pros and cons of the 2-gigawatt Pavagada installation. IEEE Spectrum: 8-9. [ Links ]
Fischlein, M., Wilson, E.J., Peterson, T,R. and Stephens, J.C. 2013. States of transmission: Moving towards large-scale wind power. Energy Policy 56: 101-113. [ Links ]
Gabaldón-Estevan, D., Peñalvo-López, E. and Solar, D.A. 2018. The Spanish turn against renewable energy development. Sustainability 10 (4): 1208. [ Links ]
GreenCape, 2020. Utility-scale renewable energy: 2020 market intelligence report, Cape Town, South Africa: Green-Cape. [ Links ]
Imperial College and NERA Economic Consulting. 2015. Value of flexibility in a decarbonised grid and system externalities of low-carbon generation technologies. London, UK: Imperial College. [ Links ]
International Energy Agency. 2014. Renewablesgrid integration and variability. Paris, France: International Energy Agency. [ Links ]
International Renewable Energy Agency and Global Wind Energy Council. 2013. 30 years of policies for wind energy: Lessons from 12 wind energy markets. Abu Dhabi, United Arab Emirates: International Renewable Energy Agency. [ Links ]
International Renewable Energy Agency. 2018. Power system flexibility for energy transition. Abu Dhabi, United Arab Emirates: International Renewable Energy Agency. [ Links ]
International Renewable Energy Agency. 2019. Renewable energy statistics 2019. Abu Dhabi, United Arab Emirates: International Renewable Energy Agency. [ Links ]
Janse van Vuuren, C.Y and Vermeulen, H.J. 2019. Clustered wind resource domains for the South African Renewable Energy Development Zones. 2019 Southern African Universities Power Engineering Conference/Robotics and Mechatronics/Pattern Recognition Association of South Africa (SAUPEC/RobMech/PRASA), Bloemfontein, South Africa: 616-623. doi: 10.1109/RoboMech.2019.8704832. [ Links ]
Kies, A., Schyska, B.U. and Von Bremen, L. 2016. Curtailment in a highly renewable power system and its effect on capacity factors. Energies 9 (7): 510-528. [ Links ]
Knorr, K., Zimmermann, B., Bofinger, S., Gerlach, A., Bischof-Niemz, T and Mushwana, C. 2016. Wind and solar PV resource aggregation study for South Africa. Pretoria, South Africa: Council for Scientific and Industrial Research. [ Links ]
Kruger, W., Eberhard, A. and Swartz, K. 2018. Renewable energy auctions: A global overview. South Africa: University of Cape Town, Graduate School of Business. [ Links ]
Lannoye, E., Flynn, D. and O'Malley, M. 2011. The role of power system flexibility in generation planning. IEEE Power and Energy Society General Meeting, 24-29 July, 2011:1-6. [ Links ]
Lauf, T., Ek, K., Gawel, E., Lehmann, P and Söderholm, P. 2018. The regional heterogeneity of wind power deployment. Leipzig, Germany: Helmholtz, Zentrum für Umweltforschung. [ Links ]
Liu, T.Y., Tavner, P.J., Feng, Y. and Qiu, Y.N. 2013. Review of recent offshore wind power developments in China. Wind Energy 16 (5): 786-803. [ Links ]
Mararakanye, N. and Bekker, B. 2019. Renewable energy integration impacts within the context of generator type, penetration level and grid characteristics. Renewable and Sustainable Energy Reviews 108 (March): 441-451. [ Links ]
Montoya, F.G., Aguilera, M.J. and Manzano-Agugliaro, F. 2014. Renewable energy production in Spain: A review. Renewable and Sustainable Energy Reviews 33 (February): 509-531. [ Links ]
Newbery, D. and Eberhard, A. 2007. South African network infrastructure review: Electricity. South Africa: Government of South Africa. [ Links ]
Nielsen, V.V. 2017. The Danish wind cluster: The microeconomics of competitiveness. USA: Harvard University, Harvard Business School. [ Links ]
North American Electric Reliability Corporation. 2010. Variable renewable energy power forecasting. USA: North American Electric Reliability Corporation. [ Links ]
Ó Gallachóir, B.P., Bazilian, M. and McKeogh, E.J. 2005. Wind energy policy development in Ireland: A critical analysis. Proceedings of the 11th Annual International Sustainable Development Research Conference, Helsinki, Finland, 6-8 June, 2005: 112-139. [ Links ]
Ohlhorst, D. 2015. Germany's energy transition policy between national targets and decentralized responsibilities. Journal of Integrative Environmental Sciences 12 (4): 303-322. [ Links ]
Oliver, N.R. 2016. No small triumph: The outlook for Argentina's renewable energy programs. Law School International Immersion Program Papers, No.17. [ Links ]
Peter, J., Elberg, C., Bettzugge, M.O. and Hoffler, F. 2015. Germany's wind and solar deployment 1991-2015: Facts and lessons learnt. Germany: University of Cologne, Institute of Energy Economics. [ Links ]
Ram, B., Anker, H.T., Clausen N., Nielsen T.R.L. 2017. Public engagement in Danish nearshore wind projects in law and practice. Copenhagen, Denmark: DTU Wind Energy. [ Links ]
Renewable Energy Strategy Group. Strategy for intensifying wind energy development. Ireland: Renewable Energy Strategy Group. [ Links ]
Ropenus, S., and Klinge Jacobsen, H. 2015. A snapshot of the Danish energy transition: Objectives, markets, grid, support schemes and acceptance. Berlin, Germany: Agora Energiewende. [ Links ]
Staine, R.R. 2014. CREZ II, coming soon to a windy Texas plain near you? Encouraging the Texas renewable energy industry through transmission investment. Texas Law Review 93 (2): 521-555. [ Links ]
Tews, K. 2018. The crash of a policy pilot to legally define community energy. Evidence from the German auction scheme. Sustainability 10 (10): 1-12. [ Links ]
Toke, D. 2015. Renewable energy auctions and tenders: How good are they? International Journal of Sustainable Energy Planning and Management 8: 43-56. [ Links ]
Vitina, A., Lüers, S., Wallasch, A., et.al. 2015. IEA wind task 26: Wind technology, cost, and performance trends in Denmark, Germany, Ireland, Norway, the European Union, and the United States: 2007-2012. Golden, CO, USA: National Renewable Energy Laboratory. [ Links ]
Wang, H., Kitson, L., Bridle, R., Gass, P. and Attwood C.2016. Wind power in China: A cautionary tale. China: Global Subsidies Initiative. [ Links ]
* Corresponding author: Email: ndamulelo@sun.ac.za

