


Serviços Personalizados
Artigo
 Inglês (pdf)
 Artigo em XML
 Referências do artigo
Indicadores

Links relacionados
-
 Citado por Google
 -
 Similares em Google
Compartilhar

 Permalink
Journal of Energy in Southern Africa
versão On-line ISSN 2413-3051
versão impressa ISSN 1021-447X
J. energy South. Afr. vol.32 no.4 Cape Town Nov. 2021
http://dx.doi.org/10.17159/2413-3051/2021/v32i4a8704
ARTICLES
Determining the causes of electricity losses and the role of management in curbing them: A case study of City of Tshwane Metropolitan Municipality, South Africa
Bongani Khonjelwayo*; Thilivhali Nthakheni
National Energy Regulator of South Africa, Pretoria, South Africa
ABSTRACT
The problem of energy losses, both nationally and internationally, is a leading cause for the financial collapse of most utilities. A quantitative research approach was adopted for this study where a questionnaire was used to collect information from the participants. A total of 113 City of Tshwane (CoT) employees within the electricity division participated in the study. Descriptive sta tistics and inferential statistical methods were used to analyse the outcome of the survey. The study found that technical and non-technical losses are the major cause of revenue loss. Non-technical losses are caused either by inefficiencies in managing losses or by end-users being unwilling to pay for electricity. The study found that power theft through meter tampering, incorrect billing by employees, and cable theft were also major causes of energy losses. Illegal connections were found to be the major cause of energy losses, along with power theft and lack of resources. Deficiencies in infrastructure maintenance were found to be the main cause of technical losses. The study found that management of CoT is committed to managing energy losses, being aware of their impact on the financial well-being of the municipality. There is an established policy of managing energy losses and there is a plan to replace ageing infrastructure. Employees are continuously trained in accurate billing and metering as part of efforts to curb energy losses. The municipality is also engaged in efforts to put educational programmes in place to inform communities about electricity theft.
HIGHLIGHTS:
• Technical losses are a major cause for utilities 'financial losses.
• Utilities must have a long-term loss management plan.
• Illegal connections are the leading cause of electricity losses.
• Energy losses impact negatively on service delivery.
• Management impacts on the ability of a municipality to reduce losses.
Keywords: technical and non-technical losses; energy losses; financial sustainability; role of management; service delivery
1. Introduction and background
Most utilities operate in an environment of high energy losses, which makes it difficult for them to maintain and refurbish electricity infrastructure in order to service their customers. In South Africa, the energy loss problem is prevalent within the energy supply industry, with municipalities failing to pay the bulk purchase bills because they lose 2050% of the purchased energy (Louw, 2019). According to Louw, non-technical losses (NTLs) globally account for USD 96 billion in lost revenues, the biggest contributor to this being electricity theft. South Africa contributes about USD 95 million (ZAR 1.4 billion, as at 31 December 2020). Eberhard (2019) focuses on South African metros and states that technical and NTLs have increased between 2007 and 2017: City of Johannesburg from 11% to18%; Ekurhuleni Metro from 8% to 20%; and City of Tshwane Metropolitan Municipality (CoT) from 8% to 20%.
The purpose of this study is to assist CoT to manage its energy losses to achieve its objective of revenue maximisation and the provision of basic services to its residents, by investigating the causes of energy losses and recommending strategies to address them. Further objectives of the study are to determine causes of energy losses; determine the role of management in curbing energy losses; and investigate the role of energy losses on service delivery.
1.1 Literature review
Numerous authors have explored the subject of energy losses. For example, Das and McFarlane (2019) explored the relationship between energy losses, electricity consumption and GDP in Jamaica and found a negative correlation between energy losses and GDP. Some authors, such as Boriratrit et al (2018) and Negadev (2018), focused on developing algorithms, methods and models to forecast measure and reduce both technical and NTLs. In South Africa, Louw (2019) investigated electricity utilities losses in relation to global statistics. Bakana (2018) explored measures put in place by City Power in Johannesburg to address high energy losses. There is a need for more research, via case studies, into South African municipal electricity distributors in terms of the challenges they face in with energy losses.
1.2 Theories on energy losses
According to Refou (2015), an energy loss is defined as a difference between the units of purchased electricity from the utility and the units of sold electricity consumed by customers. Electricity losses are the amount of electricity distributed to the end users that are not paid for by those users. They are considered as losses because utilities incur huge costs in generating and transmitting the electricity (Jiménez et al., 2014). In South Africa, municipalities purchase electricity from the national utility, Eskom; therefore if all of the purchased kilowatt-hours (KWh) are not sold, the difference will be electricity losses. Technical losses are estimated using load flow studies as well as network configuration and load flow information. NTLs, on the other hand, arise from internal process issues; these include incorrect billing information, faulty meters, and external issues such as electricity theft and meter tampering (Ramos et al., 2011)
1.3 Categories of energy losses
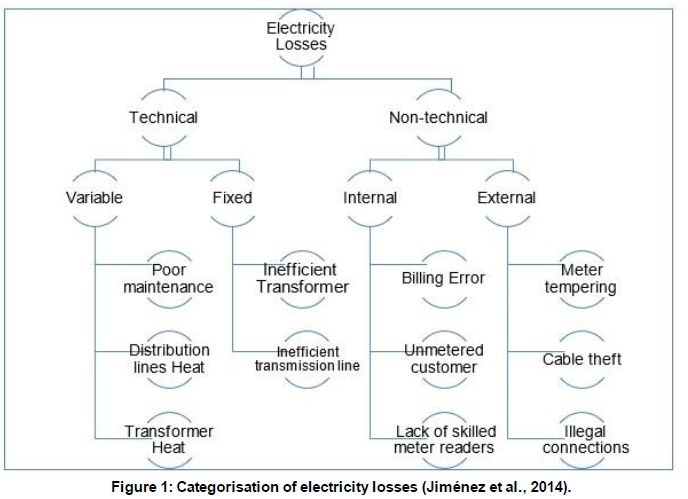
Jiménez et al. (2014) state that there are two broad categories of losses encountered in power systems. The first type is technical losses, which occur in transmission and distribution lines, and can be divided into fixed and variable losses. Technical losses are linked to energy degeneration in the conductors and assets used for distribution of electricity. The second type of losses is non-technical, and refers to electricity effectively delivered by a supplier but not paid for by the users, resulting in direct financial losses for the utility. According to the Council for European Energy Regulators (CEER) Report (2017), NTLs are caused by actions external to the power system but internal to overall management of the utility. Depending on the source, these losses can be attributed to stealing of electricity, fraud or tampering and unmetered supply. Technical losses are trigged by network characteristics and the nature of the capacity flow during the transportation of power.
The causes of these losses can further be categorised as internal or external, depending on what has prompted them. It can be external because employees and management are not involved or it is internal because of lack of an efficient operation by the utility (Refou, 2015). Internal causes are as a result of negligence and mismanagement by utilities whereas external causes are due to factors that are outside management control. Internal causes consist of billing errors, unmetered customers and lack of required skills, whereas external causes are meter tempering, cable theft and illegal connections Refou (2015). Error! Reference source not found. illustrates the two categories of electricity losses and further classification based on the major triggers for the occurrence of electricity losses.
1.4 Technical losses
Navani et al. (2012: mention that 'technical losses in power systems are caused by the physical properties of the components of the power system'. This occurs when power is discharged to the power lines and at the transformers because of their internal electrical resistance. Aquiles et al. (2017) indicate that 'Technical losses are naturally occurring losses (caused by action internal to the power system) and consist mainly of power dissipation in electrical system components such as transmission lines, power transformers and measurement system.' It is possible to compute and control technical losses, provided the power system in question consists of known quantities of loads.
Biryulin et al. (2016) says that it is possible to calculate and control technical losses as long as the elements within the powers system are known. Technical losses are equal to power produced minus power distributed plus NTLs as shown in Equation 1, the technical loss formula.
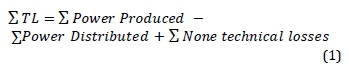
Parma (2013) states that technical losses in transmission systems are caused by the physical properties of the components of the power system. These technical losses are normally 22.5%, and directly depend on the network characteristics and the mode of operation. Eseosa and Promise (215:) state that 'technical losses are of two types, permanent technical losses which are naturally occurring losses (internal action to the power system), caused by the dispersal of heat resulting from current passing through conductors and from magnetic losses transformers'. Technical losses are inherently occurring, they cannot be avoided, and hence an allowance of 6% is granted for South African municipalities. The major causes of technical losses are given below.
Poor workmanship
Poor workmanship during the construction of electricity transmission lines contribute to the technical losses. Parmar (2013) states that joints are a source of power loss; therefore, the number of joints should be kept to a minimum and proper jointing techniques should be used to ensure firm connections. The servicing of aging lines should be done promptly by a qualified technician to avoid electricity losses where power leaks from the old lines.
Ndungu et al. (2017) state that poor or improper protection systems on the transformer contributes to malfunction of a transformer. Improper protection systems are caused by low standard fuses, lack of lightning arrestors and absence of lightning protectors.
Distribution lines losses
Long distribution lines also cause electricity losses. The electrification programme, where power is transmitted from power stations that are far from the villages, prompts a need to expand transmission lines. Parmar (2013) states that 'practically 11 kV and 415 volts' lines in rural areas are extended over long distances to feed loads scattered over large areas. Thus, the primary and secondary distribution lines in rural areas are largely radially laid usually extend over long distances. This results in high line resistance and therefore high losses in the line.
Expósito et al. (2016) state that electrically, distribution cables determine the maximum strength of electricity that they can transmit. The greater the power, the greater the line losses due to the production of heat as the result of a current flowing through a conductor. In order to reduce transmission losses, Expósito et al. advise that each phase of the line cable should be separated into duplex or triplex cables.
Conductor losses
According to Luo et al. (2015), distribution line losses can also occur due to conductor losses, which are triggered by absorbed and emitted heat. They further say that a heat balance question should be considered to calculate the relationship between heat and conductor resistance. The heat-balancing refers to the heat that is absorbed by the conductor being equal to that transmitted by the conductor. Heat retained by the conductor is due to the resistance of current streaming within the conductor at a specific temperature and the sun's warming of the conductor.
Van der Laan et al. (2011) state that high-temperature superconductors are an alternative to a typical conducting material in controlled network applications, because a high temperature permits them to be cooled with fluid nitrogen or helium gas. Technological developments in electrical instruments has an impact in curbing energy loss, and electricity distributors should explore current technology to find assistance in reducing technical losses.
Transformer losses
This type of losses is also referred to as copper losses. Pramod et al. (2016) state that transformer losses at a distribution level include both electricity distributed by cores magnetising inductance (iron loss) and the windings impedance (copper loss). Iron losses occur even when there is no load, hence they are called no-load losses, whereas copper losses are referred to as load losses. The effective resistance of transformer coils and core losses makes it to be a copper loss. According to Baggini (2014), no-load loss includes hysteresis losses and eddy current losses. Hysteresis losses occur due to the frictional development of attractive domains in the centre of the transformer. The relate to the kind of substances used in core manufacture. Such losses normally account for 50-80% percent of no-load losses.
Accurate measurement of transformer losses helps distributors to estimate the amount of technical losses that could incur in a given period. These estimates assist distributors in planning for maintenance of transformers or replacement to avoid using an asset that costs more money than it generates. Bua et al. (2016) state that 'No load losses shall exceed specified values by more than 10%, and total losses must not exceed specified by more than 6%'.
1.5 Non-technical losses
Fourie (2010) allude to NTLs being a major cause of utilities' financial losses because they are caused either by mismanagement or by end-users unwilling to pay for the use of electricity. NTLs are subdivided into internal and external losses: the former due to mismanagement and the latter external is due to factors such as theft. According to Agüero (2012), NTLs occur due to power stealing, meter alteration and mismanagement by utility management. Utility mismanagement includes energy consumed but not measured, incorrect reading of the meters, which leads to incorrect invoicing of customers and incorrect estimation of customers that cannot be measured using actual kWh consumed because they are in a remote area. Refou (2015) states that another reason for non-technical losses is errors of the watt-hour meter, a device that measures electrical power that passes through a circuit. Factors contributing to NTLs are categorised and discussed below.
Billing error and inaccurate meter reading
Parmar (2014) states that billing errors and late delivery of bills are amongst the causes of non-technical losses, and that accurately regulated meters need to be used to measure electricity consumption - the utility should immediately replace faulty meters to avoid incorrect readings. Incorrect meter reading can also be due to the appointment of incompetent meter readers. Calmeyer (2012) states that manual meter reading systems are based on the physical collection of billing information (energy per period and/or demand) by meter reading personnel on a monthly (or other set period) basis. In instances where meters are not physically read each month, the use of monthly consumption averages is occasionally deployed. In certain instances, end-use consumers and customers are able to read the meters themselves and forward this information either telephonically or electronically. Municipalities therefore need to invest in replacing manual meters with automatic meter reading, to avoid billing errors. Manual meters should be audited to ensure that they are functional and able to read the energy consumed by the customers.
Unmetered customers
Parmar (2014) states that unmetered energy supply to agricultural pumps is one of the major reasons for commercial losses. In most states in the USA, the agricultural tariff is based on the unit horsepower of the motors. Such power loads are sanctioned at the low load declarations. Further estimation of the energy consumed in unmetered supply has a great bearing on the estimation of losses on account of inherent errors in estimation.
According to Refou (2015), an innovative and accurate solution for identifying NTLs is available, using the optimum-path forest classifier and its learning algorithm. The solution also has an estimation-based approach to detect meter malfunction/tampering and provide quantitative evidences of non-technical loss.
Meter tampering and illegal connections
Rengarajan and Loganathan (2012) indicate two types of power theft that are found in distribution of electricity: meter tampering and the direct rigging of the distribution line. The latter is a major contributor to energy losses because power theft cannot be identified automatically as it can with meter bypassing. Utilities can make use of fuzzy logic in the distribution system to prevent this type of energy, according to Rengarajan and Loganathan.
Cable theft
In South Africa, cable theft is a national issue, especially in the province of Gauteng, which as the commercial hub of the country, offers many opportunities for cable theft. According to the CoT (2018), the honourable mayor Mr Solly Msimanga in his State of the City Address stated that:
Theft of cables has the potential to hamper the sustainable provision of services such as transport, communication, water and electricity. It affects the quality of life of residents and hampers local economic development as well. CoT assessment of these incidents in Tshwane indicates that there is an active attempt to destabilise the city's administration.
Communication
Cotton and Devine-Wright (2012) argue that, because of the nature of electricity infrastructure siting, the implementation of a reform such as eradication of energy losses is dependent upon generating support from local communities and other stakeholders. They suggest that there are also significant moral justifications for widening participation in electricity network development. Public involvement inspires residents to engage in a cooperative discussion with the municipality, helping to foster mutual trust and an information exchange that can eventually improve the reliability, accountability and acceptability of the decisions that are made by the municipality.
Leadership
According to Yukl (2013), leadership has been defined in terms of traits, behaviours, influence, interaction patterns, role relationship and occupation of administrative positions. There are four types of leadership style that are linked with organisational performance: autocratic, democratic, situational, laissez-faire leadership styles, with the democratic style being best for bringing out good organisational performance.
The electricity losses problem has become of great importance to every municipality and management, including the political arm, must be involved in curbing electricity losses. This problem requires a transformational leadership style that is efficient and active in ensuring that employees perform their day-to-day duties. The council must play a leading role by making resources available, both financial and human, by establishing an organisation-wide policy on electricity losses that is properly communicated to all the staff. The council must establish an electricity losses management structure that manages the entire process through close monitoring and evaluation. The council must ensure that their transformational leadership style is cross-cultural, and includes diversity and teamwork among employees within the organisation to ensure better performance.
1.6 Impact of corruption on energy losses
Bribery and corruption in the public sector play a pivotal role in the rise in energy loss in most municipalities. Grasso (2017) states that low government salaries, lack of education, poor management controls and lack of monitoring, poor recruitment and selection procedures, poor working conditions and facilities, lack of public information, and the inadequate capacity to meet the demand for government services, are all factors frequently cited as a source of corruption in less-developed countries. There seems to be an 'unofficial strategy' of government agencies and local authorities looking 'the other way when certain communities [like Soweto] are not paying. The unwritten criteria seem to be that the communities [like Soweto] that are in the voting camp of the ANC are usually not given a hard time when it comes to non-payment of ... electricity', suggests Kambule et al (2018; 2019).
1.7 The role of the energy regulator in loss management
With regard to regulation of electricity, a cost-reflective tariff can assist the municipality to lower energy losses. In countries such as Chile, Colombia, Costa Rica and Peru, the pricing systems have been set up to reward over-performance and penalise under-performance in both transmission and distribution in terms of loss reduction. The same pricing strategies have been adopted in large metropolitan areas in El Salvador, Guatemala, Panama, and Uruguay (Jiménez 2014). The Regulator normally allows a 7% energy loss to be recovered from customers through electricity tariffs. This means that cost of losses above the 7% cap will be paid for by utilities (Jiménez et al. 2014).
According to the Electricity Regulation Act (2006) under section 15(b), the Energy Regulator of South Africa must enable an efficient licensee to recover the full cost of its licenced activities, including a reasonable margin of return. The benchmark set on energy loss by the Energy Regulator for municipalities to be efficient is a minimum of 5% and a maximum of 12%, according to the 2017 approved benchmark and guideline document (National Energy Regulator, 2017). This implies that, in selling its electricity, CoT must ensure that at least 95% of its purchased electricity is paid for by customers.
1.8 Loss management strategies
Benefits of loss reduction strategies include direct cost savings from reducing electricity generated that is lost (e.g., less power is produced to meet same demand) and indirect or long-term savings from reducing the need for generation, transmission and distribution capacity. Direct cost savings depend on the amount of losses reduced and the avoidable cost of producing that electricity. Calculating this can be challenging, because the value of reducing losses is associated with the cost of production at the time of the reduction. One industry-accepted method for calculating load and no-load losses from a distribution transformer simplifies this by using an annual rate of energy (Jackson et al., 2014).
According to Min (2010), the loss of electricity happens in industrial, commercial and domestic customer categories, so it is important for municipalities to implement loss management strategi es across all of these. The focus of the present study is, however, on commercial and, mainly, domestic customers.
According to the Forum for Energy Regulato rs report (2016) on best practices and strategies for distribution loss and reduction, utilities must adopt the following framework:
• identify the causes of energy losses on a monthly basis;
• separate between technical and non-tec h-nical losses;
• ensure development of energy loss database management;
• invest in new infrastructure such as replacement of transformers and maintenance;
• install smart metering; and
• engage with the community.
Deloitte (2017) says that utilities must have a long-term loss management plan, which will assist in ensuring that future loss mitigation strategies are built, create a base for investments and create a relationship with customers. Strategies include improving accountability and governance, improving the management process, improving systems to ensure accurate data processing and interface between the billing and metering systems, and ensuring people-skills improvement.
McOmish (2015) states that the process of developing strategies for loss management involves a review of organisation policy, ensuring that allocation of costs to customers is justified to attain a cost-reflective tariff, addressing technical constraints by replacing old infrastructure with new, and assessing cost benefits over the life of assets.
1.9 South African context of energy losses
A report by the Centre for Scientific and Industrial Research et al. (2017) states that the electricity supply system is managed by Eskom whereby municipalities buy electricity from Eskom and sell to their customers. Municipalities are accountable for only 50% of the total electricity generated. There is a decline in transmission and distribution performance due to a lack of maintenance, inappropriate past investment criteria, and a lack of required skills. Between 2010 and 2014, average losses recorded were 8.7%, while in the 1980s, 1990s and 2000s these were 6.2%, 7.3% and 8.5% respectively. Recently, losses have been increasing significantly, with an average for all distributors in South Africa at 18% and for Eskom only at 9.15% (Eskom, 2018). In South Africa, both municipalities and Eskom are struggling to contain energy losses within the tolerable range. Energy losses lead to inadequate energy supply or shortage of power, which harms economic growth, and the social life of people (Eskom 2015). The South African Local Government Association and Municipal Managers Forum Report (2018) estimates that energy losses of municipalities amounted to R 9.2 billion in 2018. The current electricity supply system makes it difficult for utilities to manage their energy losses. There have been initiatives where Eskom collaborates with community through its operation Khanyisa that has yielded some good results. These were, however, eroded by the high rate of increase in energy losses.
The South African Revenue Protection Association (2018) states that the biggest challenge in addressing energy loses in South African municipalities is that smaller municipalities have no trained staff dedicated to revenue protection. Municipalities and metros also do not have revenue protection operational budgets. The report recommends establishing and training revenue protection units, the auditing of meters, establishing revenue recovery processes, and establishing revenue loss forums as best practices of reducing energy losses.
2. Methodology
The quantitative research method was used for this study, with numerical data analysed using descriptive techniques (numerical and graphical techniques) and inferential statistics. The benefit of this method is that there are controls to ensure that data integrity is not compromised. Under quantitative research, research is seen as independent from the participants. Quantitative research is associated with a deductive research method whereas qualitative research is associated with gathering information to develop a theory (Saunders et al: 2016). A survey strategy was adopted in this study, whereby a questionnaire was distributed to the participants. Participants were expected to respond to the questions to give their independent views. Younus (2014) argues that survey research has a high possibility of generalisation.
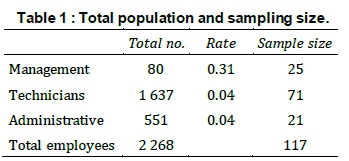
The target population for this study is the 2268 electricity division employees of CoT metropolitan municipality's electricity unit, based in Tshwane and its regional offices (see Table 1). For this research, only 117 completed questionnaires were obtained from 142 employees who made up the total sample. Of those employees who responded, four did not answer the entire questionnaires and the majority of employees from the target population refused to complete the question-naire. The total response rate for this research was 85% and it was calculated as follows: Response rate = Total number of responses
Total number in sample - Ineligible
= 117/ (142-4) = 117/138= 85%
2.1 Data analysis
The data was exported into Microsoft Excel (2016) and then into SPSS version 25 where it was analysed, a missing value analysis was done and all observations with more than 10% missing information were removed, as proposed by Hair et al. (2019). This resulted in four observations being removed leaving 113 observations. Data was then presented using descriptive and inferential statis
2.1 Demographic information
The respondents were asked to indicate their position, highest level of education, and years of experience working in CoT metropolitan municipality and the results are presented in Figures 3 and 4.
3. Descriptive statistics per objectives
The sections below give the results of the study based on the identified objectives.
Objective 1: To determine the causes of energy losses at the City of Tshwane Municipality and their impact on service delivery
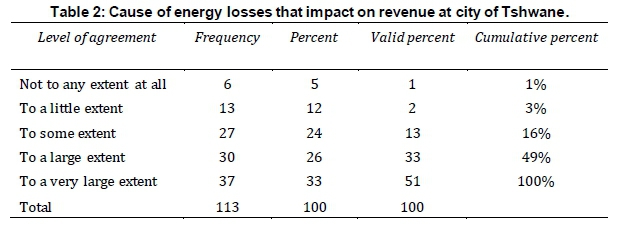
The first question required respondents to indicate the extent to which the following aspects are a cause or contributor to electricity losses at CoT; illegal connections; equipment overload due to illegal connections; non-functional meters leading to incorrect billing; meter reading errors; delays in the distribution of bills; non-payment of bills due to high prices; slowing down prepaid electricity meter; aging network; stealing of power and transformer leakages. These aspects were linked to the first objective of determining the causes of energy losses at the CoT. The scale items are presented in Table 2. The table shows that an average of 33% agrees to a very large extent, 26% agrees to a large extent, 24% agrees to some extent,12% agrees to a little extent, and 5% do not agree that the following are the causes of energy losses at CoT: equipment overload due to illegal connection, tampering of electricity meter, non-functional meters, incorrect billing, errors during meter reading, delays in electricity distribution of bills, non-payment by customers, affordability, slowing down of prepaid electricity meter, ageing networks, incorrect customer information, electricity cables being stolen by the community, and transformer leakage.
Respondents were also asked about the impact of energy losses in the delivery of services by the municipality to consumers. Respondents were required to indicate the extent to which they agreed with the statement that energy losses impact on service delivery as measured by the following: whether there is preference of CoT as a service provider of electricity, the understanding of current and future electricity customer needs by CoT, power cuts due to energy losses, demonstration by customers due to poor service delivery, CoT not meeting consumer demands, illegal connection of electricity or whether high electricity price tariffs lead residents to illegally connect electricity. Figure 5, based on the weighted average of the Likert scale, shows that tempering with electricity meters and illegal connections (leading to equipment overload and trips) are the leading cause of electricity losses (4.46), followed by non-functional meters (3.96), and electricity cable theft (3.87).
Objective 2: To determine the role of the CoT's management in managing electricity losses.
Respondents were required to indicate the extent to which they agreed that there is a policy to manage electricity losses; management are committed to curbing energy losses; and that there are resources to eradicate energy losses. Respondents indicated the extent to which management is aware of the impact of energy losses on the profitability of the municipality, the extent to which there are plans in place to remove ageing networks, and that employees are continuously being trained to record meter readings properly.
Respondents indicated the extent to which customer information is being verified so that bills are send to the right people and that management has put up a plan to curb energy losses that is continuously updated. They also indicated the extent to which energy losses are being identified and documented, whether a metering system is installed to the distribution feeder level that captures energy sent out and that employees are being trained in methods of reducing energy losses. Respondents also indicated the extent to which there is awareness education campaigns to the community to assist in reducing cable theft.
As Figure 6 shows, most respondents agreed that management are aware of the impact of energy losses on profitability of the municipality with a weighted average of 3.76 out of 5, followed by the fact that most respondents agree that meters have been installed at distribution feeder level to capture energy sent out. Respondents also agreed that the organisation has a policy to manage energy losses (3.24).
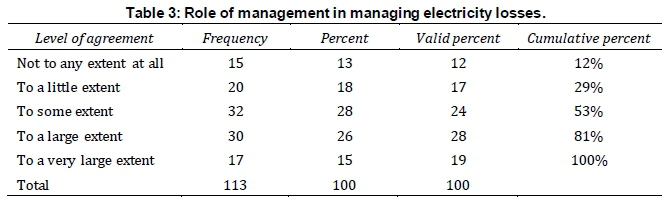
In summary, Table 3 shows that an average of 15% agree to a very large extent; 26% agree to a large extent; 28% agree to some extent;18% agree to a little extent; and 15% do not agree that management are managing electricity losses. This mean that management are involved to some extent in the management of energy losses for municipality.
Objective 3: To investigate the impact of energy losses on service delivery
Figure 7 shows the weighted averaged of responses to questions on service delivery. High electricity prices are the biggest factor leading to consumers illegally connecting electricity, with a weighted score of 4.04. Consumers have also demonstrated against service delivery for reasons related to energy losses (3.95). Customers have also experienced power cuts due to energy losses (3.56).
Table 4 provides a summary of levels of agreement to all the questions relating to the causes of electricity losses. It shows that an average of 29% agree to a very large extent; 24% agree to a large extent; 25% agree to some extent;13% agree to a little extent; and 9% do not agree that energy losses has an impact on service delivery in CoT as measured by the variables above.
Objective 4: To recommend strategies that the City needs to implement in order to improve its operations to ensure efficient and effective management of resources
In order to recommend strategies to address energy losses, the study had to establish a correlation between constructs which are causes of electricity losses, the role of management, and the impact of electricity losses on delivery. The extent of the relationship between variables was measured using Pearson's correlation coefficient. The rule of thumb proposed by Cohen (1988) was used to interpret the correlation where if r = 0.10 to 0.29, then there is a low effect (low correlation); r = 0.30 to 0.49 has a medium effect (moderate correlation); and r = 0.50 to 0.99 has a large effect (strong correlation).
Table 6 shows that causes of electricity losses has a significant positive correlation with service delivery (r = 0.587; p < .001) and weak significant positive correlation with role of management in managing electricity (r = 0.217; p < 0.05). The role of management in managing electricity losses had a statistically significant positive relationship with impact of electricity losses on service delivery (r = 0.209; p < 0.05).
4. Results and discussion
The finding that employees agreed that NTLs lead to the municipality losing revenue is in line with the view of Fourie (2010) that NTLs are a major cause for utilities' financial losses, resulting from either mismanagement or from end-users being unwilling to pay for electricity. It was found that illegal connections are the highest cause of energy losses. Power theft through meter tampering was also a major contributor to revenue losses, as were incorrect billing by CoT employees and cable theft. The finding that illegal connections and power theft are the reason for power loss at CoT is in line with the view that NTLs occur due to power stealing and meter alteration. Energy losses were also due to incorrect billing by incompetent meter readers
Aging infrastructure and lack of resources and infrastructure maintenance backlog are major causes of technical energy losses at CoT. Maintenance of ageing lines should be done to avoid loss of power, which is in line with the finding that aging infrastructure causes power loss. These findings were in line with the first objectives of determining the causes of energy losses and their impact on CoT's revenue.
The findings of the study also show that there is a correlation between electricity losses and an impact on service delivery. This means that energy losses have a negative impact on service delivery as measured by service demonstrations, power cuts and the municipality not meeting customer demands. The study also found that role of management is positively correlated with impact on energy losses, which means that prudent and efficient actions and efforts from management can lead to the reduction of energy losses.
The overall finding on the role of management was that there is commitment from it to curb energy losses. It was found that the municipality has a policy to manage electricity losses, with management committed to curbing them, but there are not enough resources to do this. Management is aware of impact of energy losses on profitability of the municipality and there are plans in place to remove ageing networks. Management was generally found to be providing leadership in ensuring electricity losses are managed, except for the provision of adequate resources and training of employees. Management has energy loss management policies in place and is aware of the impact of energy losses on the profitability of the municipality.
5. Conclusions
Most municipalities in South Africa pass energy losses on to the end customers, exacerbating the situation but raising the price at which customers buy electricity. Reduction of technical and non-technical losses involves investment in modern technology to transmit electricity to the end users in a more effective and efficient manner. Electricity distributers must strike a balance between the price of losses and the investment cost of new technology. Non-technical losses must be eradicated by eliminating power theft and ensuring that the energy to the customer is accurately measured.
Acknowledgements
The authors thank the City of Tshwane management and employees for their support and permission to conduct this study at the municipality. It would have not been possible without their support. Secondly, gratitude goes to the National Energy Regulator of South Africa for being a knowledge organisation that encourages learning and publication of research papers.
Author roles
Thilivhali Nthakheni: Primary and secondary data collection, interpretation of the results, review of article, proof reading.
Bongani Khonjelwayo: Restructuring and consolidating from thesis into a research article format, research review, proof reading, and additional literature review.
References
Bakana, S. 2015. Investigating and mitigating of electrical power losses within City Power distribution. Available at: https://www.ee.co.za/wp-content/uploads/2015/11/AMEU-Convention-2015-p12-20cont23.pdf. [Accessed on 21 January 2021]. [ Links ]
Boriratrit, S., Tepsiri, W., Krobnopparat, A. and Khunsaeng N. 2018. Forecasting and evaluation of electricity losses in Thailand via flower pollination extreme learning machine model Available at: https://www.researchgate.net/pub-lication/328460568_Forecasting_and_Evaluation_Electricity_Loss_in_Thailand_via_Flower_Pollination_Ex-treme_Learning_Machine_Model. [Accessed on 21 January 2021]. [ Links ]
Bua, F., Marra, A. and Baggini, A. 2016. Power transformer energy performance: Landscape of market surveillance testing avenues: Worldwide and EU Technical standard and legislative framework. In AEIT International Annual Conference (AEIT). Available at: https://intas-testing.eu/storage/app/media/AEIT2016-Baggini-Bua-FinalePAper.pdf, [Accessed 24 July 2019]. [ Links ]
City of Tshwane. 2018. After almost two years the capital is in a good state. Available at: http://www.tshwane.gov.za/sites/about_tshwane/CityManagement/State%20of%20The%20City%20Ad-dresses/Mayor%20Msimanga%20SoCA2018%20(EdIS%2BML%2BVG).pdf. [Accessed 6 June 2018]. [ Links ]
Cotton, M. and Devine-Wright, P. 2012. Making electricity networks 'visible': Industry actor representations of 'publics' and public engagement in infrastructure planning. Public Understanding of Science, 21(1):17-35. [ Links ]
Council of European Energy Regulators. (2017). CEER report on power losses. Available at: https://www.ceer.eu/documents/104400/-/-/09ecee88-e877-3305-6767-e75404637087. [Accessed 6 January 2019]. [ Links ]
Das, A. and McFarlane, A. 2019. Nonlinear dynamics of electric power losses, electricity consumption, and GSP in Jamaica, Energy Economics, 84: 1-10. [ Links ]
Deloittte. 2017. Prospectus: Long-term loss reduction plan. Available at: https://www.usaid.gov/sites/default/files/documents/1865/Prospectus_Long_Term_Loss_Reduction_Plan_2017_10_21_FINAL.PDF. [Accessed 7 January 2019]. [ Links ]
Eberhard, A 2019. The municipal electricity industry - key dynamics with a focus on the metros. Discussion paper. Available at: https://csp.treasury.gov.za/Resource%20_Centre/Conferences/Documents/CSP%20Tools/Economic%20Development/Muni%20Elec%20Industry%20DP.pdf. [Accessed on 17 January 2021]. [ Links ]
Energy Research Centre, Centre for Scientific and Industrial Research and International Food Policy and Research Institute. 2017. The developing energy landscape in South Africa: Technical Report. Energy Research Centre, University of Cape Town. [ Links ]
Eskom. 2015. Eskom financial. Available at: http://www.eskom.co.za/IR2015/Documents/EskomAFS2015.pdf. [Accessed 22 February 2019]. [ Links ]
Expósito, A.G., Conejo, A.J. and Canizares, C. 2016. Electric energy systems: analysis and operation. CRC press, New York. [ Links ]
Forum for Energy Regulators (2016). Best practices and strategies for distribution loss reduction - Final report. Available at: http://www.forumofregulators.gov.in/data/study/11.pdf. [Accessed on 23 November 2021]. [ Links ]
Grasso, C017. The dark side of power: Corruption and bribery within the energy sector. Available at: https://www.researchgate.net/publication/322097332_The _Dark_ Side_of_Power_ Corruption_and_Bribery_within_the_En-ergy_Sector> [Accessed 30 January 2021]. [ Links ]
Jiménez, R.A., Serebrisky, T. and Mercado Díaz, J.E. 2014. Power lost: Sizing electricity losses in transmission and distribution systems in Latin America and the Caribbean: Inter-American development Bank. Available from: https://publications.iadb.org/publications/english/document/Power-Lost-Sizing-Electricity-Losses-in-Transmission-and-Distribution-Systems-in-Latin-America-and-the-Caribbean.pdf. [Accessed on 23 November 2021]. [ Links ]
Kambule, N., Yessoufou, K., Nwulu, N. and Mbohwa, C. 2018. Exploring the driving factors of prepaid electricity meter rejection in the largest township of South Africa. Energy Policy, Vol 124(c): 199-205. [ Links ]
Louw, Q.E. 2019. The impact of non-technical losses: A South African perspective compared to global trends. CA South African Revenue Protection Association conference paper. available from https://www.researchgate.net/publication/335337986_The_Impact_of_Non-Technical_losses_A_South_African_perspective_compared_to_global_trends. [ Accessed on 17 January 2021]. [ Links ]
Fourie, L.L.P. 2010. Revenue protection as part of utility financial sustainability. Available at https://www.ee.co.za/wp-content/uploads/legacy/Energize%20_%202010/06_TT_03_Revenue.pdf. [Accessed 30 June 2018]. [ Links ]
Luo, L., Cheng, X., Zong, X., WeI, W. and Wang, C. 2015. Research on transmission line loss and carrying current based on temperature power flow model. In 3rd International Conference on Mechanical Engineering and Intelligent Systems, available from: https://www.atlantis-press.com/article/25837253.pdf. [ Accessed on 23 November 2021 [ Links ]
Meyer, M. 2016, Talent management system standard element, South African Board of Peoples Practices Available from http://www.saodn.net/wpcontent/uploads/2013/07/HRMSS-Version-6-January-2016.pdf.[ Accessed on 23 November 2021]. [ Links ]
Navani, J.P., Sharma, N.K. and Sapra, S. (2012). Technical and non-technical losses in power system and its economic consequence in Indian economy. International Journal of Electronics and Computer Science Engineering, 1(2): 757761. [ Links ]
Ndungu, C., Nderu, J., Ngoo, L. and Hinga, P.(2017). A study of the root causes of high failure rate of distribution transformer: A case study. International Journal of Engineering and Science, 6(2): 14-18. [ Links ]
Negadaev, V.A. 2018. Algorithms for building distribution networks of electricity supply, reducing losses of electricity . Available from https://www.researchgate.net/publication/326576188_Algorithms_for_building_distribution_net-works_of_electricity_supply_reducing_losses_of_electricity. [Accessed on 21 January 2021]. [ Links ]
Newbery, D. and Eberhard, A. 2008. South African Network Infrastructure Review: Electricity, available from: https://www.gsb.uct.ac.za/files/saelectricitypaper08.pdf. [Accessed on 23 November 2021]. [ Links ]
Jiguarmar, J. 2014. Total losses in power distribution and transmission lines (Part 2), available from: https://electrical-engineering-portal.com/total-losses-in-power-distribution-and-transmission-lines-2.[ Accessed on 23 November 2021]. [ Links ]
Ramos, C.C.O., de Sousa, A.N., Papa, J.P. and Falcao, A.X. 2011. A new approach for nontechnical losses detection based on optimum-path forest: EEE Transactions on Power Systems, 26(1): 181-189. [ Links ]
Refou, O., Alsafasfeh, Q. and Alsoud, M. 2015. Evaluation of electric energy losses in southern governorates of Jordan distribution electric system. International Journal of Energy Engineering 5(2): 25-33. [ Links ]
Rengarajan, S. and Loganathan, S. (2012). Power theft prevention and power quality. International Journal of Electrical and Electronics Engineering, Vol 1(3), 106-110 [ Links ]
Saunders, M.N.K., Lewis, P. and Thornhill, A. 2016. Research methodsfor business students. (5th ed.). Harlow, United Kingdom: FT Prentice Hall. [ Links ]
South African Revenue Protection Association (SARPRA). 2018. Revenue protection initiatives to reduce losses and improve municipal cash flow. Available from https://www.salga.org.za/SALGA%20Municipal%20Managers%20Forum%20Web/Documents/Day%202/SARPA%20SALGA%20Municipal%20Managers%20Forum%20Mbombela.pdf [ Links ]
Van der Laan, D.C., Lu, X.F. and Goodrich, L.F. 2011. Compact GdBa2Cu3O7-5 coated conductor cables for electric power transmission and magnet applications: Superconductor Science and Technology 24(4). [ Links ]
Yukl, Y. 2013. Leadership in Organizations. Pearson Education, Albany Council of European Energy Regulators. (2017). CEER Report on Power Losses. [Online] Available at: https://www.ceer.eu/documents/104400/-/-/09ecee88-e877-3305-6767-e75404637087. [Accessed 6 January 2019]. [ Links ]
* Corresponding author: Tel.: +27 (0)11 400 4196; email: bonganikhonjelwayo@gmail.com

