


Services on Demand
Article
 English (pdf)
 Article in xml format
 Article references
Indicators

Related links
-
 Cited by Google
 -
 Similars in Google
Share

 Permalink
Journal of Energy in Southern Africa
On-line version ISSN 2413-3051
Print version ISSN 1021-447X
J. energy South. Afr. vol.32 n.3 Cape Town Aug. 2021
http://dx.doi.org/10.17159/2413-3051/2021/v32i3a8852
ARTICLES
An empirical analysis of volatility in South African oil prices
Victor Mbua Mofema; Gisele Mah*
Department of Economics, Faculty of Economics and Management Science, North West University, Mafikeng, South Africa
ABSTRACT
Volatility of the oil price has been around since the 1970s and an understanding of how it evolves provides insight into solving macroeconomic challenges. The main objective of this study was to analyse the volatility of South African oil prices using quarterly time series data from 2000 to 2020. The effect of growth in gross domestic product per capita, interest rate, inflation and money supply growth on oil price changes was assessed. Generalised autoregressive conditional heteroscedasticity (GARCH) was estimated and diagnostic tests -namely ARCH, normality and autocorrelation tests - were conducted. The GARCH (1,2) model was the best fit, based on the Alkaike information criterion. The result revealed that interest rates and money supply growth have a significant positive effect on oil price changes in South Africa, while growth in GDP per capita and inflation has an insignificant impact. Past one and two-quarters' oil price volatility increases and decreases the current oil price volatility respectively. Based on the findings, a contractionary monetary policy is recommended in order to reduce the volatility of South African oil prices.
JEL CLASSIFICATION: Q41, Q43, Q31, C22
Keywords: economic growth, interest rate, consumer price index, money supply, GARCH
1. Background of the study
Oil price volatility and its effects on macroeconomics have sparked heated debate among economists and policymakers. Some argue that oil volatility has a negative effect on macroeconomic variables (Oriakhi & Osaze, 2013; Bashar et al., 2013; Ji and Fan, 2012; Arouri and Nguyen, 2010; Badeeb, and Lean, 2018; Arouri et al., 2012; Diaz et al., 2016). Other researchers, including Fang and You (2014), Wang et al. (2013), and Fine (2018), claimed that oil prices improve national growth through macroeconomic variables. The former group argued that if the country is an oil importer the price of oil will have a negative impact on inflation, money supply, exchange rate, and a variety of other macroeconomic variables.
Oil markets have been subjected to extreme risk in recent decades as a result of global warming, continuous fluctuations in the global economy, geopolitical insecurity, and financial market disorder (Ju et al., 2016). Oil prices have shown signs of volatility since the 1970s, with worsening volatility causing unpredictable consequences. More recently, volatility was observed during the financial crises from 2007-2008 and at the start of July 2014 (Nwanna & Chinwudu, 2016). In South Africa oil price volatility has been exhibited since 2012. In that year the price averaged 3.9% of oil price volatility, in 2013 it was 1.97%, in 2014 it was -3.45%, in 2015 it was -1.41%, in 2016 it was 3%, in 2017 it was 1.13%, then it fell again in 2018 to -0.02% (World Bank, 2019). The turbulence in the oil market leads to oil price instability, which may unfavourably affect the South African economy.
The literature provides evidence that oil price volatility has diverse impacts on the trade balance of both exporting and importing countries, depending on their characteristics (Kilian, 2010). Even within Africa, where oil export drives economies such as Nigeria's, Oyeyemi (2013) showed that a small negative oil price shock on the Nigerian economy during 1979 to 2010 had long-term negative effects on the country's growth. Nonetheless, oil exporters over the years have had little positive impact on balance of trade as a result of the intensive demand. However, Kuboniwa's (2014) study on oil export to Pacific-Rim economies found that oil prices showed high positive impact on terms of trade in Russia and Malaysia, but Indonesia had a negative relationship with the oil price.
The majority of studies on oil prices, including those of Akinleye (2017), El-Anshasy et al. (2017b) and Herrera et al. (2018) concurred that volatility is a key challenge for economies. 32.9% of global energy consumption is from oil, and therefore any change in oil supply and demand side can provoke large movement in the prices of energy sources in general (Dudley Bob, 2016). Moreover, Neto et al. (2014) and Toman and Jemelkova (2003) provided a strong argument that oil usage contributes to growth that eventually leads to higher consumption of energy and increases volatility of oil price, which consequently affects growth negatively in South Africa. Although the government of South Africa regulates (subsidies) the price of petrol and also tries to shift focus to different sources of energy, Nkomo (2006) argued that even with oil price subsidies and control put in place, the economy is still affected by oil price shocks.
There have been several studies that assess the impact of oil price shock on the South African economy, using various methods. Fofana et al. (2009) concluded that oil price increases have a negative impact on the economy, given its dependency on imported oil. Nkomo (2006) suggested that oil price shocks tend to increase the total import bill for a country, largely because of the huge increase in the cost of oil and petroleum products, with have adverse effects on the economy through falling GDP. In the same vein, Wakeford (2006) concluded that the South African economy is affected by an increase in oil prices, even thou the impact depends on the period of the shock in oil price. Failure to understand the dynamics of oil price volatility may hamper South African government initiatives such as the National Development Plan 2030. The relationship of oil price volatility and macroeconomic variables is key in managing the effects of oil price shocks. Therefore, this study endeavours to establish the relationship between the volatility of oil prices and macroeconomic variables, namely economic growth, interest rate, inflation and money supply.
The rest of the article is structured as follows: section 2 is a literature review, section 3 looks at the methodology, section 4 presents and interprets the results, and section 5 draws conclusions and makes recommendations.
2. Literature review
This section reviews studies that modelled the relationship between oil price volatility and macroeconomic variables that include economic growth, interest rate, inflation and money supply. Xiang et al. (2021) examined the link between oil price volatility and inflation in China using a wavelet approach and observed a positive relationship between oil price volatility and inflation in the short term, and the results suggested that inflation pressure in China amplifies swings in oil prices after controlling for the effects of money supply.
Urom et al. (2021) studied the connectedness of oil shocks and interest rates for period 1999 to 2018 in the United States of America, the euro zone and Asia. The time varying parameter vector autogressive (TVP-VAR) was employed and the results revealed that there was a time varying comovement of oil shocks and interest rates which is affected by stableness of the political and financial landscape.
Köse and Ünal (2021) investigated the impact of oil price and oil price volatility on inflation employing a structural vector autoregressive (SVAR) approach in the Turkish economy for the period 1988 to 2019. The finding was that oil price and oil price volatility have a significant positive effect on inflation. It was concluded that oil price and oil price volatility are a major concern for policy makers, as their effects cannot be addressed by local economic policies. However, it was recommended that inflation could be reduced by formulating policies that curb demand for oil.
Jiang et al. (2021) examined the effect of oil shocks on credit spreads in the USA for 1974-2018, using SVAR techniques. The results suggested that information from oil prices provides insight into USA credit spreads. In particular, it was revealed that demand-induced oil shocks have a negative effect on credit spreads, while the supply oil shocks have no impact on credit spreads. A fluctuation of the oil shocks' impact on credit spreads is dependent on economic cycles.
Maheu et al. (2020) analysed the relationship between volatility of economic growth and oil shocks in the USA from 1974 to 2018. It was found that economic growth volatility responds to changes in oil prices. The autoregressive (AR) model and generalised autoregressive conditional heteroscedasticity (GARCH) model were used to estimate the link between volatility in economic growth and oil shocks.
Khalfaoui et al. (2020) assessed the nexus between money demand and oil prices including macroeconomic variables, namely exchange rate, interest rate, inflation and real GDP, in India form 1994 to 2017. The wavelet approach was employed in the analysis. Results demonstrated that there was a bi-directional causal link between money demand and oil prices, and macroecomic variables. Money demand has a higher interdependecy with real GDP and lower interdependency with exchange rate, interest rate and oil prices.
Hathroubi and Aloui (2020) highlighted that oil prices and economic growth rate as proxied by GDP had a negative relationship in Saudi Arabia for the years 1970 to 2016. The wavelet approach was applied in partial and multiple form. The study recommended that policy markers should take into account the coherency between oil prices and GDP when working on the national budget.
Baek and Miljkovic (2018) modelled the effects of USA money supply shocks on oil prices. The study applied a cointegrated vector autoregression (CVAR) approach for data in the period 1980-2014. The results illustrated that money supply shocks has a positive impact on oil prices in the short-run. However, in the long-run an insignificant effect of money supply on oil prices was observed.
Chatziantoniou et al. (2021) investigated the determinants of oil price volatity using the TVP-VAR model for the years 1990 to 2019. The independent variables included oil supply, global economic activity, global oil inventory, financial markets volatility, interest rates and exchange rates. Interest rate shocks causes the volatilty of oil prices to increase whilst global economic activity shocks lowers oil price volatility.
Brown and Yücel (2002) discussed the impact of monetary policy on oil prices, giving more detail. Inflation is another transmission channel that establishes a relationship between domestic inflation and oil prices. When the observed inflation is caused by oil price-increased cost shocks, a contractionary monetary policy can deteriorate the long-term output by an increased interest rate and decreased investment (Tang, 2009). If the prices and incomes are allowed to change over time, the attempt to spend the excess will result in a rise in total spending and receipts, but if the prices are fixed by the government an increase in spending will lead to increases in goods and services or produce shortages (Friedman, 2016).
Zhao (2010) indicated that there was an association between GDP and prices of oil in the Chinese market from 2001 to 2009. Furthermore, He et al. (2010) found a long-run association between growth and future prices of crude oil prices and concluded that the relationship between oil price and growth can be classified under either a positive or a negative relationship depending on the energy intensity.
Kilian (2010) asserted that oil price affects both the exporter and importer negatively because of its volatile nature, which will undermine economic growth and ultimately investment. The degree to which oil price shock affects GDP in the Organisation for Economic Co-operation and Development (OECD) countries is affected by oil price fluctuations, especially in the United States. The responses to shocks in oil prices across various monetary policies that interact with the shock are likely to cause undesirable results, such as inflation (Kilian, 2010).
The oil price has an influence on growth in the world economy due to limited purchasing power for oil importers, as any increase in exporter oil price will slow development of trade (Malik, 2008). Employment, rising inflation, and the exchange rate are negatively affected by increasing oil prices which slow down the economy. Nyangarika et al. (2018) examined the relationship between oil prices and GDP in major oil-producing nations and observed a positive linkage; they recommended that the development of oil substitutes would provide a greater chance for reforming economies.
Gupta and Modise (2013) assessed the impact in the oil price shocks stock returns in the South African economy. The result demonstrated that oil supply stun has a short critical effect, only in the growth rate, which negatively distresses the growth rate in South Africa, although its impact on other factors is irrelevant. Supply disturbances result in an increment in the household dissaving rate, with no reaction from the money related policy.
Ji and Fan (2012) examined how volatility in the price of oil affects non-energy commodity markets. The market of crude oil shows a major volatility spill over impact on non-energy commodity markets, which shows the importance of the oil price on other markets. Similarly, El-Anshasy et al. (2017) concluded that volatility in prices of oil and growth respond differently depending on whether the country is an importer or exporter. An oil price increase will lead to an increase in growth since the balance of payment shows a positive balance. It was also stressed by Le and Chang (2013) that oil exporters experience a positive balance of trade when oil prices are high, but importers may face a deficit in trade when the global oil price rises, depending on the nature of oil demand.
This study focuses on an examination of the relationship between oil price volatility and macroeconomic independent variables, namely economic growth, interest rate, inflation and money supply in South Africa.
3. Methodology
The study employed the GARCH model, which is best suited for modelling volatility (Marozva & Magwedere, 2017). Based on the Kharbach and Chfadi (2018) approach, the adopted model is modified to achieve the objective of analysing volatility of South African oil prices. The equation is formulated as follows:

where OP is the percentage change in logarithm oil prices, GDP is growth rate of gross domestic product, INT is the interest rate, CPI is the consumer price index, and M3 is money supply growth. Oil price in this study is measured in US dollars per barrel for Brent crude oil, and this was chosen because South Africa imports crude oil from Brent. Brent crude refer to any or all of the components of the Brent Complex, a physically and financially traded oil market based around the North Sea of North-west Europe; colloquially, Brent crude usually refers to the price of the Brent crude oil.
The model is econometrical, expressed in time series as:
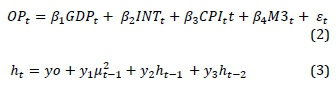
where ß1represents the parameters to be estimated, t refers to the time span measured in this study, etrefers to the white noise, and L represents the natural logarithm. Variables are logged based on the fact that it helps the variable to be in the same unit of measurement, and therefore minimises heteroscedasticity in the model. The volatility of the oil price at time t is denoted by ht. μtrepresents changes in the oil price at each time and follows a standard distribution of zero mean and variance that depends on time. y0 is the average variance rate of oil price in the long run, y1is a measure of the sensitivity of oil price volatility to the last change in the oil price, y2 and y3 are measures of the sensitivity of oil price variation values preceding the first and second periods respectively. To ensure the GARCH model is stationary in covariance y0> 0,y1 > 0,y2 > 0 and y1 + y2 < 1.
Quarterly data is used in this study, from 2000 to 2020, for the following variables: OP, GDP, INT, CPI and M3. OP is derived from data for oil prices measured in dollars per barrel collected from the Texas intermediate index. GDP and INT were collected from the Reserve Bank in South Africa, CPI and M3 were collected from the Statistical South African database.
3.1 Testing for unit roots
The Augmented Dickey Fuller (ADF) and Philips-Peron (PP) tests are used to test for unit root and to show the order of integration of the variables. A time series is stationary if the mean, variance, and autocorrelations are constant over time. The stationarity test equation accounts for a lower level of autocorrelation than actually exists in the estimation process. The PP test automatically corrects this error. Another advantage of the PP test is that it is resilient to common configurations of heteroscedasticity.
3.2 GARCH
The GARCH model is an extension of the ARCH model. Its main advantage is that it has fewer parameters and performs better than the ARCH model. Therefore, it is important to first summarise the original method ARCH model before explaining its extension. The ARCH (1) model was first developed by Engle (1982) and is given as follows:

The fault in the ARCH model causes it to be adjusted as the GARCH model. The fault is that variance in the next period only relies on the square residual of the last period, meaning the crisis that exists in a larger residual would have a variety of persistence that we observe after the actual crisis (Peng & Yao, 2003).
This study applies the GARCH model with the aim of capturing the changes in oil prices in South Africa. In finance and econometrics, a variable is judged to be volatile if its standard mean and variance are not constant over time and GARCH models can easily handle heteroscedasticity (Fine, 2018). Conditional variance is defined as a linear function of past square errors and lagged conditional variance, and in a financial time series this occurs when the energy price is not normally distributed (Ratti & Hasan, 2013). The standard deviation is used to measure the volatility of oil prices.
3.3 ARCH test
Engle (1982) pioneered the ARCH effects test. The null hypothesis of no ARCH effects in squared residuals from Equation 3 is tested. The ARCH test is a joint test that tests for significance of slope coefficients in the regression. ARCH jointly tests for the significance of coefficients in the GARCH model in Equation 3. The ARCH test statistic follows a Chisquare distribution.
3.4 Autocorrelation test
The Ljung and Box (LB) tests for the presence of autocorrelation in the residuals and squared residuals (Ljung & Box, 1978). The LB test is given by:
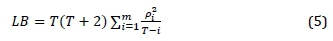
where pi2 is the sample autocorrelation. The null hypothesis is that there is no autocorrelation and the LB test statistics follow a Chi-square distribution.
4. Results and discussion
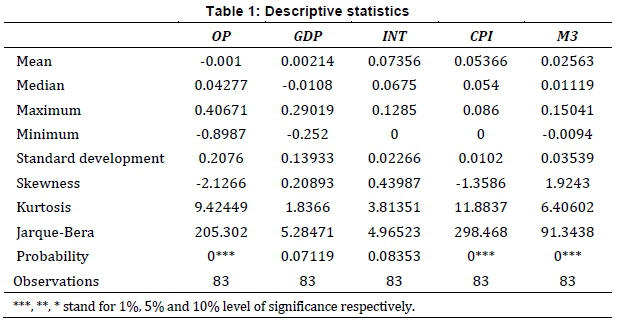
The descriptive statistics are presented in Table 1. The average rates for GDP, INT, CPI and M3 are positive, while for OP is negative. The GDP and INT series are normally distributed and OP, CPI and M3 are non-normal. The kurtosis for OP, INT, CPI and M3 are leptokurtic and for GDP it is platykurtic. There is negative skewness for OP and CPI, whereas GDP, INT and M3 have positive skewness.
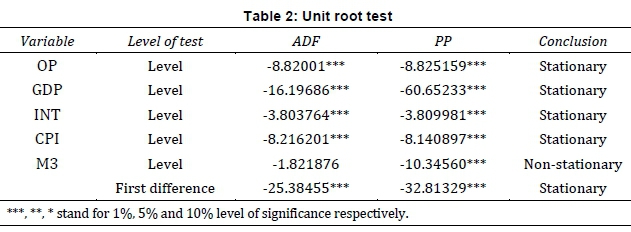
Table 2 presents the results of the unit roots using ADF and PP tests for the variables. The variables were tested for unit root under the assumption of coefficient without trend. Table 2 shows that oil price changes, growth in GDP, interest rate and inflation are stationary for both the ADF and PP tests at 1% level of significance. However, for money supply growth there is non-stationarity at level whilst at first difference stationarity is found in both the ADF and PP tests. We can proceed to the unit root test in order to determine the order of integration.
4.1 GARCH
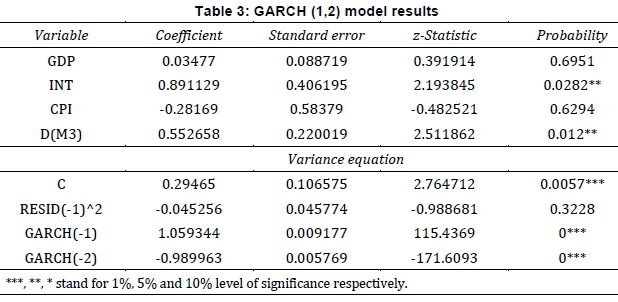
To determine the order of the GARCH model, various models for orders 1 to 3 were estimated. The Akaike information criterion (AIC) was employed to check for the best model - that which had the lowest value (Gujarati & Porter, 2009). The models were estimated with normal and student-t distributed errors. The AIC criteria preferred the GARCH (1,2) model for modelling the volatility of South Africa oil prices and the results are shown in Table 3.
Table 3 indicates that oil price changes are highly volatile in the 1st quarter, since the summation of residuals and GARCH (-1) are more than 1. In the 2nd quarter, there is low volatility, since the summation of residuals, GARCH(-1) and GARCH(-2) are less than 1. There is evidence of volatility persistence as highlighted by the significance of the 1st and 2nd quarter volatility from the previous period. The 1st and 2nd quarter volatility has a negative effect on the current volatility of oil prices.
Looking at the mean equation, it was observed that growth in GDP per capita has an insignificant impact on oil price changes since the probability value of 0.6951 is more than the 0.05 level of significance. These results oppose the findings of Rahman and Serletis (2010) that GDP and oil price volatility show significant positive with GDP in Nigeria. This contradicts the expectations that oil price shocks tend to lower real GDP (Gordon, 1989) and impact significantly on it (Farzanegan & Markwardt, 2007).
Interest rate showed a significant positive effect on oil price changes. Holding other things constant, a unit increase in interest rates will result in a 0.891129 unit increase in oil prices in South Africa. The findings are in line with Chatziantoniou et al. (2021), who demonstrated a positive impact of interest rates on oil price changes. However, theoretically it is expected that an increase in interest rates as a result of a contractionary monetary policy can deteriorate the long-term output and consequently decreased investment (Tang et al., 2009).
Inflation as measured by CPI has an insignificant effect on the volatility of South African oil prices, since the probability of 0.6294 is above the threshold of 0.05 level of significance. The present findings are inconsistent with those of Qianqian (2011) and Mpofu (2011), who observed that inflation impacts on oil prices, which in turn affect the real economy by raising interest rates.
Based on findings, money supply growth has a significant positive effect on oil price changes in South Africa. A unit change in money supply will result in 0.552658 unit changes in oil prices. Our results confirms observations by Qianqian (2011) and Akpan (2009) of a positive relationship between money supply and oil price changes. In line with our results, Baek and Miljkovic (2018) demostrated a positive impact of money supply on oil prices in the short-run.
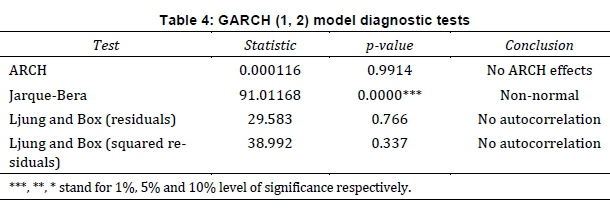
Table 4 highlights findings for the GARCH (1, 2) model diagnostic. The p-value for the ARCH test is more than 0.05, showing that there are no ARCH effects since they are incorporated in the GARCH model. The Jarque-Bera test of normality is significant and the residuals are not normal; hence this provided justification for using the student-t distributed errors. The tests for autocorrelation in both residuals and squared residuals are insignificant, based on the LB. Diagnostic tests demonstrated the robustness of the GARCH (1,2) model employed.
5. Conclusions and recommendations
The GARCH model was used to analyse volatility in South African oil prices for the years 2000 to 2020. The findings indicate a positive impact of money supply growth and interest rates on oil price changes. Inflation and growth in GDP have an insignificant effect on oil price volatility in South Africa. Volatility from past first quarter and second quarter periods has positive and negative effects on current oil price volatility in South Africa respectively.
Based on the findings, it is recommended that government monitor past oil price volatility when planning national budgets. The monetary authorities should implement a contractionary monetary policy to reduce the volatility of oil prices in South Africa. Such a policy might take the form of issuing government bonds as a way of mopping up excess liquidity in the economy.
Author roles
V. M. Mofema did the background, literature review, part of the abstract and part of the conclusion.
G. Mah Supervised the first author in undertaking the research, did the methodology, results, part of the abstract and part of the conclusion.
References
Akinleye, S.O. 2017. Oil price volatility effect on infrastructure spending in Nigeria. OPEC Energy Review, 41(1):71-90. [ Links ]
Akpan, E.O. 2009. Oil price shocks and Nigeria's Macroeconomy. In. A Paper Presented at the Annual Conference of CSAE Conference, Economic Development in Africa, March. pp. 22-24. [ Links ]
Arouri, M.E.H. & Nguyen, D.K. 2010. Oil prices, stock markets and portfolio investment: Evidence from sector analysis in Europe over the last decade. Energy policy, 38(8):4528-4539. [ Links ]
Arouri, M.E.H., Jouini, J. & Nguyen, D.K. 2012. On the impacts of oil price fluctuations on European equity markets: Volatility spillover and hedging effectiveness. Energy Economics, 34(2):611-617. [ Links ]
Badeeb, R.A. & Lean, H.H. 2018. Asymmetric impact of oil price on Islamic sectoral stocks. Energy Economics, 71:128139. [ Links ]
Baek, J. & Miljkovic, D. 2018. Monetary policy and overshooting of oil prices in an open economy. The Quarterly Review of Economics and Finance, 70:1-5. [ Links ]
Bashar, O.H., Wadud, I.M. & Ahmed, H.J.A. 2013. Oil price uncertainty, monetary policy and the macroeconomy: The Canadian perspective. Economic Modelling, 35:249-259. [ Links ]
Brown, S.P. & Yücel, M.K. 2002. Energy prices and aggregate economic activity: an interpretative survey. The Quarterly Review of Economics and Finance, 42(2):193-208. [ Links ]
Chatziantoniou, I., Filippidis, M., Filis, G. & Gabauer, D. 2021. A closer look into the global determinants of oil price volatility. Energy Economics, 95:105092. [ Links ]
Diaz, E.M., Molero, J.C. & de Gracia, F.P. 2016. Oil price volatility and stock returns in the G7 economies. Energy Economics, 54:417-430. [ Links ]
Dudley Bob. 2016. BP statistical review of world energy Edition: Outlook to 2035. British Petroleum Statistics: London, UK, [ Links ]
El-Anshasy, A., Mohaddes, K. & Nugent, J.B. 2017. Oil, Volatility and Institutions: Cross-Country Evidence from Major Oil Producers. [ Links ]
Engle, R.F. 1982. Autoregressive conditional heteroscedasticity with estimates of the variance of United Kingdom inflation. Econometrica: Journal of the econometric society':987-1007. [ Links ]
Fang, C.-R. & You, S.-Y. 2014. The impact of oil price shocks on the large emerging countries' stock prices: Evidence from China, India and Russia. International Review of Economics & Finance, 29:330-338. [ Links ]
Fine, B. 2018. The political economy of South Africa: From minerals-energy complex to industrialisation. Routledge. [ Links ]
Fofana, I., Chitiga, M. & Mabugu, R. 2009. Oil prices and the South African economy: A macro-meso-micro analysis. Energy policy, 37(12):5509-5518. [ Links ]
Gujarati, D.N. & Porter, D.C. 2009. Causality in economics: The Granger causality test. Basic Econometrics (Fifth international ed.). New York: McGraw-Hill, 652, [ Links ]
Gupta, R. & Modise, M.P. 2013. Does the source of oil price shocks matter for South African stock returns? A structural VAR approach. Energy Economics, 40:825-831. [ Links ]
Hathroubi, S. & Aloui, C. 2020. Oil price dynamics and fiscal policy cyclicality in Saudi Arabia: New evidence from partial and multiple wavelet coherences. The Quarterly Review of Economics and Finance, [ Links ]
He, Y., Zhang, S., Yang, L., Wang, Y. & Wang, J. 2010. Economic analysis of coal price-electricity price adjustment in China based on the CGE model. Energy Policy, 38(11):6629-6637. [ Links ]
Herrera, A.M., Hu, L. & Pastor, D. 2018. Forecasting crude oil price volatility. International Journal of Forecasting, 34(4):622-635. [ Links ]
Ji, Q. & Fan, Y. 2012. How does oil price volatility affect non-energy commodity markets? Applied Energy, 89(1):273-280. [ Links ]
Jiang, Y., Liu, C. & Xie, R. 2021. Oil price shocks and credit spread: Structural effect and dynamic spillover. The North American Journal of Economics and Finance, 58:101467. [ Links ]
Ju, K., Su, B., Zhou, D., Wu, J. & Liu, L. 2016. Macroeconomic performance of oil price shocks: Outlier evidence from nineteen major oil-related countries/regions. Energy Economics, 60:325-332. [ Links ]
Khalfaoui, R., Padhan, H., Tiwari, A.K. & Hammoudeh, S. 2020. Understanding the time-frequency dynamics of money demand, oil prices and macroeconomic variables: The case of India. Resources Policy, 68:101743. [ Links ]
Kharbach, M. & Chfadi, T. 2018. Oil prices and electricity production in Morocco. Energy strategy reviews, 22:320-324. [ Links ]
Kilian, L. 2010. Oil price volatility: Origins and effects. [ Links ]
Köse, N. & Ünal, E. 2021. The effects of the oil price and oil price volatility on inflation in Turkey. Energy, 226:120392. [ Links ]
Kuboniwa, M. 2014. A comparative analysis of the impact of oil prices on oil-rich emerging economies in the Pacific Rim. Journal of Comparative Economics, 42(2):328-339. [ Links ]
Le, T.-H. & Chang, Y. 2013. Oil price shocks and trade imbalances. Energy Economics, 36:78-96. [ Links ]
Maheu, J.M., Song, Y. & Yang, Q. 2020. Oil price shocks and economic growth: The volatility link. International Journal of Forecasting, 36(2):570-587. [ Links ]
Malik, A. 2008. Crude oil price, monetary policy and output: The case of Pakistan. The Pakistan Development Review:425-436. [ Links ]
Marozva, G. & Magwedere, M.R. 2017. Macroeconomic variables, leverage, stock returns and stock return volatility. Acta Universitatis Danubius. (Economica, 13(4), [ Links ]
Mpofu, R.T. 2011. Money supply, interest rate, exchange rate and oil price influence on inflation in South Africa. Corporate Ownership and Control, 8(3):594-605. [ Links ]
Naurin, A. & Qayyum, A. 2016. Impact of Oil Price and Its Volatility on CPI of Pakistan: Bivariate EGARCH Model. [ Links ]
Neto, A.B.F., Perobelli, F.S. & Bastos, S.Q. 2014. Comparing energy use structures: An input-output decomposition analysis of large economies. Energy Economics, 43:102-113. [ Links ]
Nkomo, J. 2006. Crude oil price movements and their impact on South Africa. Journal of Energy in Southern Africa, 17(4):25-32. [ Links ]
Nwanna, I.O. & Chinwudu, C.F. 2016. The effect of financial deepening on economic growth in Nigeria (1985-2014). Journal of Economics and Finance, 7(5):11-28. [ Links ]
Nyangarika, A.M., Mikhaylov, A.Y. & Tang, B.-j. 2018. Correlation of oil prices and gross domestic product in oil producing countries. International Journal of Energy Economics and Policy, 8(5):42-48. [ Links ]
Oriakhi, D. & Osaze, I.D. 2013. Oil price volatility and its consequences on the growth of the Nigerian economy: An examination (1970-2010). Asian economic and financial review, 3(5):683. [ Links ]
Oyeyemi, A.M. 2013. The growth implications of oil price shock in Nigeria. Journal of Emerging Trends in Economics and Management Sciences, 4(3):343-349. [ Links ]
Peng, L. & Yao, Q. 2003. Least absolute deviations estimation for ARCH and GARCH models. Biometrika, 90(4):967-975. [ Links ]
Qianqian, Z. 2011. The impact of international oil price fluctuation on China's economy. Energy Procedia, 5(5):1360-1364. [ Links ]
Ratti, R.A. & Hasan, M.Z. 2013. Oil price shocks and volatility in Australian stock returns. Economic Record, 89:67-83. [ Links ]
Tang, C.F. 2009. An examination of the government spending and economic growth nexus for Malaysia using the leveraged bootstrap simulation approach. Global Economic Review, 38(2):215-227. [ Links ]
Urom, C., Guesmi, K., Abid, I. & Dagher, L. 2021. Dynamic integration and transmission channels among interest rates and oil price shocks. The Quarterly Review of Economics and Finance, [ Links ]
Wakeford, J. 2006. The impact of oil price shocks on the South African macroeconomy: History and prospects. In. Accelerated and Shared Growth in South Africa: Determinants, Constraints and Opportunities,(18-20 October 2006). The Birchwood Hotel and Conference Centre, Johannesburg, South Africa. [ Links ]
Wang, Y., Wu, C. & Yang, L. 2013. Oil price shocks and stock market activities: Evidence from oil-importing and oil-exporting countries. Journal of Comparative economics, 41(4):1220-1239. [ Links ]
Xiang, L., Zhang, H., Gao, K. & Xiao, Z. 2021. Oil volatility-inflation pass through in China: Evidence from wavelet analysis. Energy Reports, 7:2165-2177. [ Links ]
* Corresponding author: Tel.: +27 (0)18 389 2472; email: Gisele.Mah@nwu.ac.za.

