


Services on Demand
Article
 English (pdf)
 Article in xml format
 Article references
Indicators

Related links
-
 Cited by Google
 -
 Similars in Google
Share

 Permalink
Journal of Energy in Southern Africa
On-line version ISSN 2413-3051
Print version ISSN 1021-447X
J. energy South. Afr. vol.32 n.3 Cape Town Aug. 2021
http://dx.doi.org/10.17159/2413-3051/2021/v32i3a7781
ARTICLES
Factors influencing the use of firewood post-electrification in rural South Africa: The case of Ga-Malahlela village
Mahlodi Esther Masekela*; Khomotso Semenya
College of Agriculture and Environmental Sciences, University of South Africa, Science Campus, Florida Park, South Africa
ABSTRACT
Despite improved electrification rates and several government policies introduced to encourage rural households to switch from traditional to modern fuels, most South African households still rely on firewood for their energy needs. This study sought to assess the factors that influence the use of firewood in Ga-Malahlela village in the Limpopo province. To this end, a structured questionnaire was administered to 67 households. Microsoft Excel and the Statistical Package for Social Sciences were used to code and log in the data. The chi-square test was used to determine the relationship between the choice of energy source(s) and socio-economic factors. It was established that firewood was still widely used: by 61 % of the participants for cooking, by 64% for space heating, and by 46% for water heating. For lighting, electricity was used by 98.5% of the participants, while liquefied petroleum gas was used by 1.5%. The dependency on firewood was mainly due to the socio-economic status of the surveyed households, which included income, education level, household size, and preference. Rural firewood reliance continues, due to socio-economic factors such as indigence, preference, and the inaccessibility of services like free basic electricity. It is therefore recommended that the Polokwane Local Municipality should play a part in assisting poor communities with cleaner, cost-effective fuel alternatives such as solar energy, biogas, and liquefied petroleum gas.
Keywords: electricity; energy sources; firewood; free basic electricity; household energy use; rural households; socio-economic factors
1. Introduction
This paper describes how certain factors (energy access, energy subsidy access, age, sex, education level, marital status, household size, household income and employment status) influence the use of firewood as an energy source in rural households in South Africa following the national electrification programme and the introduction of free basic electricity (FBE). The South African government has worked tirelessly to ensure that rural areas are electrified. Social services such as FBE and social grants were introduced to relieve poor households of the burden of high energy costs. However, households turned to using firewood to supplement or ease that burden, regardless of the free social services. This raises questions as to why households turn to firewood for specific domestic energy needs even when they have access to electricity and social services.
Firewood remains the main source of energy in rural Africa, as most households cannot afford other forms of energy for their basic household energy needs (Boudreau et al., 2005; Shackleton et al., 2007). About three billion people in middle-income countries depend on firewood and coal for domestic energy needs (World Health Organization, 2014). Research has shown that the use of firewood is prevalent in, for example, the following countries: Ecuador (63.2%), Brazil (52.9%) and Mexico (24.0%). In Vietnam and Nepal 60% and 32% of the households use straw and leaves respectively (Heltberg, 2003; Jingchao & Kotani, 2010; International Agency for Research on Cancer, 2010). In sub-Saharan Africa (SSA) both rural and urban households use firewood for household energy needs such as cooking and water heating (Howells et al., 2005; Bailis et al, 2007; Mekonnen & Kohlin, 2009).
The Energy Access Outlook 2017 indicated that over 2.8 billion people (38% of the global populace) lacked access to clean energy sources for cooking, especially in SSA and developing Asia (International Energy Agency, 2017). However, the use of biomass for cooking is relatively higher in developing Asia (80%) than in SSA, because the population in SSA is much lower than that of developing Asia (International Energy Agency, 2017). SSA does accounts for the world's most elevated local per capita firewood energy use, with a mean usage of 0.69 cubic metres per year in 2011 as opposed to the worldwide mean of 0.27 (Iiyama et al., 2 014). About 93% of households in SSA rely on firewood for their day-to-day cooking needs and it continues to be the preferred choice in rural areas (Girard, 2002; Arnold et al., 2003; Bailis et al., 2005; Mwampamba et al., 2013; Iiyama et al., 2014). Except for South Africa, where coal is a significant fuel. SSA has the largest proportion of its populace (77% in 2015) depending on conventional fuels such as coal and firewood (International Energy Agency, 2017; International Energy Agency, 2010).
An accurate assessment of residential firewood use in South Africa remains unknown. However, Shackleton and Shackleton (2004) estimated household firewood consumption at an average of 5.3 tonnes of firewood per year. Residential firewood consumption is estimated at 86 petajoules, which is equivalent to 7 Megatonnes of wood per year. These figures imply that current firewood use is unsustainable because it is consumed quicker than it is replenished (Department of Energy, 2016). Approximately 31% of South Africans live in rural regions. Despite the increase in the electrification of South African rural households, firewood is still prominently used for cooking because of their inability to afford either the electricity costs or the appliances used for cooking, which correlates to poverty (Prasad & Visagie, 2005). The International Energy Agency (2017) reported that there are various stages of clean cooking access among sub-Saharan African countries, depending on the availability of biomass and other energy alternatives as well as the state of development of the country. It also reported that only about 8% of South Africans depend on firewood for cooking. This was attributed to the high levels of electrification in the country, which accounted for the increase (50% in 2000 to 83% in 2016) in households that utilise electricity for cooking. However, research shows that rural electrification does not automatically replace firewood use to a significant degree (Prasad & Visagie, 2005).
Many factors influence firewood use within households. Several studies have analysed the link between the consumption of firewood and factors such as household income, climate, and family size (Kennes et al., 1984; Dunkerley et al, 1990; Mahapatra and Mitchell, 1999; Kituyi et al., 2001; Bhatt and Sachan, 2004; Johnson and Bryden, 2012; Onoja, 2012; San et al., 2012; Song et al., 2012; Rehnus et al., 2013; Ding et al., 2016; Semenya and Machete, 2019).
On a theoretical level, an investigation aimed at the complex and diverse comprehension of the energy ladder was made by Van der Kroon et al. (2011) and clearly demonstrated the influences of energy transition in the developing world. Systematically, with the conceptual deliberation, the determining factors of fuel use that are taken into consideration in the empirical literature are income, costs, household preferences, production characteristics and energy supply factors. A household's choice of fuel/energy source is therefore not only decided by economic factors. Various socio-demographic circumstances contribute to the choice, including the sex and the education level of the household leader/head (Farsi et al., 2005), while in several developing countries, fuel choice is determined by cultural beliefs and taste preferences (Arthur et al., 2012). Several other studies (Mekonnen and Kohlin, 2009; Hiemstra-Van der Horst and Hovorka, 2008; Kebede et al., 2 002; Uhunamure et al., 2017; Edwards and Langpap, 2005; Heltberg, 2004, 2005) analysed the determinants of household fuel choice in relation to the energy ladder theory. Every one of these studies suggests the inadequacy of the energy ladder concept in accounting for household energy use.
In South Africa, the household electrification rate in 2015 had risen to 85% through the activities of Eskom, the national energy utility, and government supportive policies (Department of Energy, 2015a). Despite such achievements and the introduction of social services such as FBE and social grants, the Department of Energy estimates that 40-49% of households are still energy-poor (Department of Energy, 2015b). Factors such as population growth, development activities and over-utilisation of firewood resources pose a challenge to the sustainability of firewood resources, which makes South Africa susceptible to energy poverty (Gaugris & Van Rooyen, 2010). The World Bank Group (2020) confirms that 55.5% of South African citizens live in poverty, which further translates to energy poverty. This is despite South Africa being a relatively multifaceted country with improvement in rural energy access (Shackleton & Shackleton, 2004).
Firewood, therefore, provides much-needed relief from energy poverty for rural South African households. This is despite its devastating impacts on the environment and socio-economic status of the country. It has been estimated that the rate at which firewood is consumed will increase, which will lead to further deforestation and environmental degradation (Arnold & Persson, 2003). However, despite the body of literature on factors that influence fuelwood use among households, the findings and conclusions are inconsistent: for example, the influence of socio-economic factors as the main determinants of firewood use and fuel substitution is still debated.
2. Materials and methods
Types and sources of data
Primary and secondary data was gathered. The primary data was collected through a self-administered household questionnaire and observations, and the secondary data was collected through relevant published and unpublished papers, dissertations, journals, websites, and books.
Sampling techniques and methods of data collection
This study was based on a descriptive survey research design. Qualitative and quantitative research methods were used, namely observation and a self-administered household questionnaire. The study area had 80 households (Polokwane Local Municipality, 2018). Of these, 67 were sampled using the Slovin formula (n = N / 1 + Ne2) for basic approximation (Ryan, 2013). Simple random sampling was used to administer the questionnaire.
Questionnaire structure
The questionnaire was divided into three sections: demographics (age, sex, gender, education level, income level, size of the family household, etc.); the energy sources used (firewood, electricity, paraffin, cow dung, etc.); and what the energy was used for (cooking, heating, space warming and lighting).
Data analysis
Microsoft Excel and the Statistical Package for Social Sciences (SPSS) named IBM (International Business Machines) SPSS Statistics Grad Pack 25.0 Premium were used to code and log in the data. Data analysis included a few thorough statistical tests, such as reliability tests, descriptive statistics, and analytical statistics. Descriptive statistics were used to organise and summarise data where graphs and tables outlined the data in the form of percentiles and frequencies, and regression analysis was used as per Cohen et al. (2003) to seek a potential relationship between a suitable quantitative variable (the dependent factor) and any other factor (the independent factor). The chi-square test for association was used to determine measures of variation and/or association.
3. Discussion of results
Energy access
Firewood in Ga-Malahlela village was accessed in three ways: it was either purchased, collected from the nearest forest, or collected from the backyard. It was observed that most households n=45 (67%) in the study area purchased firewood. This indicated that firewood was easily accessible through wood vendors. Moreover, all the sampled households indicated that they had access to electricity, or their households were connected to the electricity grid. However, the households' access to electricity did not encourage them to abandon firewood. For them, energy mixing was part of the solution to having sufficient energy resources. Energy mixing helped to sustain households' energy resources until their next salary or social grant payment. The Department of Minerals and Energy (2008) indicated that 20 amperes were reticulated to rural households or low voltage lines. However, N=1 (1.49%) of the households complained that this limit restricted the appliances they could use and when to use them. Households (1.49%) also complained that they could not simultaneously connect a refrigerator, television set, kettle, and stove, as the circuit breaker would trip and switch off the power. This compelled them to reduce the number of household appliances they had plugged in. This also encouraged or forced households to use firewood for cooking so that they could simultaneously use other household appliances while cooking.
Energy subsidy access
From the total sampled households, not even one indicated that they had received or registered for the FBE token. The FBE token of 50kWh provided by the government is meant to improve the livelihoods of indigent households and ultimately relieve them of energy poverty. However, the community of Ga-Malahlela had not received this token even though they qualified for it. This means that the absence of the 50kWh FBE would further enhance inequality and energy poverty, as poor households cannot afford to buy prepaid electricity vouchers. This finding concurs with a study conducted by Ferriel (2010). Moreover, households expressed that a few FBE units would do them good; this is despite Ferriel indicating that the FBE subsidy had not alleviated the use of multiple fuels and energy poverty. This was because poor households use and deplete their FBE token before they are eligible for the next token. Consequently, poor households resort to their previous source of energy.
Social factors influencing firewood use
Age distribution of the participants
As depicted in Figure 1, seven categories were utilised to determine the age of the participants. The participants were all above the age of 18, the majority of them being 25-35 years (24%), followed by 36-45 years (19%), then 46-55 years (18%), then three age categories of 18-25 years, 66-75 years, and 76+ years with 10% each, and lastly the 56-65 years age category that made up 7%.
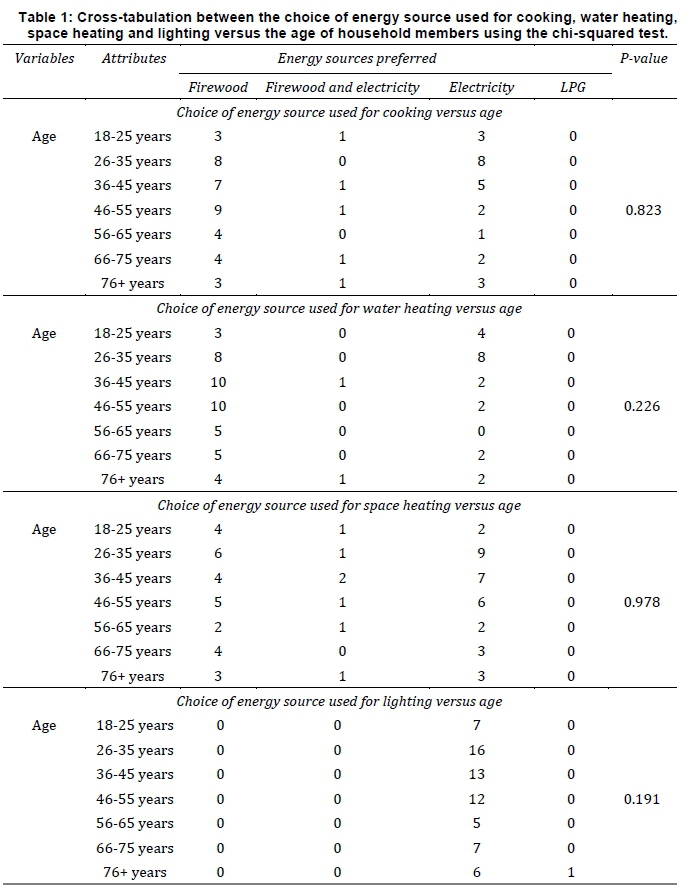
Table 1 shows the possibility of an association between age and the energy sources used for cooking, water heating, space heating and lighting, as determined using the chi-squared test. The table shows that there was no association between age and energy source for cooking, water heating, space heating and lighting. This was concluded through the chi-square results which indicated the value X2 = 3.517, df = 12, p < 0.05 for cooking; X2 = 10.041, df = 12, p < 0.05 for water heating; X2 = 4.262, df = 12, p < 0.05 for space heating; and X2 = 8.701, df = 6, p < 0.05 for lighting. This indicates insignificant evidence to conclude that age had an association with the use of firewood or influenced the use of firewood electricity, and/or liquefied petroleum gas. This finding is similar to that of An et al. (2002), Israel (2002) and Abebaw (2007), who argue that age does not influence fuel use.
Sex of the participants
The sex of the participants had to be determined to establish how it influenced firewood use, as literature revealed sex to influence the adoption of fuel use within a household. Figure 2 shows the sex of the participants. The analysis indicated that the majority of the participants surveyed were female at 79% (n = 53), while males were 21% (n = 14).
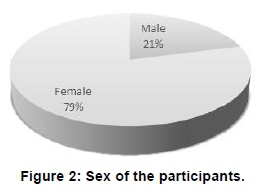
Table 2 shows the association between the sex of the participants and the energy sources used for cooking, water heating, space heating and lighting. A chi-squared test was also administered to determine the possibility of an association between these variables. The chi-square results indicate the value X2 = 2.512, df = 2, p < 0.05 for cooking; X2 = 2.052, df = 2, p < 0.05 for water heating; X2 = 2.612, df = 2, p < 0.05 for space heating; and X2 = 0.268, df = 1, p < 0.05 for lighting. Thus, it was concluded that there was no significant association/relationship between sex and the energy sources used for cooking, water heating, space heating and lighting. Rahut et al. (2016) illustrated that women are mostly responsible for household dynamics and the type of energy source the household uses. They also indicated that a female's preferences are more likely to receive recognition if the household is headed by a female. However, the findings in this study area indicated that not only were women responsible for household dynamics and the type of energy source the household used, they were also responsible for the collection or purchasing of energy sources. The findings also revealed that the providers ('breadwinners') were responsible for the type of energy source a household used. However, females were given the responsibility for household dynamics and thus the choice of energy the household used. The majority of females preferred firewood as their source of fuel for cooking (n = 31), (n = 37) for water heating, and (n = 20) for space heating compared to males who preferred mostly electricity for cooking (n =19), (n = 14) for water heating, and (n = 28) for space heating. This indicated that females were mostly affected by energy poverty, as they were left with the responsibility of ensuring that the household did not run out of energy for the entire month. This study further established that the provider and/or the person responsible for the household dynamics highly determined or influenced the type of energy source a household used.
Marital status of the participants
Figure 3 shows the marital status of the participants. It reveals that 48% (n = 32) were single, 28% (n = 19) were married, 15% (n = 10) were a widow/widower, and 7% (n = 5) were cohabiting; the divorced participants were only 1% (n = 1).
It was also imperative to determine the marital status of the participants because, according to Tchereni (2013) and Karakara and Osabuohien (2018), marital status has a positive effect on gravitating towards the adoption of clean fuels. Table 3 indicates the chi-squared test done on the energy sources used for cooking, water heating, space heating and lighting and the marital status of the participants to determine if any relationship existed between the variables. The test revealed that there was no statistically significant relationship between the marital status and the energy sources used for cooking, space heating and lighting. The chi-square results indicate the value X2 = 7.184, df = 8, p < 0.05 for cooking; X2 = 7.493, df = 8, p < 0.05 for space heating; and X2 = 5.786, df = 4, p < 0.05 for lighting. However, a statistically significant relationship existed between energy sources used for water heating and marital status. This is because X2 = 17.496, df = 8, p > 0.05 for water heating, which indicates a significant relation between marital status and the energy sources used for water heating. The findings reveal a similar pattern as that of Tchereni (2013) and Karakara and Osabuohien (2018). This implies that the community of GaMalahlela was dominated by single individuals who preferred firewood as their main energy source for water heating.
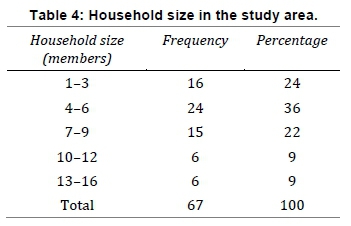
Household size of the participants
Table 4 shows the household sizes in the GaMalahlela community. The sizes of the households ranged from 1 to 16 members. Five household size categories were used to distribute the data: 1-3 (24%), 4-6 (36%), 7-9 (22%), 10-12 (9%) and 13-16 (9%), with most households having between 4 and 6 individuals, while fewer households had 10-12 and 13 -16. The average household size in the study area was five. Larger households revealed that firewood for cooking allowed them to prepare enough food to feed the entire family. However, smaller households said that they used firewood for some of their household energy needs because they either preferred it or thought it saved electricity.
Household size is among the variables that have been found to have an impact on the choice of energy source. Table 5 shows the association between the energy sources used for cooking, water heating, space heating and lighting and household size. A chi-squared test was administered to determine the possibility of an association between these variables. The results indicate the value X2 = 6.976, df = 8, p < 0.05 for cooking; X2 = 10.079, df = 8, p < 0.05 for water heating; X2 = 3.39,1 df = 8, p < 0.05 for space heating; and X2 = 3.236, df = 4, p < 0.05 for lighting. This indicates that there was no relationship between the energy sources used for cooking, water heating, space heating and lighting and the household size. A study conducted by Karakara (2018) showed how larger households tended to gravitate towards the use of dirty fuels such as firewood for household energy needs such as cooking and water heating, while smaller households tended to use cleaner energy options. This was attributed to the assumption that larger households may cook larger quantities of food to feed the entire family, thus the need to use energy sources of minimal cost. Therefore, smaller households may cook smaller quantities of food using electricity because they can afford to do so.
Economic factors that influence household firewood use
Level of education of the participants
Five educational level categories as per Statistics South Africa (2016) were used to distribute the age of the participants, with educational levels classified into: no schooling, Grades 0 and R (pre-schooling), Grades R-7 (primary schooling), Grades 8-12 (secondary schooling), and higher certificate to doctorate (post-secondary/higher education). Figure 4 shows that most of the participants had secondary schooling (60%), followed by primary schooling (22%), then higher education (9%) and no schooling (9%).
Education has been viewed as one of the main drivers of socioeconomic development and innovation. Several studies (Osiolo, 2010; Eakins, 2013; Mensah and Adu, 2013; Nlom and Karimove, 2015) established a positive significant relationship between household firewood use and education level, while Ouedraogo (2006); Farsi et al. (2007); Rahut et al. (2017a; 2017b) established that educational level influences a decision to adopt cleaner energy options. It was, therefore, necessary to establish if there was a relationship between the level of education of the participants and the choice of energy. Table 6 shows the possibility of an association between the education level of the participants and the energy sources used for cooking, water heating, space heating and lighting, as determined using the chi-squared test. The chi-square results indicate the value X2 = 2.989, df = 6, p < 0.05 for cooking; X2 = 6.478, df = 6, p < 0.05 for water heating; X2 = 5.735, df = 6, p < 0.05 for space heating; and X2 = 3.519, df = 3, p < 0.05 for lighting. This is insignificant evidence to conclude that there is an association.
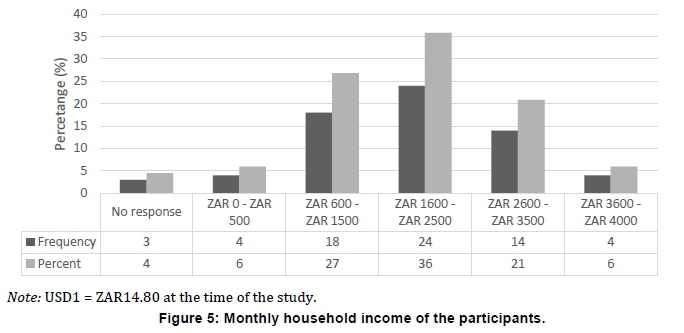
Household income of the participants
Figure 5 indicates the monthly income of households in the study area. It shows that most of the participants earned less than ZAR 3000 per month. This indicates that most households in GaMalahlela were indigent, as per the categories of Sustainable Energy Africa (2016). This means that households in the study area should be registered to receive social grants and FBE. Uhunamure et al. (2017) indicated that low-income households spent most of their time harvesting firewood to meet their household energy needs. This was, however, different for the Ga-Malahlela, as most households (even the low-income ones) purchased firewood.
According to the United Nations (2011), household income comprises all receipts (whether financial or merchandise) and services obtained by individuals from a household at a yearly or more frequent interval, but excludes bonus increases and other such sporadic and typically once-off receipts. Table 7 was used to determine the possibility of an association between the energy source used for cooking, water heating, space heating and lighting and the household income using the chi-squared test. It shows that there was no association. This was concluded by using the chi-square results indicating the value X2 = 2.052, df = 2, p < 0.05 for cooking; X2 = 9.938, df = 10, p < 0.05 for water heating; X2 = 12.514 df = 10, p < 0.05 for space heating; and X2 = 1.819 df = 5, p < 0.05 for lighting. This indicates insignificant evidence to conclude that a relationship existed between the tested variables. However, according to the literature, the energy ladder indicates that households with a higher income will ascend the ladder and vice versa for low-income households, which would mean that household income has a positive correlation with energy choice. This was true for a study by Mensah and Adu (2013), which indicated that household income positively influenced a household's choice for cleaner fuels and reduced the chance of using dirty fuels such as firewood. However, the results in this study indicated otherwise, as participants did not conform to the energy ladder hypothesis. Households in Ga-Malahlela used firewood regardless of their income bracket.
Employment status of the participants
Four employment status categories (employed, unemployed, self-employed and pensioner) were used for this study. The participants were asked to indicate their occupation from the options given, the results being shown in Figure 6. They indicate that most of the participants were unemployed 46% (n = 31), 24% (n = 16) were pensioners, 21% (n = 14) were employed and 9% (n = 6) were self-employed. The high unemployment rate is linked to the number of participants in the 26 to 35 years age category. This indicates that the households in Ga Malahlela were mostly occupied by unemployed individuals of working age, most of who were still living with their parents (usually pensioners) and were dependent on them for their livelihoods.
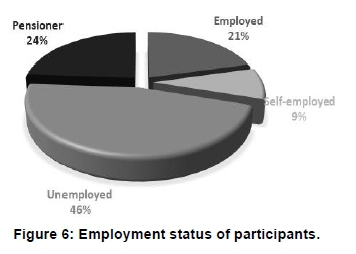
Table 8 shows the test results of a potential relationship between the energy sources used for cooking, water heating, space heating and lighting and the employment status of the participants. A chi-squared test was used to establish the possibility of this relationship, and revealed that there was no statistically significant relationship, since the chi-square results indicate the value X2 = 1.869, df = 6, p < 0.05 for cooking; X2 = 4.258, df = 6, p < 0.05 for water heating; X2 = 6.903 df = 6, p < 0.05 for space heating; and X2 = 3.236 df = 3, p < 0.05 for lighting. According to Roubik et al. (2018), most employed individuals and/or households frequently use electricity in their households, although some also use firewood. This is where educational status comes to the fore. Employment and income are often attributed to educational status, thus households/individuals who are educated would likely use cleaner energy options such as electricity. The high rate at which firewood is used is linked to poor financial positions and easy access to wood (Roubik et al., 2018). In rural areas such as Ga-Malahlela, of all the energy sources, firewood in particular has the maximum budget share among users. The cost of energy also influences a household's choice of energy, as well as how much energy the household uses. Energy costs, therefore, have a negative effect on the amount of energy used. This means that the cost of energy is inversely proportional to the quantity of energy used (Heltberg, 2003).
4. Conclusions and recommendations
This research was conducted to understand the drivers of firewood use even after the electrification of Ga-Malahlela village. This paper integrated literature and the results of the study in order to describe the conclusions of the investigation and the recommendations for future research. The research showed that the community of Ga-Malahlela could easily and readily access firewood either by purchasing it from vendors or collecting/harvesting it from the nearest forest. Electricity was also easily accessible, as participants indicated that they had been connected to the national grid since 2015.
Nonetheless, the study further established that households that were connected to the national electrical grid were more energy-poor. This highlights the fact that access to basic services is only one part of the problem; the affordability of basic services is a socio-economic issue that needs to be addressed. The unaffordability of basic services within this community suggests that households would continue to rely on firewood and other energy alternatives for years to come. This is because of the limited amount of supply of 20 amperes for indigent households supplied to the village as well as the high costs of electricity tokens. However, households would continue to use firewood because it was readily available and affordable. Moreover, it is assumed that households that can economically sustain themselves can afford the current electricity prices. Inversely, those that cannot economically sustain themselves cannot afford the current electricity prices (Madubansi & Shackleton, 2006). As a result, these households rely heavily on readily accessible energy alternatives such as firewood. Consequently, the over-harvesting of firewood in villages such as Ga-Malahlela is here to stay. This study, therefore, affirms that rural firewood reliance continues, due to several socio-economic factors such as indigence, preference, and inaccessibility to free basic services such as FBE.
This study recommends acknowledging that poor households will continue to use various sources of energy and technologies to meet their needs in the foreseeable future. Apart from firewood, electricity is a source of energy used by the community of Ga-Malahlela. This study, therefore, prompted a search into cost-effective alternative fuel solutions that could be used by households simultaneously with electricity to guarantee that households use up their electricity token for a month and do not revert to alternative 'dirty' fuels (Sustainable Energy Africa, 2018). Alternative sources of energy include biogas, solar energy, and liquefied petroleum gas, which are unexplored in the study area. It is important to determine why these energy sources are unexplored, as they are considered safer and more efficient than firewood.
It is understood that alternative fuels will have high financial implications. Moreover, stakeholders should embrace these alternative sources of energy as a worthy and safer investment for human livelihood and the environment. The provision of the monthly 50kWh FBE subsidy would go a long way for the community of Ga-Malahlela, as indicated by the participants. The Polokwane local municipality thus needs to identify communities such as Ga-Malahlela that should receive FBE tokens and supply them with these tokens. This study, therefore, recommends that indigent households should be supplied with subsidised or decreased electricity rates/prices. Moreover, policymakers should implement diversification of affordable energy alternatives, while measures to promote rural economic growth should not be disregarded (Von Maltitz & Shackleton, 2004; Kirkland et al., 2007).
Acknowledgements
This work was supported in part by the University of South Africa masters and doctoral bursary.
Author roles
M.E. Masekela collected and analysed data and wrote the paper; K. Semenya supervised and revised the paper.
References
Abebaw, D. 2007. Household determinants of fuelwood choice in urban Ethiopia: A case study of Jimma Town. Journal of Developing Areas, 41 (1): 117-26. [ Links ]
An, L., Liu, F.L.J., Linderman, M.A. & Huang, J. 2002. Modelling the choice to switch from fuelwood to electricity: Implications for giant panda habitat conservation. Ecological Economics, 42 (3): 445-457. [ Links ]
Arnold, J.E.M., Köhlin, G. & Persson, R. 2003. Woodfuels, livelihoods and policy interventions: Changing perspectives. World Development, 34: 596-611. [ Links ]
Arnold, M. & Persson, R. 2003. Reassessing the fuelwood situation in developing countries. International Forestry Review, 5 (4): 379-383. [ Links ]
Arthur, M., Bond, C.A. & Willson, B. 2012. Estimation of elasticities for domestic energy demand in Mozambique. Energy Economics, 34 (2): 398-409. [ Links ]
Bailis, R., Ezzati, M. & Kammen, D.M. 2005. Mortality and greenhouse gas impacts of biomass and petroleum energy futures in Africa. Science, 308: 98-103. [ Links ]
Bailis, R., Ezzati, M. & Kammen, D.M. 2007. Health and greenhouse gas impacts of biomass and fossil fuel energy futures in Africa. New Haven, CT: Yale University. [ Links ]
Bhatt, B.P. & Sachan, M.S. 2004. Firewood consumption along an altitudinal gradient in mountain villages of India. Biomass and Bioenergy, 27 (1): 69-75. [ Links ]
Boudreau, S., Lawes, M.J., Piper, S.E. & Phadima, L.J. 2005. Subsistence harvesting of pole-size understorey species from Ongoye Forest Reserve, South Africa: Species preference, harvest intensity, and social correlates. Forest Ecology and Management, 216 (1-3): 149-165. [ Links ]
Cohen, J., Cohen, P., West, S.G & Aiken, L.S. 2003. Applied multiple regression/correlation analysis for the behavioural sciences. (3rd Ed.). Mahwah: Lawrence Erlbaum Associates. [ Links ]
Ding, Y., Qu, W., Niu, S., Liang, M., Qiang, W. & Hong, Z. 2016. Factors influencing the spatial difference in household energy consumption in China. Sustainability, 8: 1285. [ Links ]
Department of Minerals and Energy. 2008. Electricity pricing policy (EPP) of the South African electricity supply industry, Government Gazette No. 31741. Pretoria: Department of Minerals and Energy. [ Links ]
Department of Energy. 2015a. Integrated energy plan. Retrieved from www.energy.gov.za/files/IEP/2016/Integrated-Energy-Plan-Report.pdf [Accessed on 23 February 2019]. [ Links ]
Department of Energy. 2015b. State of renewable energy in South Africa. Pretoria: Department of Energy. [ Links ]
Department of Energy. 2016. Integrated energy plan. Pretoria: Department of Energy. [ Links ]
Dunkerley, J., Macauley, M., Naimuddin, M. & Agarwal, P.C. 1990. Consumption of fuelwood and other household cooking fuels in Indian cities. Energy Policy, 18 (1): 92-99. [ Links ]
Eakins, J. 2013. An analysis of the determinants of household energy expenditures: Empirical evidence from the Irish Household Budget Survey. Ph.D. thesis, University of Surrey, Guildford. [ Links ]
Edwards, J.H.Y. & Langpap, C. 2005. Startup costs and the decision to switch from firewood to gas fuel. Land Economics, 81 (4): 570-586. [ Links ]
Farsi, M., Filippini, M.S. & Pachauri, S. 2005. Fuel choices in urban Indian households. Environment and Development Economics, 12: 757-774. [ Links ]
Ferriel, A. 2010. Free basic electricity: A better life for all. Johannesburg: Earthlife Africa. [ Links ]
Gaugris, J.Y. & Van Rooyen, M.W. 2010. Woody vegetation structure in conserved versus communal land in a biodiversity hotspot: A case study in Maputaland, South Africa. South African Journal of Botany, 76 (2): 289-298. [ Links ]
Girard, P. 2002. Charcoal production and use in Africa: What future? Unasylva, 53: 30-35. [ Links ]
Heltberg, R. 2003. Household fuel and energy use in developing countries: A multi-country study. Washington, DC: World Bank, Oil and Gas Division. [ Links ]
Heltberg, R. 2004. Fuel switching evidence from eight developing countries. Energy Economics, 26: 869-887. [ Links ]
Heltberg, R. 2005. Factors determining household fuel choice in Guatemala. Environment and Development Economics, 10 (3): 337-361. [ Links ]
Hiemstra-Van der Horst, G. & Hovorka, A. 2008. Reassessing the 'energy ladder': Household energy use in Maun, Botswana. Energy Policy, 36 (9): 3333-3344. [ Links ]
Howells, M.I., Alfstad, T., Victor, D.G., Goldstein, G. & Remme, U. 2005. A model of household energy services in a low-income rural African village. Energy Policy, 33 (14): 1833-1851. [ Links ]
International Agency for Research on Cancer. 2010. Household use of solid fuels. Monographs Volume 95. Lyon: International Agency for Research on Cancer. [ Links ]
International Energy Agency. 2017. Energy access outlook: from poverty to prosperity, World energy outlook 2017 special report. Paris: International Energy Agency. [ Links ]
International Energy Agency. 2010. World energy outlook 2010. Paris: International Energy Agency. [ Links ]
Iiyama, M., Neufeldt, H., Dobie, P., Njenga, M., Ndegwa, G. & Jamnadass, R. 2014. The potential of agroforestry in the provision of sustainable woodfuel in sub-Saharan Africa. Current Opinion in Environmental Sustainability, 6: 138-147. [ Links ]
Israel, D. 2002. Fuel choice in developing countries: Evidence from Bolivia. Economic Development and Cultural Change, 50 (4): 865-890. [ Links ]
Jingchao, Z. & Kotani, K. 2010. The determinants of household energy demand in rural Beijing. Japan: International University of Japan Research Institute. [ Links ]
Johnson, N. & Bryden, K.M. 2012. Energy supply and use in a rural West African village. Energy, 43 (1): 283-292. [ Links ]
Karakara, A.A. 2018. Energy-poverty nexus: Conceptual framework analysis of cooking fuel consumption in Ghanaian households. Developing Country Studies, 8(11): 1-10. [ Links ]
Karakara, A.A. & Osabuohien, E.S. 2018. Clean versus dirty energy in SSA: Analysis of Ghanaian households' fuel adoption and use. Paper presented as part of a panel discussion at the African Innovation Summit II in Kigali, Rwanda, 6-9 June 2018. [ Links ]
Kebede, B., Bekele, A. & Kedir, E. 2002. Can the urban poor afford modern energy? The case for Ethiopia. Energy Policy, 30 (11/12): 1029-1045. [ Links ]
Kennes, W., Parikht, J.K. & Stolwijk, H. 1984. Energy from biomass by socioeconomic groups - A case study of Bangladesh. Biomass, 4: 209-234. [ Links ]
Kirkland, T., Hunter, L.M. & Twine, W. 2007. The bush is no more: Insights on institutional change and natural resource availability in rural South Africa. Society and Natural Resources, 20: 337-350. [ Links ]
Kituyi, E., Marufu, L., Huber, B., Wandiga, S.O., Jumba, O.I., Andreae, M.O. & Helas, G. 2001. Biofuels consumption rates in Kenya. Biomass and Bioenergy, 20: 83-99. [ Links ]
Kowsari, R. & Zerriffi, H. 2011. Three-dimensional energy profile: A conceptual framework for assessing household energy use. Energy Policy, 39 (12): 7505-7517. [ Links ]
Madubansi, M. & Shackleton, C.M. 2006. Changing energy profiles and consumption patterns following electrification in five rural villages, South Africa. Energy Policy, 34: 4081-4092. [ Links ]
Mahapatra, A.K. & Mitchell, C.P. 1999. Biofuel consumption, deforestation, and farm level tree growing in rural India. Biomass andBioenergy, 17 (4): 291-303. [ Links ]
Mekonnen, A. & Kohlin, G. 2009. Determinants of household fuel choice in major cities in Ethiopia. Working Papers in Economics No. 399. Sweden: University of Gothenburg. [ Links ]
Mensah, T. & Adu, G. 2013. An empirical analysis of household energy choice in Ghana. Working Paper Series 2013:6. Uppsala: Swedish University of Agricultural Studies. [ Links ]
Mwampamba, T.H., Ghilardi, A., Sander, K. & Chaix, K.J. 2013. Dispelling common misconceptions to improve attitudes and policy outlook on charcoal in developing countries. Energy for Sustainable Development, 17 (2): 75-85. [ Links ]
Nlom, J.H. & Karimov, A.A. 2015. Modeling fuel choice among households. Sustainability, 7: 9989-9999. [ Links ]
Onoja, A.O. 2012. Econometric analysis of factors influencing fuel wood demand in rural and peri-urban farm households of Kogi State. Sustainable Development, 8: 115-127. [ Links ]
Osiolo, H. 2010. Enhancing household fuel choice and substitution in Kenya. Discussion Paper No. 102. Nairobi: Kenya Institute for Public Policy Research and Analysis. [ Links ]
Ouedraogo, B. 2006. Household energy preferences for cooking in urban Ouagadougou, Burkina Faso. Energy Policy, 34 (18): 3787-3795. [ Links ]
Polokwane Local Municipality. 2018. Polokwane local municipality 2018-2019 integrated development plan. Polo-kwane: Polokwane Local Municipality. [ Links ]
Prasad, G. & Visagie, E. 2005. Renewable energy technologies for poverty alleviation. Initial assessment report: South Africa. Cape Town: Energy Research Centre, University of Cape Town. [ Links ]
Rahut, D.B., Ali, A. & Mottaleb, K.A. 2017b. Understanding the determinants of alternate energy options for cooking in the Himalayas: Empirical evidence from the Himalayan region of Pakistan. Journal of Cleaner Production, 149: 528-539. [ Links ]
Rahut, D., Bhagirath, B & Akhter, A. (2016). Household energy choice and consumption intensity: Empirical evidence from Bhutan. Renewable and Sustainable Energy Reviews, 53 (C): 993-1009. [ Links ]
Rahut, D.B., Mottaleb, K.A & Ali, A. 2017a. Household energy consumption and its determinants in Timor-Leste. Asian Development. Review., 34: 167-197. [ Links ]
Rehnus, M., Nazarek, A., Mamadzhanov, D., Venglovsky, B.I. & Sorg, J.P. 2013. High demand for firewood leads to the overuse of walnut-fruit forests in Kyrgyzstan. Journal of Forestry Research, 24 (4): 797-800. [ Links ]
Roubik, H., Mazancova, J., Brunerova, A. & Herack, D. 2018. Factors influencing use of fuelwood and its environmental impacts in Tapanuli Utara regency, North Sumatra. Agronomy Research, 16 (S1): 1228-1236. [ Links ]
Ryan, T. 2013. Sample size determination and power. (1st Ed.). Hoboken, New Jersey: John Wiley and Sons Inc. [ Links ]
San, V., Spoann, V., Ly, D. & Chheng, N.V. 2012. Fuelwood consumption patterns in Chumriey Mountain, Kampong Chhnang Province, Cambodia. Energy, 44 (1): 335-346. [ Links ]
Sustainable Energy Africa. 2016. Household energy use and supply survey of Dikgale subdistrict of Polokwane, Limpopo. Cape Town: Sustainable Energy Africa. [ Links ]
Sustainable Energy Africa. 2018. Household energy access. Cape Town: Sustainable Energy Africa. [ Links ]
Semenya, K. & Machete, F. 2019. Factors that influence firewood use among electrified Bapedi households of Senwa- barwana villages, South Africa. African Journal of Science, Technology, Innovation, and Development, 11 (6): 2042-1338. [ Links ]
Shackleton, C.M. & Shackleton, S.E. 2004. The importance of non-timber forest products in rural livelihood security and as safety nets: A review of evidence from South Africa. South African Journal of Science, 100: 658-664. [ Links ]
Shackleton, C.M., Buiten, E., Annecke, W., Banks, D., Bester J., Everson, T., Fabricius, C., Ham, C., Kees, M., Modise, M., Phago, M., Prasad, G., Smit, W., Twine, W., Underwood, M., Von Maltitz, G. & Wenzel, P. 2007. Exploring the options for fuelwood policies to support poverty alleviation policies: Evolving dimensions in South Africa. Forests, Trees and Livelihoods, 17: 269-292. [ Links ]
Song, N., Aguilar, F.X., Shifley, S.R. & Goerndt, M.E. 2012. Factors affecting wood energy consumption by U.S. households. Energy Economics, 34 (2): 389-397. [ Links ]
Statistics South Africa. 2016. Education Series Volume III: Educational Enrolment and Achievement, 2016. Report No. 92-01-03. Pretoria: Statistics South Africa. [ Links ]
Tchereni, B.H.M. 2013. An economic investigation into fuelwood demand behavior in South Lunzu Township in Malawi. Developing Countries Studies, 3 (4): 153-159. [ Links ]
Uhunamure, E.S., Nethengwe, N.S. & Musyoki, A. 2017. Driving forces for fuelwood use in households in the Thulamela Municipality, South Africa. Journal of Energy in Southern Africa, 28 (1): 25-34. [ Links ]
United Nations. 2011. The Canberra Group handbook on household income statistics. (2nd Ed.). Geneva: United Nations. [ Links ]
Van der Kroon, B., Brouwer, R. & van Beukering, P.J.H. 2011. The energy ladder: Theoretical myth or empirical truth? Results from a meta-analysis. Renewable and Sustainable Energy Reviews, 20(C): 504-513. [ Links ]
Von Maltitz, G. & Shackleton, S.E. 2004. Use and management of forests and woodlands in South Africa: stakeholders, institutions, and processes from past to present. In: Lawes, M.J., Eeley, H.A.C., Shackleton, C.M. & Geach, B.G.S. (eds.). Indigenous forests and woodlands in South Africa: Policy, people, and practice. Scottsville: University of KwaZulu-Natal Press. pp 109-138. [ Links ]
World Bank Group. 2020. Poverty & Equity Brief: South Africa. Retrieved from https://data-bank.worldbank.org/data/download/poverty/33EF03BB-9722-4AE2-ABC7-AA2972D68AFE/Global_POVEQ_ZAF.pdf [Accessed on 02 August 2021]. [ Links ]
World Health Organization. 2014. The burden of disease from household air pollution for 2012. Geneva: World Health Organization. [ Links ]
* Corresponding author: Tel.: +27 (0)72 919 7562.; email: 55308120@mylifeunisaac.onmicrosoft.com

