


Services on Demand
Article
 English (pdf)
 Article in xml format
 Article references
Indicators

Related links
-
 Cited by Google
 -
 Similars in Google
Share

 Permalink
Journal of Energy in Southern Africa
On-line version ISSN 2413-3051
Print version ISSN 1021-447X
J. energy South. Afr. vol.32 n.3 Cape Town Aug. 2021
http://dx.doi.org/10.17159/2413-3051/2021/v32i3a10364
ARTICLES
Design and application of a distributed generation hosting capacity algorithm
M.A. Sam*; D.T.O Oyedokun; K. O. Akpeji
Department of Electrical Engineering, University of Cape Town, Cape Town, South Africa
ABSTRACT
Distribution networks in Southern Africa and elsewhere are witnessing an unprecedented growth of consumer-side distributed generation (DG) courtesy of governmental interventions to maximise the utilisation of renewable energy resources through low-carbon grid-edge technologies. To deal with the increasing adoption of consumer-side DG, distribution network operators need to conduct technical studies to foster an understanding of the benefits and impacts of DG and the hosting capacity (HC) of existing distribution networks. This will aid the implementation of measures to manage grid exports. Using a distribution network in Namibia as a case study, this paper presents an algorithm for assessing the HC of consumer-side DG in existing distribution networks that are situated in areas anticipating high and uniform uptake of DG. The algorithm is a hybrid of deterministic and probabilistic methods. The uniqueness of the algorithm is the concept of calculating monthly HC. The algorithm was tested on a real existing residential distribution network and the results confirmed that HC varies monthly. However, the practical implementation of monthly HC requires upgrades to existing inverter technology, which currently contains a single export limit functionality. This opens the possibility to drive innovation in the inverter technology to develop a date-based multiple export limit functionality.
Keywords: consumer-side distributed generation, time-series, distribution network, notified maximum demand.
1. Introduction
The lack of the development and implementation of effective regulation for consumer-side distributed generation (DG) in Southern Africa is one of the factors hampering full-fledged adoption of consumer-side DG in the region. Amongst all countries in the region, only Namibia and South Africa have operational regulation for consumer-side DG (International Finance Corporation, 2020). However, the increasing demand to access the grid for DG deployment requires distribution network operators (DNO) and regulators in the two countries to evolve their existing frameworks, and incorporate latest grid-edge developments, such as energy storage and advanced inverter functionalities. On the other hand, countries with no or non-operational regulations need to maximise efforts to develop operational frameworks. A prerequisite to developing regulatory frameworks for consumer-side DG is to define capacity requirements, which ideally requires the DNO to assess the adequacy of local distribution networks to host DG. Even though the issue of regulation frameworks applies to all Southern African countries, this paper focuses on the Namibian context.
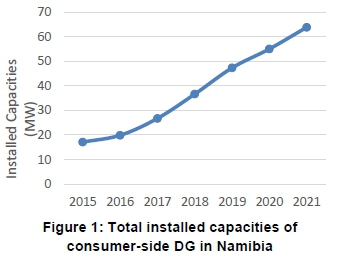
Namibia has seen an unprecedented growth of DG - mainly solar PV - in the past ten years, courtesy of numerous contributing factors including incentives, and consumer's preference for self-generation due to increasing electricity tariffs. Incentives were provided via feed-in-tariff in Erongo Region between 2010 and 2015, through Erongo Regional Electricity Distributor (Erongo RED). After 2015, the incentives were provided nationally via the net metering policy, also known as the net metering rules, which was enacted in 2016. The net metering policy was developed by the national electricity regulator, the Electricity Control Board, to provide national regulation for consumer-side DG in Namibia (Electricity Control Board, 2016). Figure 1 shows an estimate of the total installed capacities of consumer-side DG in Namibia from 2015 to 2021.
To accommodate the growing demand for consumer-side DG with a reduced risk of technical challenges, DNO need to assess the adequacy of their distribution networks to host DG through the concept of hosting capacity (HC).
This paper develops and tests an algorithm for assessing the HC of existing distribution networks. The algorithm is a hybrid of deterministic and probabilistic methods for HC and is based on the Newton-Raphson load flow method. Voltage profiles at the points of connection of DG and the loading of cables and transformers are used as performance indices that indicate the HC of distribution networks.
The algorithm is data-driven and requires a real distribution network's equipment parameters, historical time-series load data, and time-series solar irradiance data. The algorithm was implemented in DigSilent PowerFactory and scripted using Dig-Silent programming language. The objective of the algorithm is to compute hosting capacities of existing distribution networks in areas anticipating a high and uniform uptake of DG, such as business areas and middle-high-income residential areas. The algorithm calculates the HC of a distribution network at both consumer and network levels. It also introduces the concept of calculating HC results on a monthly basis, subject to monthly time-series load data. The algorithm is proposed as an adaptation to the current consumer-side DG regulatory framework in Namibia to guide DNO in the assessment of the hosting capacities of their local distribution networks, and in the implementation of appropriate measures to manage grid exports and minimise technical challenges associated with DG.
The rest of this paper proceeds thus: an extensive literature review is presented in section 2; section 3 discusses the motivations and considerations of the developed HC methodology; section 4 discusses the network model and results; section 5 discusses the application of HC results from the algorithm; section 6 summarises the limitations of the algorithm; conclusions are drawn in section 7; author's contributions and acknowledgements are presented in section 8 and 9, respectively.
2. Literature review
2.1 Active distribution networks
Distribution networks were initially designed to facilitate a unidirectional power flow from centralised generation plants to loads while operating within limits defined by planning and design standards (Ng, Lie & Goel, 2007; Chowdhury, Crossley & Chowdhury, 2009; Stewart et al., 2013). In the context of Namibia, these standards include the NRS 034 and NRS 048 (Eskom, 2003, 2007). With the emergence of DG, generation now occurs closer to the loads. Thus, distribution networks have evolved from passive to active networks, which are characterised by bidirectional power flow (Ng, Lie & Goel, 2007; Chowdhury, Crossley & Chowdhury, 2009; Stewart et al., 2013). Although DG has been praised for providing significant benefits to both consumers and DNO (El-Khattam & Salama, 2004; Ng, Lie & Goel, 2007; Chowdhury, Crossley & Chowdhury, 2009; Viral & Khatod, 2012; Solar Electric Power Association, 2013; Stewart et al., 2013), it has also been criticised for the challenges it poses to the operation of distribution networks and the revenues of DNO (Viral & Khatod, 2012; Energy Networks Association, 2014; Seguin et al., 2016).
2.2 Distributed generation
There is as yet no universal definition of DG. Factors such as location, capacity, voltage level, and technology of generation system have played a vital role in the formulation of DG definitions by various researchers (Kumar & Kumar, 2017). Ackermann et al. (Ackermann, Andersson & Söder, 2001) define DG as 'an electric power source connected directly to the distribution network or on the customer side of the meter'. In this paper, we adapt this definition and define DG as a source of electric power utilising renewable energy resources as fuel and connected directly to a distribution network or on the consumer side of the meter. The energy sources - solar, wind, hydro, biomass, natural gas, and geothermal - that are employed in the concept of DG are generally called distributed energy resources (Chowd-hury, Crossley & Chowdhury, 2009). The technologies for harnessing them include reciprocating engines, gas turbines, microturbines, combined heat and power systems, wind energy conversion systems, solar (PV) systems, concentrated solar power systems, small-scale hydroelectric generation, fuel cells and storage devices (Chowdhury, Crossley & Chowdhury, 2009; Kumar & Kumar, 2017; Zhao, Wang & Zhang, 2017).
Despite the overwhelming benefits of DG, its increasing adoption presents unique economic and technical challenges to DNO (Ng, Lie & Goel, 2007; Chowdhury, Crossley & Chowdhury, 2009; Viral & Khatod, 2012). Economic challenges include the loss of gross utility revenue due to reduced energy sales, additional cost to conduct technical studies, and capital costs to upgrade infrastructures overloaded by DG (Viral & Khatod, 2012; Solar Electric Power Association, 2013). Technical challenges are more prominent in the areas of voltage regulation, current flow (losses, equipment overload etc.), power quality (overvoltage, phase voltage imbalance etc.), and protection (Mahmud, Hossain & Pota, 2011; Aziz & Ketjoy, 2017; Banfield, Ciufo & Robinson, 2018; Short, 2018; Gabriels et al., 2020; Gabriels, Oyedokun & Ruggeri, 2020).
2.3 Review of distribution networks' hosting capacity
The increasing demand for access to distribution networks for DG deployment requires DNO to explore innovative and cost-effective solutions to maximise DG penetration without deteriorating the normal operating conditions of distribution networks (Ahmadi et al., 2017; Athari, Wang & Eylas, 2017; Mulenga, Bollen & Etherden, 2020). To achieve this, DNO need to study the impacts of DG on their networks and subsequently determine possible measures for mitigating DG challenges to ensure a safe and reliable operation of distribution networks (Estorque & Pedrasa, 2016). Some of the mitigation measures include network reinforcements and upgrades, network reconfigurations, energy storage integration, and the installation of onload tap changers (OLTC) (Abad et al., 2017, 2018; Ahmadi et al., 2017; Ricciardi et al., 2019; Azibek et al., 2020; Gabriels et al., 2020). These measures require high capital investment, hence they are less cost-effective (Abad et al., 2017, 2018; Ahmadi et al., 2017; Ricciardi et al., 2019; Azibek et al., 2020; Gabriels et al., 2020). An alternative and cost-effective solution is limiting DG penetrations to HCs of distribution networks (Abad et al., 2017), (Athari, Wang & Eylas, 2017). This is achieved through either active power curtailment or grid export limits (Ricciardi et al., 2019; Azibek et al., 2020).
2.3.1 Hosting capacity definition
There is no universal definition for HC, but the literature generally suggest that it is the maximum amount of DG that maintains a satisfactory operation of a distribution network (Estorque & Pedrasa, 2016; Athari, Wang & Eylas, 2017; Jain et al., 2019; Azibek et al., 2020). Like the impacts of DG, a distribution network's HC depends on numerous factors, including load profiles, generation profiles, the concentration of DG, network configuration, voltage levels, network characteristics, and climatic conditions, especially for weather-dependent DG such as solar PV and wind (Chiradeja, 2005; Fasina, Hassan & Cipcigan, 2015; Aziz & Ketjoy, 2017; Meddeb et al., 2018; Celvakumaran, Ramachandaramurthy & Ekanayake, 2019). If properly understood, the concept of HC has the potential to help DNO make informed decisions when processing DG interconnection requests, reduce the risk of disrupting the normal operating conditions of distribution networks, enhance the utilisation of the current infrastructures, and avoid costly network upgrades (Al-Saadi, Zivanovic & Al-Sarawi, 2017; Athari, Wang & Eylas, 2017; Ismael et al., 2020).
2.3.2 Hosting capacity methodologies and metrics
Various methods have been employed in evaluating distribution networks' DG HC, which can be broadly categorised as deterministic or probabilistic (Ebe et al., 2017; Chihota & Bekker, 2020; Fang et al., 2020). These two methods have been widely compared to assess their strengths and weaknesses, and to determine suitable applications. The choice of a methodology depends on the availability of network and load data, the certainty of generation capacity, and the location/placement of DG systems (Chihota & Bekker, 2020; Mulenga, Bollen & Etherden, 2020).
2.3.2.1 Hosting capacity methodologies
Chihota and Bekker (Chihota & Bekker, 2020) compared the deterministic and probabilistic methods in the context of DG modelling. Traditional deterministic methods employ simulations based on singular, fixed values, without the consideration of uncertainties in consumer loads, variability of renewable energy DG, and the location of DG. Probabilistic methods, on the other hand, have the ability to predict the stochasticity of loads, the variability in generation, and the uncertainties in the sizes and location of DG.
Mulenga et al. (Mulenga, Bollen & Etherden, 2020) compared the strengths and weaknesses of three methods used for HC studies of solar PV in low-voltage distribution networks, namely the deterministic method, stochastic method, and time-series method. Their study indicated that deterministic methods do not consider uncertainties, while stochastic methods apply unknown input data. Time-series methods consider certainty in loading and uncertainty in the generation, especially for PV generation. Time-series methods utilise actual historical load measurements (known or certain data) and PV generation calculated according to historical solar irradiance data (uncertain data). These data often cover at least one year, divided into equal intervals (15 minutes, 30 minutes, or an hour) to capture seasonal variations in both loading and generation. Time-series methods include time correlations between loading and generation, hence they are better suited for time-varying assessment of hosting capacity (Mulenga, Bollen & Etherden, 2020).
Other methods that have been employed in the evaluation of hosting capacities especially in multi-objective optimisation applications include genetic algorithm, particle swarm optimisation, artificial neural network, bee colony optimisation, differential evolution, etc. (Venter, 2010; Pratihar, 2012; Khamees, Badra & Abdelaziz, 2016; Sipos et al., 2018; Bajaj & Singh, 2021; Bajaj et al., 2021).
2.3.2.2 Performance metrics
The performance metrics for HC are normally set based on design limits informed by network planning and design standards. Generally, network parameters, including voltage magnitude, voltage unbalance, thermal loading, and protection, are considered as performance metrics in HC assessments. Voltage magnitude and equipment loading are the most commonly used metrics (Ballanti & Ochoa, 2016; Estorque & Pedrasa, 2016; Athari, Wang & Eylas, 2017; Navarro & Navarro, 2017; Jain et al., 2019; Mulenga, Bollen & Etherden, 2020).
2.3.3 Hosting capacity practices in different countries
DG capacity requirements at the consumer and network levels for selected countries are summarised below.
DG capacity requirements at consumer level:
a) In South Africa, generation capacity requirements are defined according to the type of network a consumer is connected to. The generation capacity limit for a consumer connected to a shared network is 25% of the notified maximum demand (NMD), while the generation capacity limit for a consumer connected to a dedicated network is 75% of the NMD. The NMD is often determined by the consumer's service circuit-breaker rating (Eskom, 2010).
b) The maximum generation capacity for a single-phase DG connected to a single-phase network in Turkey is 5 kW (Altin et al., 2015).
c) In Australia, the maximum generation capacity for a single-phase DG connected to a single-phase network is 5 kW, with an export limit of 5 kW (Energy Networks Australia, 2019), except for South Australia where a single-phase DG can have a maximum capacity of 10 kW, provided that it has an export limit of 5 kW (SA Power Networks, 2019).
d) In the United Kingdom, the maximum capacity of a single-phase DG in a single-phase network is 3.68 kW. The capacity can be increased to 17 kW provided that the DG has an export limit of 3.68 kW (Energy Networks Association, 2018, 2019).
e) In Namibia, consumers are allowed to size their DG up to their service connections with DNO (Electricity Control Board, 2016).
f) A study focused on assessing the impacts of PV DG using a real distribution network located in Virginia, USA, modelled with actual historical time-series load profile and generation profiles estimated using historical irradiance data, discovered that 25% and 55% of consumer maximum load is the optimum penetration level for a residential and commercial consumer, respectively (Athari, Wang & Eylas, 2017).
DG capacity requirements at network level:
Across Europe, an aggregate DG capacity of 70% of the installed transformer capacity in a typical urban low voltage network is generally endorsed (Aziz & Ketjoy, 2017). This is similar to regulations in South Africa, where an aggregate capacity of 75% of the transformer capacity is considered an acceptable DG penetration level (Eskom, 2010).
3. Development of a hosting capacity algorithm for assessing the hosting capacity of distribution networks
3.1 Motivation for the hosting capacity algorithm
The HC algorithm is proposed as an adaption to the current consumer-side DG regulatory policy in Namibia, known as the net-metering rules (NMR). The NMR recommends that consumers can size their DG according to their service connections with the DNO (Electricity Control Board, 2016). A consumer's service connection is generally defined in terms of a circuit-breaker rating or notified maximum demand (NMD) (Eskom, 2010; Electricity Control Board, 2016). The NMR further recommends DNO to process consumer-side DG interconnection requests on a first-come-first-serve basis until limits imposed by stability requirements, as determined by practical experience and technical studies, are reached (Electricity Control Board, 2016). The NMR was adopted from the net metering model rules developed by the Interstate Renewable Energy Council (IREC) in 2003 (Interstate Renewable Energy Council, 2005, 2009). Motivations against the NMR that prompted the development of this HC algorithm include the following:
a) Unlike countries such as Australia and the UK, Namibia does not have measures in place to manage grid exports. Countries often impose export limits and restrictive capacity limits to prevent the technical challenges associated with DG (Energy Networks Association, 2016; Ismael et al., 2020).
b) Technically, the sizing of DG according to consumers' service connections without grid export management, has the potential to limit DG participation to a few consumers due to network capacity bottlenecks caused by the diversity-centred design philosophy of distribution networks.
c) The NMR presents a high risk of causing technical constraints because the HCs of local distribution networks are not known.
d) The recommended 'first-come-first-serve' approach lacks inclusivity, especially for areas experiencing high and uniform uptake of DG. DNO need an approach that has the potential to consider every consumer as a prospective prosumer.
e) With the increasing consumer preference for self-generation and growing demand for access to distribution networks for DG deployment, DNO need a cost-effective solution to maximise local adoption of consumer-side DG, increase equitable consumer participation in DG deployment, allow sufficient sizing of DG to meet consumer energy requirements, and minimise the risk of technical challenges in local distribution networks.
3.2 Considerations in the hosting capacity algorithm
The algorithm adopts techniques from HC methods discussed in (Ballanti & Ochoa, 2016; Estorque & Pedrasa, 2016; Athari, Wang & Eylas, 2017; Navarro & Navarro, 2017; Jain et al., 2019; Chihota & Bekker, 2020; Fang et al., 2020; Mulenga, Bollen & Etherden, 2020). It requires a distribution network modelled according to the as-built network drawing. Consumer loads are defined using consumer's historical time-series load data (obtained from their smart meters) and are assumed to operate at a power factor of 0.99. Consumers are assumed to be prosumers, so each one is allocated a PV system sized according to the service connection with the DNO. This provides certainty in matching demand to generation. Three-phase consumers are modelled as three-phase balanced loads with three-phase PV systems, while single-phase consumers are modelled as single-phase unbalanced loads with single-phase PV systems. PV systems are defined to operate at unity power factor and in the 'solar calculation' mode, which activates the calculation of generation profiles according to the historical solar irradiance data of the network site. This is achieved by defining the geographical coordinates of the site in DigSilent PowerFactory. 380 W monocrystalline PV panels and inverters sized according to consumers' NMD are considered in the modelling of the PV systems.
The algorithm acknowledges the presence of existing prosumers. An existing prosumer with a PV capacity equal to the service connection/ NMD is not assigned a new PV system; however, the prosumer will be modelled as a load that could be positive or negative depending on whether it is importing or exporting power to the grid. An existing prosumer with a PV capacity less than its NMD will be assigned a new PV system with a capacity that is equal to the difference between the prosumer's NMD and current PV capacity. The algorithm incorporates a generation scaling factor (GSF) ranging from 0-100%, which increments with a step-size of 1%. The GSF modifies the nominal capacities of PV systems uniformly. The algorithm also features iterative load flow simulations (a load flow at each GSF) facilitated by an extensive search algorithm that evaluates network parameters defined as performance metrics against predefined performance limits (voltage limit = 1.1 p.u., line loading limit = 100%, and transformers loading limit = 100%).
The output of a PV system model is governed by its nominal capacity, efficiency of PV panel technology, solar irradiance data (generated using the Haurwitz model for global horizontal irradiance (Reno, Hansen & Stein, 2012; Yang, Jirutitijaroen & Walsh, 2012; Palani et al., 2017)), and the GSF. A load flow is performed at each GSF. After every successful load flow simulation, the GSF increments by 1%. Equation 1 illustrates how the GSF and other factors govern the output of a PV system (as a function of time).

where:
• PVoutput: Instantaneous PV system generation output in kW.
• yGSF: Generation scaling factor from 0-100%, incrementingrby 1%.
• GH(t)=1098* cos(0z(t)) 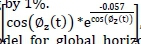 , GH(t) is the Haurwitz model for global horizontal irradiance as a function of time. 0z (t) is the zenith angle as a function of time.
• PVCapacity: The nominal capacity of the PV system in kW.
• n: Efficiency of PV panels and inverters.
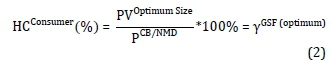
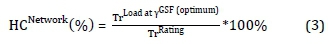
Uniquely, the algorithm calculates HC on a monthly basis. This concept eliminates the practice used in similar methods that focus on calculating HC based on a single extreme event encountered over a long period, e.g., one year. This approach acknowledges the influence of monthly weather variations on load consumption and solar irradiation, which have a direct impact on HC. If a period of 12 months is considered, the algorithm produces 12 consumer HC results and 12 network HCs. HC at a consumer level and network level are expressed in Equations 2 and 3.
where:
• HCConsumer(%): Consumer HC in percentage.
• PVOptimum Size: Optimum PV capacity.
• pCB/NMD. Consumer's service connection with DNO.
• yGSF(optimum): The GSF where violation of performance metric first occurs.
where:
• HCNetwork (%): Network HC in percentage.
• TrLoad at y LGSF(optimum): Load (kVA) on the transformer when the yGSF(optimum)is reached.
• TrRating: Transformer capacity rating (kVA).
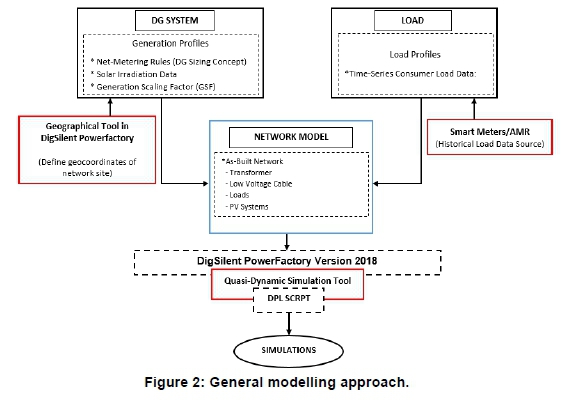
The algorithm was implemented using DigSilent programming language and the quasi-dynamic simulation tool in DigSilent PowerFactory 2018. A balanced load flow simulation is considered for balanced three-phase networks, while an unbalanced load flow simulation is considered for unbalanced single-phase networks. Figure 2 illustrates the coupling of the various systems in the model. The flowchart shown in Figure 3 defines the processes involved in the modelling of a network, and the development of a DPL script to automate the load flow simulations. The script prints simulation results to the output window of DigSilent PowerFactory and exports plotted results, such as voltage and load profiles as WMF pictures to a predefined result folder in a computer's C Drive. The script is amenable to modifications, especially when dealing with data having a duration of less than or more than a year.
This algorithm can be considered as an improved version of the traditional deterministic methods because the time-series load and generation data have eliminated the worst-case single scenario modelling approach based on extreme load and generation events, such as extreme annual minimum load versus extreme annual maximum generation. It can also be considered as a probabilistic method because time-series load data obtained from smart meters and time-series generation profiles forecasted using historical solar irradiance data are stochastic and variable. The algorithm also analyses time correlations between demand and generation. DG location uncertainty is also addressed because consumer-side DG are generally located at consumers' premises. The issue of generation capacity uncertainty is addressed by allocating consumers DG with capacities equivalent to their service connections with the DNO, which allows consumers to meet their energy requirements.
4. Testing and results of the hosting capacity algorithm
The HC algorithm was tested in a low voltage residential distribution network, part of Erongo RED's distribution network in Walvis Bay, Namibia. This !Nara distribution network supplies power to 95 single-phase residential consumers, and did not have an existing prosumer at the time of load data collection.
4.1 As-built drawing and DigSilent model
Figure 4 shows the as-built drawing of !Nara residential network that was modelled in DigSilent PowerFactory 2018. The model consists of a transformer, LV feeder cables, distribution kiosks and consumer loads. The standard service connection with any DNO in Namibia for a residential consumer is a single-phase circuit breaker rating of 60 A (Electricity Control Board, 2009), equivalent to 13.8 kVA. Each consumer in the model was therefore allocated a PV system with a nominal capacity of 13.8 kW (i.e., thirty-six 380 W monocrystalline PV panels and one 13.8 kW inverter). Consumer loads were defined using the consumer's historical time-series metering data covering a period of 12 months (from July 2018 to June 2019). The geographical coordinates of !Nara network were defined in DigSilent to provide the software access to meteorological data of this location.
4.2 Testing and results
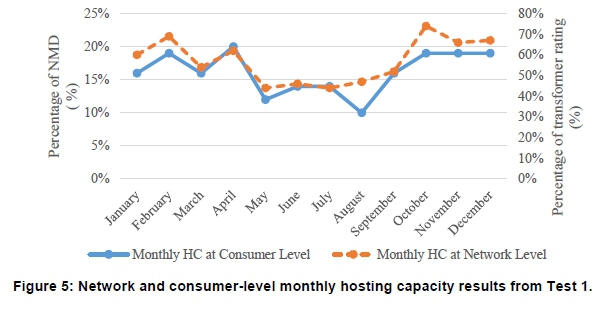
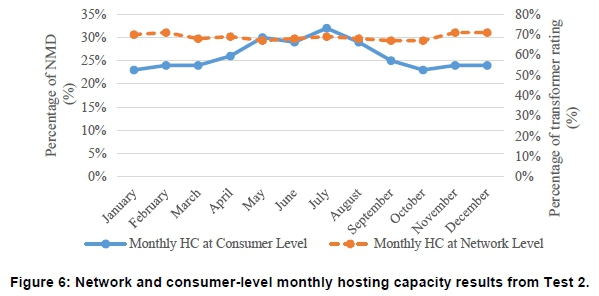
Two tests were carried out on the !Nara network with different phase configurations. In Test 1, loads and PV systems were modelled as single-phase (unbalanced) components. In Test 2, loads and PV systems were modelled as three-phase (balanced) components. Test 2 was done to analyse and understand the influence of phase unbalance on HC results. Figure 5 and Figure 6 present the HC results from Test 1 and 2, at the consumer level and the network level.
Figure 5 indicates that the HC results in Test 1 varied monthly between 10% and 20% of the NMD of 13.8 kVA. These percentages correspond to 1.38 kW and 2.76 kW respectively. The month of August had the lowest consumer HC, 10%, while April had the highest consumer HC, 20%. HC at a network level ranged from 44% to 74% of the substation transformer rating. The HC pattern was directly proportional to Walvis Bay's monthly solar irradiance pattern. Technical constraints, mainly overvoltage and line overload, were encountered between 09:00 and 15:00. Overvoltage was observed frequently in the test as compared to line overload; this demonstrates the dominance of overvoltage as a technical constraint in residential distribution networks. Overvoltage conditions did not develop on all three phases concurrently but rather on individual phases. This phenomenon is attributed to phase unbalance, and confirms this as a limiting factor of HC in single-phase networks.
Figure 6 indicates that HC results in Test 2 also varied monthly as observed in Test 1, and this variation was inversely proportional to monthly solar irradiation levels. HC at a consumer level varied monthly between 23% and 32% of the NMD, corresponding to 3.17 kW and 4.4 kW respectively. January and October had the lowest HC, 23%, while July had the highest HC, 32%. Monthly HC results HC at a network level ranged from 67% to 71% of the substation transformer rating. Overvoltage condition was the main violated performance metric throughout the test, and was recorded between 11:30 and 15:00.
4.3 Discussions and comparison of results for Tests 1 and 2
HC results in both tests varied monthly. Nonetheless, consumer HC results from Test 2 were higher than those from Test 1. This confirms that phase unbalance, which is an inherent characteristic of most single-phase residential networks (Gabriels et al., 2020; Gabriels, Oyedokun & Ruggeri, 2020), is a limiting factor in the uptake of consumer-side DG in residential networks. Consumer HC results from Test 1 were lower than the capacity requirements defined for similar types of networks in South Africa, Australia, the UK and Turkey (Eskom, 2010; Altin et al., 2015; Energy Networks Association, 2018, 2019; Energy Networks Australia, 2019; SA Power Networks, 2019), while network HC results were comparable to requirements in these countries (Eskom, 2010; Aziz & Ketjoy, 2017). Unlike the results from Test 1, the consumer and network HC results from Test 2 are comparable to the capacity requirements defined in the HC practices of the aforementioned countries, which suggests that the studies that guided the development of these practices had similar assumptions as Test 2, i.e., phase unbalance was not considered. The differences in the HC results for Test 1 and Test 2 show the importance of considering phase unbalance when conducting HC studies. Both tests indicate that residential distributions networks are susceptible to overvoltage conditions between 11:30 and 15:00 caused by DG deployments.
5. Application of the results from the proposed algorithm
While consumer-side DG sized according to consumers' service connections (NMD) provide consumers certainty in matching their generation to their energy needs, there is a need to protect distribution networks against technical constraints caused by excessive grid exports. DNO should therefore use consumer HC results from the technical studies of their local networks to define grid export management requirements for DG sized according to consumers' NMD. This allows DNO to abolish restrictive sizing of consumers-side DG. Available inverter technologies offer 'export limit functions' that only allow a single fixed export limit to be defined. DNO should therefore consider the minimum monthly consumer HC result as the safest export limit requirement. Consumers intending to use an inverter without an export limit function should size their DG according to the lowest consumer HC result for the network.
To date, there is no inverter with the date-based multiple export limit functionality. Inverter manufacturers should assess the feasibility and practicality of developing inverters with a date-based export limit functionality. This function will allow DNO to impose monthly export limits according to monthly HC limits obtained from technical studies to maximise grid infeed and benefits from grid export incentives such as net metering.
DNO may use the maximum monthly transformer HC from technical studies to define aggregate generation capacity limit for DG approved for grid export and net metering. Once this capacity is reached, new DG should be approved as non-exporting DG. This however requires DNO to design or acquire computerised DG databases to ease the tracking of DG' aggregate capacities at various points of connections, for reporting purposes and decision-making.
6. Limitation of this algorithm
The application of this algorithm is limited to existing distribution networks with available historical time-series load data, and DG located on consumers' premises. DNO should therefore consider probabilistic methods or optimisation algorithms such as genetic algorithms, particle swarm optimisation, etc. for applications with high degree of uncertainty in consumer loading, generation capacities, and location of DG.
7. Conclusion
DNO in Southern Africa should take guidance from practices in Australia and the UK, which have abolished the restrictive sizing of consumer-side DG and adopted grid export limits as a means of minimising the technical impacts caused by DG. This enables DNO to implement DG capacity requirements that provide consumers certainty in matching their generations to their energy requirements, i.e., permitting consumers to size their DG according to their service connections. Even though Namibia is on the right path with regard to DG sizing, DNO need to conduct technical studies to determine the hosting capacities of their local networks to guide the development of local grid-export limit requirements to safeguard networks from power quality and reliability issues associated with excessive grid exports. When conducting technical studies, it is important that DNO consider the phase technology of consumers to account for phase unbalance, which is one of the limiting factors of hosting capacity of DG. An algorithm for assessing LV distribution networks' DG HC was developed and tested in this paper. The algorithm can help DNO facing high uptake of DG in existing distribution networks to evaluate the adequacy of their distribution networks to host new DG while acknowledging the presence of existing DG.
Author contributions
A.M Sam and D.T.O Oyedokun conceptualised the study and contributed to technical writing. K.O. Akpeji contributed to technical writing. A.M Sam collected and analysed data, developed the algorithm, DigSilent modelling and simulations, and drafted the manuscript. D.T.O Oyedokun provided project supervision and funding.
Acknowledgement
The authors are grateful for the support received from Erongo Regional Electricity Distributor and Electricity Control Board of Namibia in making data available for this research. This work was partially supported by Eskom TESP fund, UCT research grant, ISARP programme, Joint Mobility Scheme for young and emerging researchers, co-funded by DST/NRF and the Directorate General for Country Promotion (Economy, Culture and Science) Unit for Scientific and Technological Cooperation of the Italian Ministry of Foreign Affairs.
References
Abad, M.S.S., Verbic, G., Chapman, A. & Ma, J. 2017. A linear method for determining the hosting capacity of radial distribution systems. In 2017 Australasian Universities Power Engineering Conference (AUPEC). V. November 2. Melbourne: IEEE. 1-6. DOI: 10.1109/AUPEC.2017.8282428. [ Links ]
Abad, M.S.S., Ma, J., Zhang, D., Ahmadyar, A.S. & Marzooghi, H. 2018. Probabilistic assessment of hosting capacity in radial distribution systems. IEEE Transactions on Sustainable Energy. 9(4):1935-1947. DOI: 10.1109/TSTE.2018.2819201. [ Links ]
Ackermann, T., Andersson, G. & Söder, L. 2001. Distributed generation: a definition. Electric Power Systems Research. 57(3):195-204. DOI: 10.1016/S0378-7796(01)00101-8. [ Links ]
Ahmadi, A.R., Manandhar, T., Barros, J., Bernardo, M. & Georgiopoulos, S. 2017. UK power networks' experience of managing flexible distributed generation from planning to operation. In 24th International Conference & Exhibition on Electricity Distribution (CIRED). V. 2017. London, UK: IET. 2032-2036. DOI: 10.1049/oap-cired.2017.1085. [ Links ]
Al-Saadi, H., Zivanovic, R. & Al-Sarawi, S. 2017. Probabilistic hosting capacity for active distribution networks. IEEE Transactions on Industrial Informatics. 13(5):2519-2532. DOI: 10.1109/TII.2017.2698505. [ Links ]
Altin, M., Oguz, E.U., Bizkevelci, E. & Simsek, B. 2015. Distributed generation hosting capacity calculation of MV distribution feeders in Turkey. In IEEE PES Innovative Smart Grid Technologies Conference Europe. V. 2015-Janua. Istanbul, Turkey: IEEE. 1-7. DOI: 10.1109/ISGTEurope.2014.7028776. [ Links ]
Athari, M.H., Wang, Z. & Eylas, S.H. 2017. Time-series analysis of photovoltaic distributed generation impacts on a local distributed network. In 12th IEEE PES PowerTech Conference. Manchester, UK: IEEE. 1-6. DOI: 10.1109/PTC.2017.7980908. [ Links ]
Azibek, B., Abukhan, A., Nunna, H.S.V.S.K., Mukatov, B., Kamalasadan, S. & Doolla, S. 2020. Hosting capacity enhancement in low voltage distribution networks: challenges and solutions. In 2020 IEEE International Conference on Power Electronics, Smart Grid and Renewable Energy (PESGRE2020). Cochin, India: IEEE. 1-6. DOI: 10.1109/PESGRE45664.2020.9070466. [ Links ]
Aziz, T. & Ketjoy, N. 2017. PV penetration limits in low voltage networks and voltage variations. IEEE Access. 5:16784-16792. DOI: 10.1109/ACCESS.2017.2747086. [ Links ]
Bajaj, M. & Singh, A.K. 2021. Hosting capacity enhancement of renewable-based distributed generation in harmonically polluted distribution systems using passive harmonic filtering. Sustainable Energy Technologies and Assessments. 44:101030. DOI: 10.1016/j.seta.2021.101030. [ Links ]
Bajaj, M., Sharma, N.K., Pushkarna, M., Malik, H., Alotaibi, M.A. & Almutairi, A. 2021. Optimal design of passive power filter using multi-objective pareto-based firefly algorithm and analysis under background and load-side's nonlinearity. IEEE Access. 9:22724-22744. DOI: 10.1109/ACCESS.2021.3055774. [ Links ]
Ballanti, A. & Ochoa, L.F. 2016. On the integrated PV hosting capacity of MV and LV distribution networks. In 2015 IEEE PES Innovative Smart Grid Technologies Latin America (ISGT LATAM). Montevideo, Uruguay: IEEE. 1-5. DOI: 10.1109/ISGT-LA.2015.7381183. [ Links ]
Banfield, B., Ciufo, P. & Robinson, D.A. 2018. The technical and economic benefits of utility sponsored renewable energy integration. In 2017 Australasian Universities Power Engineering Conference (AUPEC). Melbourne, VIC, Australia: IEEE. 1-6. DOI: 10.1109/AUPEC.2017.8282489. [ Links ]
Celvakumaran, P., Ramachandaramurthy, V.K. & Ekanayake, J. 2019. Assessment of net energy metering on distribution network losses. In 2019 IEEE International Conference on Automatic Control and Intelligent Systems (I2CACIS). Selangor, Malaysia: IEEE. 1-6. DOI: 10.1109/I2CACIS.2019.8825071. [ Links ]
Chihota, M.J. & Bekker, B. 2020. Modelling and simulation of uncertainty in the placement of distributed energy resources for planning applications. In 2020 International Conference on Probabilistic Methods Applied to Power Systems, PMAPS 2020 - Proceedings. Liege, Belgium: IEEE. 1-6. DOI: 10.1109/PMAPS47429.2020.9183657. [ Links ]
Chiradeja, P. 2005. Benefit of distributed generation: a line loss reduction analysis. In 2005 IEEE/PES Transmission & Distribution Conference & Exposition: Asia and Pacific. V. 2005. Dalian, China: IEEE. 1-5. DOI: 10.1109/TDC.2005.1546964. [ Links ]
Chowdhury, S., Crossley, P. & Chowdhury, S.P. 2009. Microgrids and active distribution networks. 1st ed. London: Institution of Engineering and Technology. DOI: 10.1049/PBRN006E. [ Links ]
Ebe, F., Idlbi, B., Morris, J., Heilscher, G. & Meier, F. 2017. Evaluation of PV hosting capacity of distribuion grids considering a solar roof potential analysis - comparison of different algorithms. In 2017 IEEE Manchester PowerTech, Powertech 2017. Manchester, UK: IEEE. 1-6. DOI: 10.1109/PTC.2017.7981017. [ Links ]
El-Khattam, W. & Salama, M.M.A. 2004. Distributed generation technologies, definitions and benefits. Electric Power Systems Research;. 71(2):119-128. DOI: 10.1016/j.epsr.2004.01.006. [ Links ]
Electricity Control Board. 2009. Standard specification for medium and low voltage electricity distribution works: part B-07 - service connections. Windhoek. Available: https://www.ecb.org.na/images/docs/Rules_and_Regulations/PARTB-07-SERVICECONNECTIONS_rev4_15Oct09.pdf. [ Links ]
Electricity Control Board. 2016. Net metering rules: electricity act, 2007. Windhoek. Available: https://www.ecb.org.na/images/docs/Noticeboard/GazettedNetmeteringRules.pdf. [ Links ]
Energy Networks Association. 2014. Distributed generation connection guide: a guide for connecting generation to the distribution network in multiple premises that falls under G83/2. London. Available: www.nie.co.uk. [ Links ]
Energy Networks Association. 2016. Engineering recommendation G100 Issue 1 2016 - technical guidance for customer export limiting schemes. London. Available: www.energynetworks.org. [ Links ]
Energy Networks Association. 2018. Engineering recommendation G98: requirements for the connection of fully type tested micro-generators (up to and including 16 A per phase) in parallel with public low voltage distribution networks. London. Available: https://www.energynetworks.org/electricity/engineering/distributed-generation/engineering-recommendation-g98.html. [ Links ]
Energy Networks Association. 2019. Engineering recommendation G99 - requirements for the connection of generation equipment in parallel with public distribution networks on or after 27April 2019. London. Available: https://www.energynetworks.org/electricity/engineering/distributed-generation/engineering-recommendation-g99.html. [ Links ]
Energy Networks Australia. 2019. National distributed energy resources grid connection guidelines technical guidelines for basic micro EG connections. Melbourne VIC 3000. Available: www.energynetworks.com.au. [ Links ]
Eskom. 2003. NRS 048-2: Electricity supply - quality of supply part 2: voltage characteristics, compatibility levels, limits and assessment methods. Johannesburg: Technology Standardization Department (TSD). Available: www.stansa.co.za. [ Links ]
Eskom. 2007. NRS 034 - Electricity distribution: guidelines for the provision of electricity distribution networks in residential areas. part 1, planning and design of distribution networks. Johannesburg: Technology Standardization Department (TSD). [ Links ]
Eskom. 2010. NRS 097-02-03 - Grid interconnection of embedded generation. part 2, small-scale embedded generation. section 3, simplified utility connection criteria for low-voltage connected generators. Johannesburg: The Standardization Section. Available: http://www.sabs.co.za. [ Links ]
Estorque, L.K.L. & Pedrasa, M.A.A. 2016. Utility-scale DG planning using location-specific hosting capacity analysis. In 2016 IEEE Innovative Smart Grid Technologies - Asia (ISGT-Asia). Melbourne, VIC, Australia: IEEE. 1-6. DOI: 10.1109/ISGT-Asia.2016.7796519. [ Links ]
Fang, D., Zou, M., Harrison, G., Djokic, S.Z., Ndawula, M.B., Xu, X., Hernando-Gil, I. & Gunda, J. 2020. Deterministic and probabilistic assessment of distribution network hosting capacity for wind-based renewable generation. In 2020 International Conference on Probabilistic Methods Applied to Power Systems, PMAPS 2020 - Proceedings. Liege, Belgium: IEEE. 1-6. DOI: 10.1109/PMAPS47429.2020.9183525. [ Links ]
Fasina, E.T., Hassan, A.S. & Cipcigan, L.M. 2015. Impact of localised energy resources on electric power distribution systems. In 2015 50th International Universities Power Engineering Conference (UPEC). Stoke on Trent, UK: IEEE. 1-5. DOI: 10.1109/UPEC.2015.7339793. [ Links ]
Gabriels, G.H., Windapo, M.O., Oyedokun, D.T.O. & Ruggeri, S. 2020. Proposed framework for integration of optimal current injection and multi-agent control of the LV distribution network. In 6th IEEE International Energy Conference, ENERGYCon 2020. DOI: 10.1109/ENERGYCon48941.2020.9236499. [ Links ]
Gabriels, G.H., Oyedokun, D.T.O. & Ruggeri, S. 2020. Realtime thévenin equivalent impedance at a PCC in the Italian power grid. In 2020 International SAUPEC/RobMech/PRASA Conference. DOI: 10.1109/SAUPEC/RobMech/PRASA48453.2020.9040924. [ Links ]
International Finance Corporation. 2020. Regulatory and tariff review for distributed generation in the commercial and industrial sectors in Southern Africa. Washington, DC, USA. Available: https://www.ifc.org/wps/wcm/connect/090c58a2-2b98-482e-8c6d-b5931ed793e2/202006-Regulatory-Tariff-Review-Southern-Africa.pdf?MOD=AJPERES&CVID=nbDqlVa. [ Links ]
Interstate Renewable Energy Council. 2005. IREC model net-metering rules 2005. United States of America: Interstate Renewable Energy Council (IREC). Available: http://www.irecusa.org/index.php?id=88. [ Links ]
Interstate Renewable Energy Council. 2009. IREC model net-metering rules 2009. United states of America: Interstate Renewable Energy Council (IREC). Available: http://www.irecusa.org/NMmodel09. [ Links ]
Ismael, S.M., Abdel Aleem, S.H.E., Abdelaziz, A.Y. & Zobaa, A.F. 2020. Distributed generation in deregulated energy markets and probabilistic hosting capacity decision-making challenges. In Decision Making Applications in Modern Power Systems. 2020th ed. S.H.E.A. Aleem, A. Almoataz Youssef, A.F. Zobaa, & R. Bansal, Eds. 125 London Wall, London EC2Y 5AS, United Kingdom: Elsevier. 223-246. DOI: 10.1016/b978-0-12-816445-7.00009-8. [ Links ]
Jain, A.K., Horowitz, K., Ding, F., Gensollen, N., Mather, B. & Palmintier, B. 2019. Quasi-static time-series PV hosting capacity methodology and metrics. In 2019 IEEE Power & Energy Society Innovative Smart Grid Technologies Conference (ISGT). Washington, DC, USA: IEEE. 1-5. DOI: 10.1109/ISGT.2019.8791569. [ Links ]
Khamees, A., Badra, N. & Abdelaziz, A. 2016. Optimal power flow methods: a comprehensive survey. International Electrical Engineering Journal (IEEJ). 7(4):2228-2239. Available: http://www.ieejournal.com/wp-content/uploads/Volume/Vol7No4/OptimalPowerFlowMethodsASurvey.pdf. [ Links ]
Kumar, S. & Kumar, R. 2017. Review of the distributed generation concept using PSO: attempt of unification. International Journal of Research Review in Engineering Science & Technology. 6(1):5. DOI: https://doi.org/10.24084/repqj03.275. [ Links ]
Mahmud, M.A., Hossain, M.J. & Pota, H.R. 2011. Analysis of voltage rise effect on distribution network with distributed generation. In IFACProceedings Volumes. V. 44. 14796-14801. DOI: 10.3182/20110828-6-IT-1002.01305. [ Links ]
Meddeb, A., Sahbeni, N., Jmii, H. & Chebbi, S. 2018. Impact of distributed generation on the protection system in Tunisian distribution network. In 201815th International Multi-Conference on Systems, Signals and Devices, SSD 2018. Hammamet, Tunisia: IEEE. 514-520. DOI: 10.1109/SSD.2018.8570584. [ Links ]
Mulenga, E., Bollen, M.H.J. & Etherden, N. 2020. A review of hosting capacity quantification methods for photovoltaics in low-voltage distribution grids. International Journal of Electrical Power and Energy Systems. 115(2020):1-13. DOI: 10.1016/j.ijepes.2019.105445. [ Links ]
Navarro, B.B. & Navarro, M.M. 2017. A comprehensive solar PV hosting capacity in MV and LV radial distribution networks. In 2017 IEEE PES Innovative Smart Grid Technologies Conference Europe (ISGT-Europe). V. 2018-Janua. Torino, Italy: IEEE. 1-6. DOI: 10.1109/ISGTEurope.2017.8260210. [ Links ]
Ng, C.H., Lie, T.T. & Goel, L. 2007. Impacts of distributed Generation on system reliability in competitive electricity markets. In 8th International Power Engineering Conference, IPEC 2007. Singapore: IEEE. 735-740. Available: https://ieeexplore.ieee.org/document/4510123. [ Links ]
Palani, K., Kota, R., Azad, A.P. & Arya, V. 2017. Blue skies: a methodology for data-driven clear sky modelling. In Proceedings of the Twenty-Sixth International Joint Conference on Artificial Intelligence (IJCAI-17). USA: International Joint Conferences on Artificial Intelligence Organization (IJCAI). 3777-3783. DOI: 10.24963/ijcai.2017/528. [ Links ]
Pratihar, D.K. 2012. Traditional vs non-traditional optimization tools. In Computational Optimization and Applications. New Delhi: Narosa Publishing House Pvt. Ltd. 25-33. [ Links ]
Reno, M.J., Hansen, C.W. & Stein, J.S. 2012. Global horizontal irradiance clear sky models: implementation and analysis. Livermore, California. DOI: 10.2172/1039404. [ Links ]
Ricciardi, T.R., Petrou, K., Franco, J.F. & Ochoa, L.F. 2019. Defining customer export limits in PV-rich low voltage networks. IEEE Transactions on Power Systems. 34(1):87-97. DOI: 10.1109/TPWRS.2018.2853740. [ Links ]
SA Power Networks. 2019. Technical standard - TS129: small EG connections-capacity not exceeding 30kW. Keswick, South Australia. Available: http://www.sapowernetworks.com.au/centric/industry/contractors_and_designers/technical_standards.jsp. [ Links ]
Seguin, R., Woyak, J., Costyk, D., Hambrick, J. & Mather, B. 2016. High-penetration PV integration handbook for distribution engineers. Denver West Parkway, Golden. DOI: 10.2172/1235905. [ Links ]
Short, T.A. 2018. Electric Power Distribution Handbook. 2nd ed. Boca Raton, Florida: CRC Press LLC. DOI: 10.1201/b16747. [ Links ]
Sipos, M., Klaic, Z., Fekete, K. & Stojkov, M. 2018. Review of non-traditional optimization methods for allocation of distributed generation and energy storage in distribution system. Tehnicki vjesnik. 25(1):294-301. DOI: 10.17559/TV-20170703135143. [ Links ]
Solar Electric Power Association. 2013. Ratemaking, solar value and solar net energy metering - a primer. Washington. Available: https://sepapower.org/resource/ratemaking-solar-value-and-net-energy-metering-primer/. [ Links ]
Stewart, E., MacPherson, J., Vasilic, S., Nakafuji, D. & Aukai, T. 2013. Analysis of high-penetration levels of photovoltaics into the distribution grid on oahu, hawaii: detailed analysis of heco feeder wf1. Colorado. Available: http://www.osti.gov/bridge. [ Links ]
Venter, G. 2010. Review of optimization techniques. In Encyclopedia of Aerospace Engineering. DOI: 10.1002/9780470686652.eae495. [ Links ]
Viral, R. & Khatod, D.K. 2012. Optimal planning of distributed generation systems in distribution system: a review. Renewable and Sustainable Energy Reviews. 16(7):5146-5165. DOI: 10.1016/j.rser.2012.05.020. [ Links ]
Yang, D., Jirutitijaroen, P. & Walsh, W.M. 2012. The estimation of clear sky global horizontal irradiance at the equator. Energy Procedia 2. 25(2012):141-148. DOI: 10.1016/j.egypro.2012.07.019. [ Links ]
Zhao, B., Wang, C. & Zhang, X. 2017. Grid-integrated and standalone photovoltaic distributed generation systems - analysis, design, and control. 111 River Street, Hoboken, NJ07030, USA: John Wiley & Son. DOI: 10.1002/9781119187349. [ Links ]
* Corresponding author: Tel.: +264 81 428 2573; email: angula1993@gmail.com

