


Services on Demand
Article
 English (pdf)
 Article in xml format
 Article references
Indicators

Related links
-
 Cited by Google
 -
 Similars in Google
Share

 Permalink
Journal of Energy in Southern Africa
On-line version ISSN 2413-3051
Print version ISSN 1021-447X
J. energy South. Afr. vol.32 n.1 Cape Town Feb. 2021
http://dx.doi.org/10.17159/2413-3051/2021/v32i1a8362
ARTICLES
South African shale gas economics: Analysis of the breakeven shale gas price required to develop the industry
S.R. ClarkI, *; J-L- van NiekerkI; J. PetrieII; S. FakirIII
ISolar Thermal Energy Research Group, Department of Mechanical and Mechatronic Engineering, Stellenbosch University, South Africa
IIDepartment of Chemical Engineering, University of Cape Town, South Africa jim.petrie@sydney.edu.au
IIIThe African Climate Foundation, Cape Town, South Africa
ABSTRACT
Is Karoo shale gas an economically viable option for providing the gas needed for the South African power grid? Dispatchable power generation is essential for the implementation of a renewable based electric grid system. Natural gas-fuelled generation is proposed to meet this need, with the gas being sourced from the Karoo. However, no exploration has been conducted on this resource and it is not known if it can be produced economically. Based on information from shale developments in other parts of the world and using publicly available information, this analysis calculates the likely price that this gas would require to be economically viable. The likely steps in the process to get to commercial development would be a baseline survey period, a period of exploration and appraisal drilling, followed by a pilot development. The extensive exploration programme would take about four years and likely cost over USD 450 million. This would be followed by a pilot production programme costing approximately USD 180 million. Once commercial development is achieved, a price for the gas of USD 13.67 per GJ would be required. There are a number of factors, including well recovery, well costs, royalties and operating costs that could add to this price and make this gas development less attractive.
Highlights
• South Africa has significant shale gas potential in the Karoo.
• Internationally, LNG delivered prices are currently below USD 10 per GJ.
• South Africa shale gas breakeven price would be over USD 13.7 per GJ.
• An extensive and expensive exploration programme is required prior to development.
Keywords: gas price; development programme; timing; steady state development
Abbreviations and acronyms used
2D two-dimensional [seismic study]
3D three-dimensional [seismic study]
BCM billion cubic metres
CSIR Council for Scientific and Industrial Research
DMR(E) Department of Mineral Resources (and Energy, from 2019)
EIA [United States] Energy Information Agency
GW gigawatt
IRP Integrated Resource Plan
LNG liquefied natural gas
mcf thousand cubic feet
MCM million cubic metres
MJ megajoule
OCGT open cycle gas turbine
PJ petajoule
TCF tera cubic feet
TCM tera cubic meters
TWh terawatt hour
WWF World Wildlife Fund
1. Introduction
As indicated in the South African Integrated Resource Plan (IRP), the need for dispatchable power for the South African electric grid has been recognised (SA DoE, 2018). In most countries, this dispatchable power is being supplied by natural gas-fired generation (World Bank, 2018a). This is not the situation in South Africa.
South Africa has effectively no local gas production. The offshore gas production from fields in Mossel Bay supplying the PetroSA gas-to-liquids plant has been nearly depleted (Villiers, 2019). However, recent exploration success in the neighbouring offshore block at the Brulpadda field has opened up the potential for further gas development in that area (Clark et al., 2019). Here gas is being brought into the country by pipeline from Mozambique - with a capacity of 200 PJ/a (Rompco, 2020). Some of the gas is used to generate electricity at the border with Mozambique, with a generation capacity of 400 MW (Creamer, 2015).
The majority of the dispatchable power generated in South Africa is fuelled with diesel, at a cost of approximately USD 16 / GJ.1 The cost of natural gas in the United States in May 2018 was USD 2.7 /GJ (US EIA, 2018b), in Europe USD 6.9 /GJ (YCharts, 2018), and LNG delivered to Japan was USD 7.8 /GJ (Office of Director for Commodity Market, 2018).
South Africa has the potential for natural gas production from shales in the Karoo, which could possibly supply all the dispatchable power needs in the country. However, this potential resource has yet to be confirmed and its commercial viability is unknown. In 2014, an analysis from the World Wildlife Fund reported that an unpublished analysis from Wood Mackenzie quoted a breakeven cost of USD 11.4 /GJ (Fakir, 2015). The assumptions that were used by Wood Mackenzie are not known. This compares quite closely to the forecast from a recent study on the price required for shale gas development in Europe of over USD 10 /GJ, not including tax and royalties (Saussay, 2018). This analysis will use publicly available information to assess the likely breakeven cost for shale gas in South Africa and the factors affecting that price.
2. Background
From exploration wells drilled by Soekor in the Karoo in the 1960s, it is known that shale gas exists there (Enslin et al., 2019). However, it is not known if it exists in commercial quantities or if it can be produced at prices competitive with other fuels (SAOGA, 2017). Shale gas could potentially provide South Africa with all the gas-fired dispatchable generation requirement that was identified in the IRP. This analysis will review what is happening with shale gas around the world and discuss how it relates to South Africa.
1.1 United States of America
The USA is one of the world's major natural gas markets, consuming about 2.2 BCM of gas per day (US EIA, 2018e). The electric generation capacity in the USA is about 1000 GW, of which about 450 GW comes from natural gas-fuelled facilities (US EIA, 2018f), with total annual generation of about 4100 TWh, of which 1300 TWh is from gas fuel (US EIA, 2018a). Up until the 1990s, the USA gas market was mostly met with local gas production (US EIA, 2018e). From then onwards, gas from conventional reservoirs failed to meet market needs. With this shortfall in domestic production, there was economic pressure to develop additional production sources. With the application of hydraulic fracturing (commonly known as 'fracking') and horizontal drilling, gas production from shales grew and created a large increase in domestic USA gas production (US EIA, 2018d). Gas production grew enough to saturate the USA market. This has moved the USA from being an importer of gas to potentially becoming the world's largest gas exporter (International Gas Union, 2017).
2.2 Global potential
From a geological perspective, there is no reason for shale gas production to be confined to North America. Shale beds are spread throughout the world, with some larger than those found in the USA. In 2011, the US Energy Information Agency (US EIA) issued a report on the potential for shale development around the world (Kuuskraa et al., 2011), and updated this analysis in 2013 (Advanced Resouces International, 2013). The first study indicated that the potential resource of shale gas in the United States was about 25 trillion cubic meters, which increased to 33 TCM in the second analysis. The potential recoverable resources in the countries with the ten largest volumes identified in the 2011 and 2013 reports are shown in Table 1. In the first analysis, China had the largest potential resource. To put these numbers into perspective, the amount of electric energy that could be developed from these resources is also provided in the table. For this calculation, generation efficiency of 0.01 GJ of natural gas per KWh (US EIA, no date) and an energy content of 37 MJ/m3 for natural gas (Tran, 2002) were assumed.

South Africa sits at number five on this table based on the 2011 study, dropping to seventh in the 2013 update. The 2013 study indicated a potential resource that could generate the 235 TWh per year currently being used in South Africa for 175 years. As will be discussed further, local estimates of the South African resource are significantly lower than the estimates from this general study, with expectations that the South African shale gas resource is in the range of 0.5 to 1.5 TCM.
2.3 International experience
Since the first report from the US EIA was published, most of the countries mentioned have made attempts to develop their own shale gas resources. The experience of three of the major shale gas resource countries outside of north America will be reviewed below.
2.3.1 Australia
Australia is one of the major LNG-exporting countries, ranked second by production volume (International Gas Union, 2017). Most of the gas for LNG production is either conventional gas or coal seam methane (DEE, 2017). Australia has nearly 11 TCM of shale gas resources in six basins. Exploration and development of some of these resources had commenced by 2013 (Zuhairi, 2013) in basins with established infrastructure - specifically, existing offtake pipelines. A review of the production of the three gas sources indicated that shale gas would come at twice the cost of conventional gas. (Core Energy Group, 2015).
2.3.2 Argentina
Argentina has a long history of oil and gas development, with a well-established natural gas production. In recent years, that market has shifted to the point where imports, in the form of piped gas from Bolivia and LNG from the international market (International Gas Union, 2017), have become necessary to supply the market (Brandt and Gomes, 2016). Development of a shale gas business has been slow, due to political considerations, but commenced with a change in government in 2015 (Brandt and Gomes, 2016). One of the provisions that the new government used to encourage gas development is a floor of price of USD 7.4 /GJ (Deloitte, 2018). Shale gas production is now increasing, coming from the Vaca Muerta region, where the infrastructure for oil and gas development is in place (Deloitte, 2018).
2.3.3 China
China was identified in the US EIA 2011 study as potentially having the largest shale gas resource at over 34 TCM. China has a significant gas market, with local production supplemented by imports. The Chinese government has committed to developing the shale gas resource, and state oil and gas enterprises have made a major push to do so (Oil Peak, 2013). It is expected that Chinese shale gas will be a major contributor to the Chinese gas market (Qun et al., 2017), but gas imports continue.
South Africa
With the large potential resource for shale gas in South Africa, there was initial excitement about developing this resource (Petroleum Agency SA, 2013). The government allocated most of the Karoo basin for technical cooperation permits, whereby desktop studies and surveys could be conducted, but no exploration drilling (Van Der Spuy, 2013). It was expected that these technical cooperation permits would last one year before licence-holders could apply to move into an exploration licence. As a result of concerns raised about the effects that drilling and fracking operations would have on the fragile Karoo environment, the move to the exploration phase has been put on hold (DMR, no date). Only three licence-holders remain as indicated in the SAOGA Shale Gas Committee website (SAOGA, no date).
2.4.1 Environmental concerns
The concerns raised about the environmental risks of tracking mirror those of most countries considering shale gas developments (Netshishivhe, 2014). However, the specific conditions in the Karoo raise additional concerns (de Wit, 2011), given its ecological sensitivity. The greatest concern is about the impact on the water resources in a desert area. Drilling and fracking operations involve the use of large volumes of water and sourcing it is an issue (ASSAf, 2016). In addition, there is concern about contamination of water used for drinking and agriculture from the chemicals used in fracking fluids and from water produced with the shale gas. The government commissioned a study from CSIR to address the environmental issues and has created a task force with the South African Association of Science and the Academy of Engineering to review the readiness of the country to proceed with shale gas development (ASSAf, 2016). These concerns have slowed the issuing of rights to exploration and have led to the development of stringent regulatory requirements for these operations (DMR, 2015).
2.4.2 In-activity
The net effect of the concerns about these operations is a standstill on permitting exploration activities (Roelf, 2017). In addition, the government has decided that baseline surveys of water resources and other environmental aspects must be conducted prior to exploration commencing (Odendaal, 2016). The government, through the Council of Geoscience, is undertaking this baseline drilling (Council for Geoscience, 2020). As of 2020, the potential exploitation of South African shale gas is still in limbo. All of these external activities slow the process of development and add costs; however, these activities do not address the fundamental question of the basic economic viability of shale gas development. Because the advent of US shale gas has lowered the price of gas as much as it has, there is an assumption that shale gas in South Africa would also be available at equivalent low prices. This is the assumption that was made by the planning in the 2016 IRP (SA DoE, 2016). As many of the premises associated with shale gas in the USA and other places are not relevant for South Africa, this assumption of low cost should be tested.
3. Economic analysis
In 2016 the CSIR prepared an extensive analysis of the impacts and risks for shale gas development in the Karoo (Scholes, et al., 2016). Chapter One of the report laid out the steps towards a steady state development of the resource, as well as several development scenarios, including a small gas development and a big gas case (Burns et al., 2016). The first phase that CSIR identified was a period of studies to establish the baselines for air, water and environmental conditions prior to any drilling to ensure that effects related to shale gas drilling and production can be isolated. From the work programme laid out in the study, the cost of these baseline studies should be less than USD 10 million. None of these costs, though, can be projected with certainty.
Exploration phase
In the USA (as in other places with an established gas business) shale gas development did not go through an extensive exploration phase. Exploration was incremental to the development, where wells could be brought on production almost immediately. The Karoo would be a completely new development area and the exploration efforts prior to any development would need to be much more extensive. This is largely because greater knowledge of the geological formation is needed before extensive production drilling can begin. As discussed in the CSIR report, the process would consist of two-dimensional (2D) seismic surveys, reported to be about 2 000 km in total length, followed by three-dimensional (3D) seismic surveys over those areas of interest for production development. In the USA and Canada, a 2D seismic programme would cost about USD 10 000 /km (Hunt, 2015). For a once-off seismic programme in South Africa (along with all imported equipment), the cost would be more or less in the range of USD 15 000 /km (NETL, 2013). Based on these estimates, the cost of the 2 000 km programme would be approximately USD 60 million.
As indicated in the CSIR study, this 2D programme would be followed by 3D analysis covering the areas of interest in each leasehold area. The CSIR assumes that about 5% of the surveyed area would be considered for additional survey work. The 3D programme would be expected to cost in the range of USD 75 000 /km3 (NETL, 2013). Assuming that the area covered is 500 /km3 in each licence area of interest, this would imply a cost of USD 37 500 000 for the second seismic programme for each leaseholder.
Between data collection, data processing and analysis, these programmes would each take approximately one year. Therefore, it can be assumed that the seismic phase of the exploration programme would take two years.
The next step would be drilling exploration and appraisal of wells. Vertical wells would be drilled first, followed by wells with horizontal sections and, finally, wells with hydraulic fracturing. The estimate is that 24 wells would be required for an operator to delineate the shale resources in its leasehold and identify the 'sweet spots' for initial development (Burns et al., 2016). The last phase of the exploration effort would be to conduct three to six production tests for a limited number of wells. The wells would be drilled, completed, and then attached to temporary production facilities to burn off the produced gas. Production tests would normally last thirty to sixty days (SAOGA, 2017).
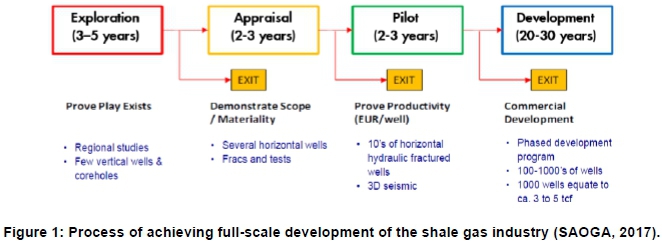
The total time involved for this effort would be a minimum of four years. Assuming that the operator leases and imports a rig specifically for this programme, it is estimated that the drilling cost will be USD 120 million per year (Rose & Associates, 2016). Given these assumptions, the exploration drilling and production programme would cost an operator a total of ± USD 450 million. Following this initial expenditure, the operator would know significantly more about the potential resource, including the size of the resource, drilling costs and initial production rates for a typical well (Burns et al., 2016). Nevertheless, it must be questioned if this will be compelling enough to convince oil and gas companies to proceed with a full-scale development. In a presentation to the South African government, the South African Oil and Gas Alliance (SAOGA) indicated that a pilot programme would be required before moving to full-scale development (SAOGA, 2017), as laid out in Figure 1.
3.2 Proof of concept and development phases
A likely option is to move from the exploration phase to a 'proof of concept' or pilot-type development. In this scenario, a group of wells - e.g. nominally six to ten (about one year to eighteen months of drilling) - would be developed, fracked and brought into production, with a local power plant generating ± 30 MW of base load power for consumption by the local region. This development would establish the flow capabilities of the shale gas wells and their long-term production viability. The power plant would operate long enough for the operator to become comfortable with the expected life of the shale gas wells.
Assuming the proof of concept phase indicates the wells to be economically viable and gives the go ahead for full-scale development; the next phase would be to implement a continual steady state development. This would likely start out somewhat smaller than the CSIR defined "small gas case" - a 550 well development scenario indicated in the CSIR analysis (Burns et al., 2016), but would still need to be large enough to keep a drilling rig occupied continuously. This is necessary to avoid the time and cost of rig mobilisation and importation for each drilling programme. If six wells per year are assumed for one drilling rig, at USD 20 million per well, the annual cost would be USD 120 million for drilling and completion (Rose & Associates, 2016). Assuming a first year average daily production rate of 5 000 GJ per well, based on the expected ultimate recovery (EUR) per well of 114 MCM (Burns et al., 2016), this would imply production of 24 PJ per year of gas, enough to produce 2.4 TWh of electricity in an open cycle gas turbine plant. If this power is to be used in a dispatchable mode, buffer storage for ten or more days' use, or at least 600 TJ, must be included in the cost structure. Full development of the shale gas would indicate that some multiple of this steady state development be implemented. The CSIR small gas case assumes that three of these modules would be implemented (Burns et al., 2016).
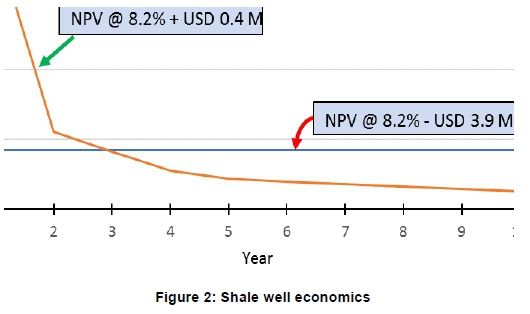
3.3 Individual well economics
The production profile of a typical shale gas well shows a high rate of production for some months after completion, followed by a very rapid decline, in the range of 70-80%, in the first year or two (Guo et al., 2016). The production rate then moves into a tail period that continues along a less significant decline that lasts for ten to twenty years (Murphy, 2016). From an economical perspective this is an attractive profile, as it leads to quick recovery of costs and a maximisation of the time value of money. However, the production profile is not one conducive to fuel for power generation. If the profile for a well is regulated to steady state over a ten-year productive life, the economics of a well would become unacceptable. This effect is indicated in Figure 2.
3.4 Economics of steady state development
The economics of shale gas production would not be optimal until it gets to the scale where a drilling rig is being utilised full-time (avoiding significant mobilisation costs) and wells are immediately put into production when they are completed. The development must also be large enough to allow the wells to be produced to their full extent and have their production replaced by new wells as they decline. Assuming a timing of two months to drill and complete a well, one rig would drill about six wells per year (US EIA, 2016). This should bring steady state production to 24 PJ per year by the eighth year of the development and the plateau would be main
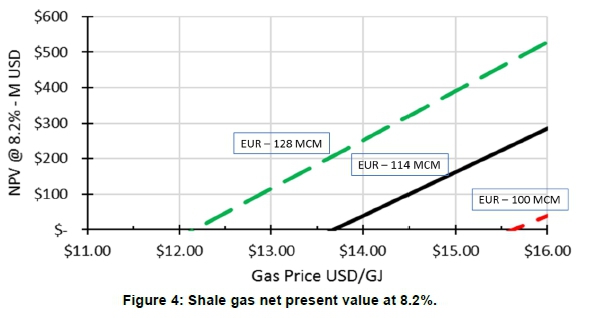
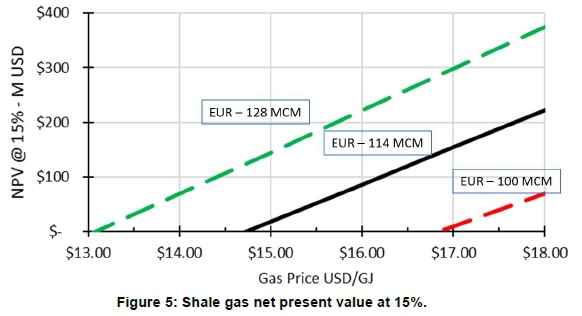
tained as long as the pace of drilling keeps up with the displacement of depleted wells. Figure 3 shows a 20-year development programme, after which production drops off quickly. Assuming an ultimate recovery per well of 114 MCM, with a first-year production rate of 5 000 GJ per well, the breakeven income required for this steady state development programme would be in the range of USD 13.7 /GJ, assuming a cost of capital of 8.2% (Figure 4). If the ultimate recovery per well was 100 MCM and initial rate lowered proportionally, this would raise the breakeven price from USD 13.7 /GJ to USD 15.5 /GJ. Due to the risks associated with oil and gas developments, no investor is likely to invest in a project that only returns the cost of capital. For oil and gas developments, a breakeven price assuming a 15% discount factor is the norm in the industry. This would raise the required breakeven price from USD 13.7 /GJ to USD 14.7 /GJ, as shown in Figure 5. The operator must also make provisions to recover the sunk costs that have occurred through the exploration and pilot development phases. This compares to a 2014 estimate by Wood Mackenzie of a breakeven cost of USD 11.87 /GJ (Fakir, 2015). Unfortunately, Wood Mackenzie did not publish their assumptions or indicate if a sensitivity analysis had been performed.

3.5 Timing of steady state development
With a one year pre-exploration programme, as well as four years of exploration work and at least three years of a proof-of-concept test development, the earliest that one could expect the steady state development to begin would be at least ten years from the programme commencement. However, with the expected review and approval processes, each phase of the exploration and development would probably take much longer (SAOGA, 2017).
4. Risk factors
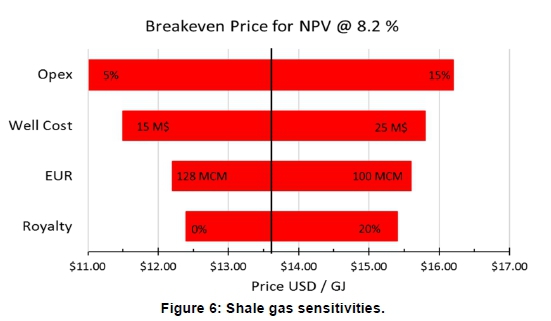
There is significant variability in some of the factors, which could have a major impact on the economics of the development of this resource. As there is no actual information from the Karoo about the current resource, what can be assumed is based on experiences from other shale developments -particularly those in the USA. There is potential for major differences that could impact the local analysis. For this sensitivity, the following parameters were reviewed:
• Well cost - USD 15-25 million.
• Expected ultimate recovery - 100 to 128 MCM.
• Opex - 5-15% of well cost per year.
• Royalty - 5-30%.
As can be seen in the tornado diagram in Figure 6, each of these parameters has a major impact.
4.1 Recovery per well - expected ultimate recovery
The amount of production that can be derived from each well will be one of the major factors in the economic performance of shale gas development. Nevertheless, as the performance of a typical well will be established, due to geological variability the production from a particular well will not be known until it is drilled. The CSIR assumed 114 MCM per well production, based on the averages attained for the Barnett and the Marcellus shales in the USA (Burns et al., 2016). While there is no proof that the geology of those basins is comparable to the Karoo shale basins, there is a good base of data for calculating costs due to the large number of wells drilled there. If the EUR per well is reduced to 100 MCM, the breakeven price is raised by over USD 1.00 /GJ.
The USA shale gas production history offers significant inferences into what might be expected. While production per well has increased over time, this has only come after a large number of wells have been drilled. In the Marcellus shale fields, over 14 000 wells have been drilled. Expected EURs per well have increased to above 114 MCM (Murphy, 2016). In an analysis in 2013, the US EIA showed an average range in shale basins from 30-90 MCM (Smythe, 2017).
4.2 Cost per well
Because of the large numbers of wells that must be drilled to maintain shale gas production, the cost of each well is a critical factor in the economics of shale gas production. The estimate used for this analysis was USD 20 million per well for drilling and completion (including fracking costs) (Rose & Associates, 2016). In the US, these costs have been reduced to less than USD 10 million per well in most shale basins. This is mostly due to reductions of drilling and completion times, benefitting from the experience of the large number of other wells being drilled and completed. It is estimated that over 130 000 oil and gas wells had been drilled in the USA between 2010 and 2017 (Meko and Karklis, 2017) with about 95% of them being fracked and over half of these into shale formations (US EIA, 2018c). In the USA, the costs are also minimised by the drilling rigs and the fracking setups being optimised for the given location (US EIA, 2016). This is possible due to the large number of drilling rigs and fracking equipment available on call for any operation. In smaller markets, it is necessary to use a rig and have equipment to meet whatever might arise or to limit the output of the well to what can be achieved with the equipment used.
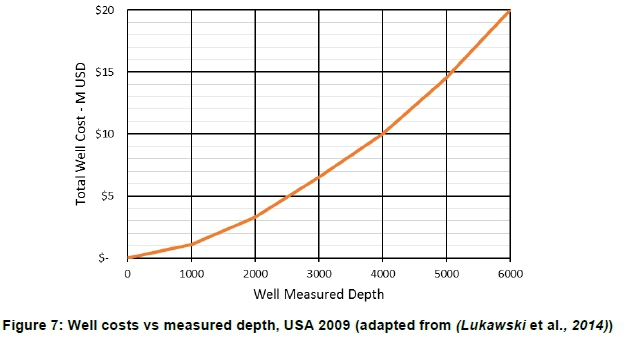
Costs to drill and complete wells is also a function of depth plus the length of horizontal section, with the size for the completion related to the length of the horizontal section. The cost/ depth relationship is not linear but increases with depth (Lukawski et al., 2014) as shown in Figure 8. As the target for the South African shales is in the 2 000-3 500 m range and the intent is to maximise productivity per well (implying longer horizontal sections), higher well costs can be expected. In Argentina, drilling and completion costs are about twice those of the costs in the USA (Deloitte, 2018). In Australia, similar costs were seen (Zuhairi, 2013). These are both areas with an established oil and gas business.
One factor that has not been addressed in any of these cases is the cost of water for well drilling and fracking operations. In an analysis of the replication of the USA experience to Europe and China, Minh-Thong Le found that the cost of water was one of the most significant cost issues, with water being ten times more expensive in shale drilling in Europe than in the USA (Le, 2018). While there is significant experimental work being done in waterless frack-ing operations around the world, water-based fracking is the standard.
4.3 Operating cost - water disposal
Direct operating costs for gas wells in the USA are in general between USD 1 /GJ and USD 2 /GJ (US EIA, 2016) or USD 4-8 million over the life of a well. However, the cost of disposal of produced water can be quite significant. In a study for the US EIA, it was estimated that the cost of water disposal averaged about 42 % of the overall operating costs of wells in the USA (US EIA, 2016).
Water produced along with shale gas is of significant concern (Dunne, 2017)(Veil, 2015). A study by Duke University of oil and gas production in the USA indicated that the production of water from gas wells averages 0.6 L/m3 of gas (Kondash et al., 2016). Assuming the EUR of 114 MCM of gas from a well, this would imply a production of 62 000 m3 of formation water from an average well. For the development analysed here, one hundred and twenty wells would require the disposal of about 7.4 x 10⁶m3 of water, equivalent to almost 3000 Olympic-size swimming pools. The few exploration wells drilled into the shales in the Karoo have found significant levels of deep saline water reservoirs in the areas where shale gas should be produced. Given this, there is every expectation that shale gas production in South Africa would also contain high salinity formation water that follows fracking, as has been the experience from the USA so far. (Enslin et al., 2019).
The latest results from deep drilling by the Council for Geoscience has indicated that there is likely a deep freshwater aquifer in the Karoo which must be taken into account in fracking considerations (Council for Geoscience, 2020). While fracking operations will not likely have any effect on shallow freshwater zones, deep zones might require a different analysis.
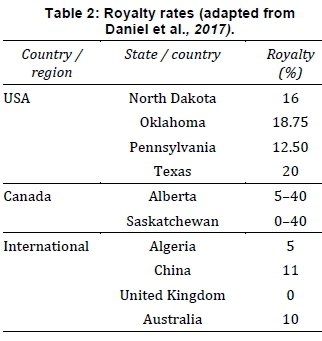
4.4 Royalty or government share
The economic dynamics of shale gas production in South Africa will also be influenced by carry and royalty policy being considered for the oil and gas sector (the legislative framework has not yet been finalised). The industry views the proposed carry and royalty regime as being onerous and has indicated that the current proposals will make shale gas economics unworkable. As can be seen from Figure 6, the royalty rate is one of the major factors in determining the cost of developing shale gas with a range of over USD 3 /GJ between no royalty and 20% royalty. Government carries vary from 5 - 40 % of the production around the world (Daniel et al., 2017). In the USA, they are generally in the 10 - 15 % range, as indicated in Table 2. In Canada, a sliding scale royalty is preferred.
Finding a balance between an equitable government share and one that does not discourage investment is a major challenge for a potentially successful shale gas business. One further consideration likely to boost the cost of gas production is that, while the government owns the subsurface rights, the surface rights are held in private hands. Negotiating with each landowner for access will increase transaction costs.
5. Continued interest of participants
Delays in approving licences for the exploration phase and the changed conditions in the gas market raise some doubt about whether there is as strong an appetite for pursuing this shale gas opportunity as there was when the licences were first issued.
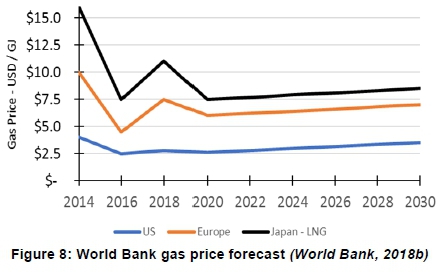
5.1 Saturated world gas markets
In 2011, the world gas market appeared to need additional production to be balanced. World gas prices were high and there was a growing difference or arbitrage between US gas prices due to
shale gas development and other markets that depend on LNG imports or piped gas (US EIA, 2018e). This difference peaked in 2009, with LNG delivered to Japan at USD 15 /GJ and the US Henry Hub price of less than USD 3 (British Petroleum, 2017). Since that time, sixteen LNG export projects have been constructed, adding 75 MTPA to the market (International Gas Union, 2017). World LNG prices have come into reasonable alignment along the lines of Henry Hub pricing plus liquefaction and shipping (Pedersen, 2017). Bloomberg concluded that the world gas market is currently over-supplied by 29% (Bloomberg New Energy Finance, 2018). The World Bank forecasts that the market will be over-supplied until at least 2030 (World Bank, 2018b). The World Bank gas market forecasts are shown in Figure 8.
5.2 Resource challenge
Several local studies were performed in an attempt to further define the resource size for Karoo shale gas. The studies have concluded that the US EIA estimate may be quite optimistic due to local geological conditions, and that the likely resource size is more on the order of 0.8-1.4 TCM (Scholes et al., 2016). Further studies have indicated that the recoverable shale gas from the Karoo could be as low as 0.37 TCM (De Kock et al., 2018). While this is likely to be on the low end, based on pessimistic assumption, many questions remain about the size and commerciality of this resource.
6. Conclusion
There has been significant negative pressure from environmental groups and Karoo farmers' associations, along with other groups, against shale development in the Karoo. In addition, there are questions about the readiness of South Africa to proceed with shale gas development (Scholes et al., 2016; ASSAf, 2016). While a cautious approach is being taken by the South African government regarding shale gas development, there is some merit in allowing trial exploration efforts to proceed, in order to establish the value of the potential resource, as this can only be defined after some exploration. However, an aggressive pursuit by companies is unlikely. The earlier interest in shale gas development decreased, given global prices and the potential high cost of production in the South African context. International gas prices are currently below USD 10 /GJ and are expected to stay below this price through at least 2030 (World Bank, 2018b). Unless costs are found to be significantly lower than expected, and the resource per well much larger than estimated, it is unlikely that activities will move beyond exploration.
For long-term planning purposes, it cannot be assumed that South African shale gas will ever be a factor in the supply of gas to the local or international power market. The timing of a potential development would be too far into the future for it to be considered. In addition, the potential for the cost of the gas to be economically competitive is too low to depend on this resource. For planning purposes, this must be considered as a strictly contingent resource.
For dispatchable power generation in South Africa there are potential gas sources that could meet needs, rather than shale gas development, and likely at significantly lower costs (Clark et al., 2020). In Mozambique, there has been an offshore gas discovery that is one of the largest in the world. This gas can be brought into South Africa, depending on market development, as LNG or by pipeline. In addition, in 2019 a gas discovery was made in the waters off Mossel Bay, in the Brulpadda field. The group of fields in this area is estimated to contain resources around 170 BCM of gas, plus condensates. While the cost per well for that development will likely be five times the cost of shale wells, the production per well should be more than 90 times the production from a typical shale well. Therefore, the economics of this gas should be much better than shale gas development (Clark et al., 2019). The value of the condensates from these wells also improves their economics. These gas supply alternatives will make shale gas development less attractive.
Author contributions
S. Clark: Formulation and execution of research, data analysis and write-up.
J. van Niekerk, J. Petrie: Research formulation and supervision
S. Fakir: Background expertise, quality assurance and editorial input in write-up
References
Academy of Science of South Africa (2016) South Áfricas Technical Readiness to Support the Shale Gas Industry. Pretoria. Available at: http://research.assaf.org.za/handle/20.500.11911/14. [ Links ]
Advanced Resouces International (2013) EIA /ARI World Shale Gas and Shale Oil Resource Assessment. Available at: https://www.adv-res.com/pdf/A_EIA_ARI_2013_World_Shale_Gas_and_Shale_Oil_Resource_Assessment.pdf. [ Links ]
Bloomberg New Energy Finance (2018) Global LNG Outlook 1H2018. Available at: https://www.facebook.com/BloombergNEF/photos/our-1h-2018-lng-outlook-examines-the-latest-trends-in-the-global-lng-market-iden/978170315693205 (Accessed: 20 September 2020). [ Links ]
Brandt, R. and Gomes, I. (2016) Unconventional Gas in Argentina: Will it become a Game Changer? Oxford, UK. Available at: https://www.oxfordenergy.org/publications/unconventional-gas-argentina-will-become-game-changer/. [ Links ]
British Petroleum (2017) BP Statistical Review of World Energy 2017, British Petroleum. doi: http://www.bp.com/content/dam/bp/en/corporate/pdf/energy-economics/statistical-review-2017/bp-statistical-review-of-world-energy-2017-full-report.pdf. [ Links ]
Burns, M.. Atkinson, D., Barker, O., Davis, C., Day, L., Esterhuyse, S., Hobbs, P., McLachlan, I., Rossouw, N., Todd, S., Snyman-Van der Walt, L., Van Huyssteen, E (2016) Scenarios and activities (Chapter 1). PRETORIA. Available at: http://seasgd.csir.co.za/wp-content/uploads/2016/06/3_Shale-Gas-Assessment_SOD_-Ch1_Scenarios-Activities_optimize.pdf. [ Links ]
Clark, S., Van Niekerk, J. and Petrie, J. (2019) Brulpadda - Game Changer?SANEA. Available at: https://www.facebook.com/events/city-of-cape-town-energy-head-office-bloemhof-bloemhof-street-belville/brulpadda-a-game-changer/308643390008590/ (Accessed: 1 July 2020). [ Links ]
Clark, S., Van Niekerk, J. and Petrie, J. (2020) The Use of Natural Gas to Facilitate the Transition to Renewable Electric Power Generation in South Africa. Stellenbosch University. Available at: https://scholar.sun.ac.za/handle/10019.1/109312. [ Links ]
Core Energy Group (2015) Gas Production and Transmission Costs Eastern and South Eastern Australia. Available at: https://aemo.com.au/-/media/Files/Gas/National_Planning_and_Forecasting/GSOO/2015/Core--Gas-Production-and-Transmission-Costs.ashx. [ Links ]
Council for Geoscience (2020) The Karoo Deep Drilling Project. Available at: https://www.geoscience.org.za/index.php/projects-footer/754-the-karoo-deep-drilling-project (Accessed: 15 November 2020). [ Links ]
Creamer, T. (2015) Ressano Garcias gas-to-power capacity rises to 400 MW as loop-line is completed, Engineering News, March. Available at: https://www.engineeringnews.co.za/article/ressano-garcias-gas-to-power-capacity-rises-to-400-mw-as-loop-line-is-completed-2015-03-05/rep_id:4136. [ Links ]
Daniel, P., Krupnick, A., Matheson, T., Mullins, P., Parry, I., Swistak, A., (2017) How Should Shale Gas Extraction Be Taxed? Available at: https://www.imf.org/en/Publications/WP/Issues/2017/11/16/How-Should-Shale-Gas-Extraction-Be-Taxed-45410. [ Links ]
DEE (2017) Australian Energy Update 2017. Canberra: Australian Government Department of the Environment and Energy. [ Links ]
DeKock, M., Beukes, N., Adeniyi, E., Cole, D., Gotz, A., Geel, C., Ossa, F (2018) Deflating the shale gas potential of South Africas Main Karoo basin, South African Journal of Science, 3, pp. 1-13. Available at: https://www.sajs.co.za/article/view/4125. [ Links ]
Deloitte (2018) Exploration and production snapshots: Argentina Clearing a path for growth. Available at: https://www2.deloitte.com/us/en/pages/energy-and-resources/articles/exploration-and-production-in-argentina.html. [ Links ]
Department of Mineral Resources (2012) Executive Summary Investigation of Hydraulic Fracturing in the Karoo Basin of South Africa. Available at: https://www.gov.za/sites/default/files/gcis_document/201409/investigationhydraulicfracturingkaroobasinsaexecutivesummary.pdf. [ Links ]
Dunne, J. (2017) Flowback and Produced Waters: Opportunities and Challenges for Innovation: Proceedings of a Workshop. The National Academies Press. doi: 10.17226/24620. [ Links ]
Enslin, S., Beukes, N., DeKock, M., Wagner, N., Webb, S (2019) Shale gas in the Karoo Basin: An opportunity missed or a future prospect?, in 16th SAGA Biennial Conference & Exhibition 2019. Available at: https://www.researchgate.net/publication/340834283_Shale_gas_in_the_Karoo_Basin_An_opportunity_missed_or_a_future_prospect. [ Links ]
Fakir, S. (2015) Climate and Energy Framework to Assess the Economic Reality of Shale Gas in South Africa. PRETORIA. Available at: https://www.wwf.org.za/?13341/Framework-to-assess-the-economic-reality-of-shale-gas-in-South-Africa. [ Links ]
Guo, K. , Zhang, B., Aleklett, K., Höök, M. (2016) Production Patterns of Eagle Ford Shale Gas : Decline Curve Analysis Using 1084 Wells, Sustainability, pp. 1-13. doi: 10.3390/su8100973. [ Links ]
Hunt, L. (2015) Articulating the time, cost, and benefits of a seismic processing project, Recorder - Official publication of the Canadian Society of Exploration Geophysicists, pp. 1-11. Available at: https://csegrecorder.com/articles/view/articulating-the-time-cost-and-benefits-of-a-seismic-processing-project. [ Links ]
International Gas Union (2017) World LNG Report, International Gas Union (IGU). doi: 10.1017/CBO9781107415324.004. [ Links ]
Kondash, A. J., Albright, E. and Vengosh, A. (2016) Quantity of flowback and produced waters from unconventional oil and gas exploration, Science of the Total Environment, 574, pp. 314-321. Available at: https://doi.org/10.1016/j.scitotenv.2016.09.069. [ Links ]
Kuuskraa, V. , Stevens, S., van Leeuwen, T., Moode, K. (2011) World Shale Gas Resources: An Initial Assessment of 14 Regions Outside the United States. Washington, DC. doi: 10.1371/journal.pone.0089210. [ Links ]
Le, M. (2018) An assessment of the potential for the development of the shale gas industry in countries outside of North America, Heliyon, (November 2017), p. e00516. doi: 10.1016/j.heliyon.2018.e00516. [ Links ]
Lukawski, M. Z. , Anderson, B., Augustine, C., Capuano, L., Beckers, K., Livesay, B., Tester, J. (2014) Cost analysis of oil, gas, and geothermal well drilling, Journal of Petroleum Science and Engineering, 118, pp. 1-14. doi: 10.1016/j.petrol.2014.03.012. [ Links ]
Meko, T. and Karklis, L. (2017) The United States of oil and gas, Washington Post. Available at: https://www.washingtonpost.com/graphics/national/united-states-of-oil/. [ Links ]
Motiang, M. and Nembahe, R. (2017) 2017South African Energy Price Report. Pretoria. Available at: http://www.energy.gov.za/files/media/explained/Energy-Price-Report-2017.pdf. [ Links ]
Murphy, T. (2016) U.S. shale gas trends - economic and global implications, Journal of Physics: Conference Series 745. doi: 10.1088/1742-6596/745/2/022004. [ Links ]
NETL (2013) Summary of Costs Associated with Seismic Data Acquisition and Processing. Available at: https://netl.doe.gov/projects/files/FY13_SummaryofCostsAssociatedwithSeismicDataAcquisitionandProcessing_041213.pdf. [ Links ]
Netshishivhe, S. (2014) The Karoo Fracking Scenario: Can Development and Environmental Wellbeing Coexist , or Must One of Them Prevail?, Africa Institute of South Africa, (109), pp. 1-6. Available at: https://www.africaportal.org/publications/the-karoo-fracking-scenario-can-development-and-environmental-wellbeing-coexist-or-must-one-of-them-prevail/. [ Links ]
Odendaal, N. (2016) South Africa needs more shale gas data - report, Engineering News. Available at: https://www.engineeringnews.co.za/article/south-africa-needs-more-shale-gas-data-report-2016-10-12. [ Links ]
OECD (2018) Taxing Energy Use 2018 - South Africa. doi: 10.1787/9789264289635-en. [ Links ]
Office of Director for Commodity Market (2018) Trend of the price of spot LNG. Tokyo, Japan. [ Links ]
Oil Peak (2013) Chinas Shale Gas Dream, Oil Peak. Available at: http://www.endofcrudeoil.com/2013/03/chinas-shale-gas-dream.html (Accessed: 20 September 2020). [ Links ]
Pedersen, C. (2017) U.S. LNG: a Benchmark for the Future. Available at: https://www.spglobal.com/en/research-insights/articles/US-LNG-a-Benchmark-For-The-Future (Accessed: 17 February 2021). [ Links ]
Petroleum Agency SA - Overview (2013) PASA. Available at: https://www.petroleumagencysa.com/index.php/petroleum-geology-resources/overview (Accessed: 20 September 2020). [ Links ]
Qun, Z. , Shen, Y., Hongyan, W., Nan, W., Dexun, L., Honglin, L.(2017) Prediction of marine shale gas production in South China based on drilling workload analysis, Natural Gas Industry B, 3(6), pp. 545-551. doi: 10.1016/j.ngib.2017.05.004. [ Links ]
Roelf, W. (2017) South Africa commits to shale gas despite adverse court ruling, reuters, October. Available at: https://www.reuters.com/article/us-safrica-shale/south-africa-commits-to-shale-gas-despite-adverse-court-ruling-idUSKBN1CO0XV. [ Links ]
Rompco (2020) Rompco Historical Milestones. Available at: https://www.rompco.co.za/historical-milestones (Accessed: 20 September 2020). [ Links ]
Rose & Associates (2016) The Current Costsfor Drilling a Shale Well. Houston, Tx. Available at: http://www.roseassoc.com/the-current-costs-for-drilling-a-shale-well/ (Accessed: 2 September 2020). [ Links ]
SA Department of Mineral Resources (2015) Regulations for Petroleum Exploration and Production. South Africa. Available at: https://www.gov.za/sites/default/files/gcis_document/201506/38855rg10444gon466.pdf. [ Links ]
SA DoE (2016) Integrated Resiource Plan Update 2016. Pretoria. Available at: http://www.energy.gov.za/IRP/2016/Draft-IRP-2016-Assumptions-Base-Case-and-Observations-Revision1.pdf. [ Links ]
SA DoE (2018) Integrated Resources Plan for South Africa (2018), Department of Energy, South Africa. Available at: http://www.energy.gov.za/IRP/irp-update-draft-report2018/IRP-Update-2018-Draft-for-Comments.pdf. [ Links ]
SAOGA (2017) Overview of the Onshore Shale Gas Industry and key implications for the MPRDA. SAOGA. Available at: https://static.pmg.org.za/170613SAOGA.pdf (Accessed: 20 September 2020). [ Links ]
SAOGA (no date) Shale Gas Committee, SAOGA. Available at: https://www.saoga.org.za/web/projects/shale-gas-committee (Accessed: 20 September 2020) [ Links ]
Saussay, A. (2018) Can the US shale revolution be duplicated in continental Europe ? An economic analysis of European shale gas resources, Energy Economics, 69, pp. 295-306. doi: 10.1016/j.eneco.2017.10.002. [ Links ]
Scholes, R., Lochner, P., Schreiner, G., Snyman-Van der Walt, L., de Jager, M. (eds.) (2016) Shale Gas Development in the Central Karoo: A Scientific Assessment of the Opportunities and Risks. PRETORIA. [ Links ]
Smythe, D. (2017) US unconventional gas plays: Estimated Ultimate Recovery ( EUR ). Glasgow. doi: 10.13140/RG.2.2.30045.61926. [ Links ]
Van Der Spuy, D. (2013) Natural gas in South Africa - production and exploration, PASA presentation. Tran, J. (2002) Energy In A Cubic Meter Of Natural Gas, Pysics Factbook. Available at: https://hypertextbook.com/facts/2002/JanyTran.shtml#:~:text=The_amount_of_energy_of_energy_content_of_natural_gas. (Accessed: 20 September 2020). [ Links ]
US EIA (2016) Trends in U.S. Oil and Natural Gas Upstream Costs. Available at: https://www.eia.gov/analysis/studies/drilling/. [ Links ]
US EIA (2018a) Frequently Asked Questions - What is U. S. electricity generation by energy source? Available at: https://www.eia.gov/tools/faqs/faq.php?id=427&t=3#:~:text=About_63%25_of_this_electricity_was_from_renewable_energy_sources. (Accessed: 1 January 2019). [ Links ]
US EIA (2018b) Henry Hub Natural Gas Spot Price. Available at: https://www.eia.gov/dnav/ng/hist/rngwhhdD.htm (Accessed: 20 September 2020). [ Links ]
US EIA (2018c) Hydraulically fractured horizontal wells account for most new oil and natural gas wells. Available at: https://www.eia.gov/todayinenergy/detail.php?id=34732#:~:text=Hydraulically_fractured_horizontal_wells_account_for_most_new_oil_and_natural_gas_wells,-Source%3AU.S.Energy&text=In2016%2C_hydraulically_fractured_horizontal_the_total_linear_footage_drille. [ Links ]
US EIA (2018d) Monthly dry shale gas production. Available at: https://www.eia.gov/naturalgas/weekly/img/202008_monthly_dry_shale.png (Accessed: 1 January 2019). [ Links ]
US EIA (2018e) U.S. Natural Gas Total Consumption. Available at: https://www.eia.gov/dnav/ng/hist/n9140us2A.htm (Accessed: 1 January 2019). [ Links ]
US EIA (2018f) US EIA SAS - Table 4.2.A. Existing Net Summer Capacity by Energy Source and Producer Type. Available at: https://www.eia.gov/electricity/annual/html/epa_04_02_a.html. [ Links ]
US EIA (no date) How much coal, natural gas, or petroleum is used to generate a kilowatthour of electricity? Available at: https://www.eia.gov/tools/faqs/faq.php?id=667&t=6 (Accessed: 20 September 2020). [ Links ]
Veil, J. (2015) U. S. Produced Water Volumes and Management Practices in 2012. Available at: http://www.veilenvironmental.com/publications/pw/prod_water_volume_2012.pdf. [ Links ]
Villiers, J. (2019) PetroSA says its Mossel Bay plant will run out of gas by December 2020 - placing 1,500 jobs at risk, Business Insider SA, 2 October. Available at: https://www.businessinsider.co.za/central-energy-fund-petrosa-mosselbay-gas-to-liquid-refinery-natural-gas-jobs-department-of-energy-2019-9. [ Links ]
de Wit, M. J. (2011) The great shale debate in the Karoo, South Africa Journal of Science, 107, pp. 1-9. doi: 10.4102/sajs.v107i7/8.791. [ Links ]
World Bank (2018a) Electricity production from natural gas, The World Bank data. Available at: http://data.worldbank.org/indicator/EG.ELC.NGAS.ZS (Accessed: 20 September 2020). [ Links ]
World Bank (2018b) World Bank Commodities Price Forecast (nominal US dollars). Available at: http://pubdocs.worldbank.org/en/823461540394173663/CMO-October-2018-Forecasts.pdf (Accessed: 20 September 2020). [ Links ]
YCharts (2018) European Union Natural Gas Import Price: May 2018, World Bank. Available at: https://ycharts.com/indicators/europe_natural_gas_price (Accessed: 1 January 2019). [ Links ]
Zuhairi, M. A. (2013) An evaluation of medium to long-term shale gas production costs in Australia, UCL, p. 2013. [ Links ]
* Corresponding author: Tel.: +27 (0)76 855 7685; email: sclark@sun.ac.za
1 The price for diesel for power generation in South Africa is the basic fuel price (BFP) plus approximately ZAR 0.4 per liter to cover customs & excise plus a pipeline duty (OECD, 2018). BFP is based on international oil price plus refining and delivery costs (Motiang and Nembahe, 2017). Using 13% above Brent oil price of USD 80 /barrel, this gives a BFP price of approximately ZAR 9 /L (as compared to the road use price of ZAR 15 /L). With an energy content for diesel of 0.38 GJ/L. the cost of diesel is ± ZAR 230 /GJ or USD 16 /GJ.

