


Services on Demand
Article
 English (pdf)
 Article in xml format
 Article references
Indicators

Related links
-
 Cited by Google
 -
 Similars in Google
Share

 Permalink
Journal of Energy in Southern Africa
On-line version ISSN 2413-3051
Print version ISSN 1021-447X
J. energy South. Afr. vol.32 n.1 Cape Town Feb. 2021
http://dx.doi.org/10.17159/2413-3051/2021/v32i1a8086
ARTICLES
Solid fuel use in electrified low-income residential areas in South Africa: The case of KwaDela, Mpumalanga
N.C. NkosiI, *; R.P. BurgerI; N.R. MatandirotyaII; C. PauwII; S.J. PikethI
IUnit for Environmental Sciences and Management, North West University, Potchefstroom, South Africa
IINOVA Institute, Pretoria, South Africa
ABSTRACT
Domestic solid fuel combustion remains a key contributor to indoor and ambient air pollution in low-income settlements. Understanding solid-fuel cost perceptions and burning patterns variability is required for developing sustainable energy policies and applicable site-specific intervention strategies to effectively improve ambient air quality. The purpose of the study was to understand domestic solid fuel use dynamics and trends in KwaDela, a low-income residential area in Mpumalanga. Data were gathered using surveys, questionnaires, observations, and temperature sensors. Findings were that there are two main local sources of wood and coal within the settlement and each household was estimated to consume 1 800 to 2 992.5 kg of coal annually. The maximum amount of coal used per burning event was 9.3 kg, with an average of 4 kg and a standard deviation of ±2.5 kg. Coal and wood purchase price varied depending on their sources, but were cheaper than electricity. In winter, the burning events are longer (four to six hours) than in summer and more (one to three) per day, and start earlier (from 03:00 and 15:30) mainly due to space-heating needs. Cooking, space-heating and boiling water are the major household needs that drive the use of solid fuels in electrified low-income residential areas. The key to improving air quality in such areas is integrating fuel use intervention methods that the residents can afford and are readily accessible.
Highlights
• Burning events are longer in winter than summer.
• Solid fuels are affordable, available, and easily accessible.
• Electricity remains sparsely used for domestic purposes.
Keywords: air pollution; domestic burning; burning events; energy costs
1. Introduction
Domestic solid fuel combustion remains a key contributor to both ambient and indoor air pollution in low-income settlements, where households mostly rely on solid fuels to meet their energy requirements. An estimated 50% or more of the total energy used in such households is allocated for cooking and space-heating (Johnson & Bryden, 2012; Simões et al., 2016), with previous studies indicating that domestic solid fuel combustion in low-income areas is usually done in inefficient cast-iron stoves and braziers that emit several gaseous pollutants and fine particulate matter (PM) (Patarasuk et al., 2016; Makonese et al., 2017). The amount of fine PM (PM10, PM2.5) emitted from coal-burning using traditional cast-iron stoves and braziers ranges from 6.8-13.5 g/kg of fuel burned and 1.3-3.3 g. MJ-1of energy produced (Makonese et al., 2017; Nkosi et al., 2018). These emissions occur at breathing level, and therefore may increase chances of contracting respiratory (asthma) and cardiovascular-related diseases.
Globally, emissions from domestic combustion of solid fuels were one of the top health risk factors, accounting for an estimated 3.8 million premature deaths in 2016 (WHO, 2018), with the African region contributing 739 000 deaths (WHO, 2018). On the other hand, in South Africa fine particulate matter was estimated to have caused an estimated 1 800 premature deaths though PM measurements were 3-4 times higher than the Global Burden of Disease estimates (Alteiri & Keen, 2016). The Greenpeace Southeast Asia 2020 report estimated that 13 000 premature deaths in South Africa resulted from poor ambient air quality due to the burning of fossil fuels (Farrow et al., 2020). A source apportionment study done in KwaDela (in Mpumalanga, South Africa) reported domestic solid fuel use as a major source of PM ambient concentrations, contributing up to 59.89% of coarse (PM10) and 58.67% of fine PM (PM2.5) (Van den Berg, 2015). In Sebokeng, a township in Gauteng, domestic burning is accountable for approximately 84% of annual ambient fine PM concentrations (Scorgie et al., 2003). Furthermore, in a study in KwaGuqa and Doornkop investigating the challenges towards achieving a successful transition to a low-carbon economy reported electricity unit costs as one of the main barriers (Mdluli & Vogel, 2010). Despite 97.10% of the KwaDela settlement being electrified, about 76% of the population continue to use solid fuels (Wernecke et al., 2015). Setting up an electricity supply grid in a residential area where the residents cannot afford to buy it makes electricity available but does not give the residents access. At a household scale, costs associated with solid fuel use include time, money (fuel price and transportation) and labour, while for electricity it is mostly the electrical units and appliances (Eskom, 2017). Low-income residents cannot afford to use electricity to meet all their energy needs throughout the month. For instance, the average monthly household income in KwaDela is ZAR 1500.00, with an average of four people per household; and even with an increase in monthly income, the residents are likely to increase their budget on food and clothing before allocating money for household energy needs (Wernecke et al., 2015, Patarasuk et al., 2016).
This study presents solid fuel use dynamics and trends in KwaDela, a low-income electrified residential area in Mpumalanga, South Africa. Objective one identifies (i) solid fuel sources, (ii) the costs associated with different types of fuel, (iii) seasonal consumption at a household scale, and (iv) distribution networks. The second objective characterises solid fuel-burning events at a household and residential scale. Both objectives will identify major factors driving the continued use of solid fuels in the township. Furthermore, objective two will improve the understanding of daily and seasonal pollutant concentration profiles in the township. Empirical data is required when designing site-specific intervention strategies that will effectively reduce solid fuel use and emissions from domestic fuel combustion. This article has five sections. The next one discusses materials and methods; Section 3 gives the results of the study; Section 4 contains discussion of them; and Section 5 draws conclusions.
2. Materials and methods
This section provides an overview of the study area, data collection tools as well as the analysis procedures. KwaDela is a low-income residential settlement located in the Mpumalanga province of South Africa, in the district of Gert-Sibande, at coordinates of 26° 27' 44.64" S and 29° 39' 39.96" E. The low-income settlement is situated in a grassland biome, making wood a scarce resource. The common agricultural activity in the settlement is livestock production, focusing mostly on cattle, goats, sheep, and horses, with the lifestyle largely traditionally rural, with young boys herding livestock and girls collecting wood from the fields, while grandparents prepare meals for the afternoon and evening (It is the way of life for the community). Most of the residential dwellings in the settlement were constructed under the government-subsidised Reconstruction and Development Programme, and consist of two bedrooms and a kitchen. This settlement was chosen for the study because it exhibits all characteristics of a typical low-income residential settlement in South Africa, and it is also within the Highveld Priority Area. The Highveld Priority Area is a region characterised by high industrial and domestic emissions and forms one of the regions prioritised for emission reduction interventions.
2.2 Ethical considerations
The study underwent both scientific and independent ethical review. Ethical approval was obtained from the North-West University Health Research Ethics Committee (HREC) and provided with ethics number NWU-00066-13-A3. All participants received compensation that matched their degree of participation in the project and associated discomfort. This compensation was in the form of food vouchers, to minimise the potential impact on energy behaviour. All researchers involved in the study underwent ethics training. Access to the community was negotiated through multiple stakeholder consultation meetings. Fieldworkers from the community were recruited and trained to assist in data collection. To meet the study objectives, data collection involved both qualitative (survey questionnaire and observation) and quantitative (temperature sensors) research instruments.
2.3 Solid fuel survey
The solid fuel use survey responses provided an overview of the solid-fuel use and seasonal burning patterns at the township scale. However, surveys are subject to human error and detailed solid-fuel use information cannot be obtained from closed-response questionnaires. To compensate for that limitation, an observational study was conducted to gather detailed information about stove operation behaviour, determinants of household fuel choice, residents' perception of fuel cost, and cultural-social factors affecting solid-fuel use at a household level. To complement the survey and observation study, stove monitors were used to gather data on the burning events to capture their variability within a household. This removes uncertainties associated with burning event self-reporting. However, this method is also subject to bias and errors ( Ruiz-Mercado et al., 2012; Piedrahita et al., 2016) although it produces less bias than a survey and observations, due to the absence of an observer or investigator (Ruiz-Mercado et al., 2012; Pie-drahita et al., 2016). The advantage of integrating these methods is that it better represents solid fuel dynamics at a household scale.
A solid-fuel-use survey questionnaire was conducted with households in KwaDela being the target population. A stratified random sampling method was utilised to select a sample population to participate in the survey. The settlement was divided into subsections (strata), to ensure a sound spatial representation of the residential area. Participants were selected randomly from each stratum, with bigger subsections having correspondingly bigger sample sizes. A total of 207 residents participated in the survey. The survey focus-population included individuals who were mainly responsible for cooking. The survey comprised a predefined set of closed-response questions. It was interviewer-administered, and residents with at least a Grade 12 pass were trained to conduct one-on-one in-depth (46 pages) interviews in the local language (Zulu).
2.4 Solid fuel use observations
An uncontrolled observation study (June 2016) was conducted in KwaDela to obtain detailed descriptive information on burning patterns. The observation method used in the study shares similarities with the study completed by Granderson et al. (2009) (Granderson et al., 2009). The results from the observations were structured to provide clarification on the following: (i) household fuel consumption patterns; (ii) differences in fuel use and burning habits within the community; and (iii) how residents operate the stoves during a burning event. Ten sample houses were randomly selected from the questionnaire survey population. A global positioning system (GPS) was used to record the geographic coordinates of the ten sample houses. The observations utilised a predefined checklist to record burning event start and end times (morning and evening), type of fuel used, ignition method, refuelling patterns, and the purpose of a burning event. The observation study was cross-sectional and single day observations were undertaken at each household. Only the amount of fuel used for the burning event being observed was measured. The researcher was an outside observer not interfering with the burning event taking place or changing the residents' burning behaviour.
During or after the burning event, the observer asked predefined, open-ended questions to gather data about the household, main determinants for the choice of fuel used, source of fuel, monthly solid-fuel consumption, and traditional and cultural factors affecting stove use and perceptions of cost for modern versus traditional fuels. The amount of coal, wood and dung used in the morning and evening burning events were recorded to derive statistics on fuel usage.
Stove-use temperature monitors were used during the observations to confirm the burning event start- and end-times. The stove-use monitors were attached to the chimney to measure conducted heat from the chimney at a one-minute resolution for the duration of the observation day and the day following, to capture the evening burning event end time.
2.5 Monitoring stove activity
Kitchen and stove temperature sensors were deployed in 13 randomly selected houses in KwaDela. Summer (2014) and winter (2013) datasets were collected for three months in each season at a temporal resolution of 20 minutes. Traditional coal-stoves and kitchen temperature measurements were taken between July and September 2013 to characterise the residential area's winter fuel consumption patterns; summer measurements were taken between February and April. Data was downloaded from the temperature sensors in the field using a one-wire protocol and transferred to a personal computer in CSV file format. The temperature monitors were then reprogrammed to restart taking temperature measurements. This data was used to characterise the residents' burning events and determine seasonal burning patterns in the township. To understand spatial and seasonal burning variability within the township, a month from each season's data was selected for further analysis. Household stove and kitchen temperature profiles were analysed to count the number of burning events per winter and summer months. The analysis was initially conducted using an algorithm designed based on literature. However, this was changed during the study to accommodate the local households' conditions. For example, instead of using a one-temperature threshold for all the households, as in the study conducted by Ruiz-Mercado, Canuz and Smith, (2012), an initial threshold temperature for each household was determined with respect to observed household temperature differences (Ruiz-Mercado et al., 2012). Temperature differences may be introduced by differences in the construction material, which affects a household's heat retention and heat loss, burning patterns, and ambient temperature, and thus the household average indoor temperature.
3. Results
This section presents the results of the study and is composed of three sections; the first part presents findings on the energy use in KwaDela, second part presents findings on solid fuel supply and distribution while the third part focuses on daily and seasonal patterns in KwaDela.
3.1 Energy use in KwaDela (Solid fuel use survey results)
Electricity, coal, wood, dung, paraffin, and LPG are the available energy sources that KwaDela residents use to meet their households' daily needs (Table 1). Coal is the dominant solid fuel used. Wood and dung are used for fire ignition or as supplementary fuel when coal is insufficient or not available. Most residents use both modern (electricity) and traditional fuels.
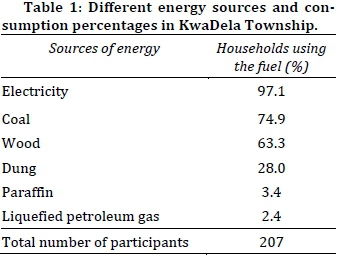
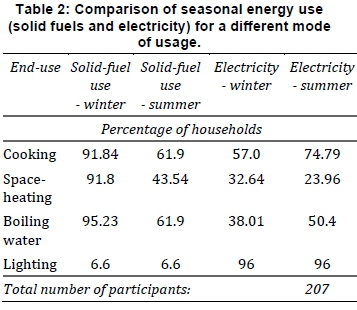
Table 2 summarises the type of fuel used in the township for specific household activities in winter and summer. About 90% of residents use solid fuels for cooking, space-heating and boiling water during winter. The use of these fuels for cooking and space heating decreases in summer by 30% and 57% respectively. This means that more than 50% of the population continue to use solid fuels for cooking and boiling water, and about 43% for space-heating, during summer. Electricity is primarily used for cooking in summer and for lighting throughout the seasons.
3.2 Solid fuel supply and distribution in KwaDela (Observational study results)
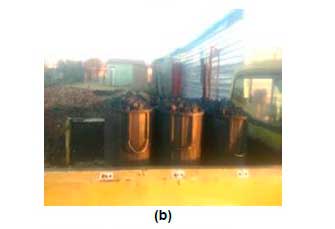
KwaDela has a well-established coal and wood supply network. There are two official stores in the township where households can purchase coal. According to the residents, coal from the two outlets differs in quality. Point A sells low-ash coal at ZAR 110.00 per container and offers a delivery service, while point B sells high-ash and low-ash coal at a cheaper price of ZAR 100.00, without delivery (Figure 1 a, b).


About 60% of the ten households that took part in the observation study reported purchasing coal from point A because of the higher quality. Residents who purchased coal from point B reported knowing the difference between high- and low-quality coal, and therefore chose high-quality coal at a lower price. Additionally, these residents did not have to worry about the transportation cost, due to point A's proximity to their residence. Informal coal distributors in KwaDela, are young men who smoke 'nyaope', and are therefore known as the 'nyaope guys'. 'Nyaope' is a slang word for an illegal South African drug (made from marijuana, heroin, antiretroviral drugs used in the treatment of HIV, and rat poison), which is sold at ZAR 20.00 per portion. After smoking nyaope, they get on the train while it is moving, 'remove' (that is, steal) large amounts of coal and sell it at a varying price (about ZAR 50.00) per container (volume of coal at 85 litres), depending on the price negotiation between them and the buyer.
Residents are keen to buy railway coal because they say it is high-quality, as it was intended for use by power stations. It is also seen to be very affordable compared with coal from the official coal sites. Therefore, residents have access to low-ash coal at low prices, spending little or no time to collect it since the 'nyaope guys' also provide delivery. One of the residents, who lives close to the railway line, also collects coal from trains instead of buying.
Wood is collected from the bushveld or bought from a local merchant or other residents selling wood at varying low prices (Figure 1 c and d). Areas where residents can collect wood are an hour's walk away from the township. Children were seen collecting wood at around 09:00. Similar studies conducted in KwaZulu-Natal reported that the average time spent on collecting wood per week ranges between seven and nine hours (Aitken, 2017). The local general dealer sells a 10 kg pack of wood for ZAR 45.00 (Figure 1 c). The 'nyaope guys' sell wood at varying prices, depending on the negotiating ability of the buyer. The 50 kg sack of wood in Figure 1(d) was sold for ZAR 20.00, and thee resident ended up buying two for ZAR 40.00, which is very affordable when compared with wood prices at the general dealer shop.
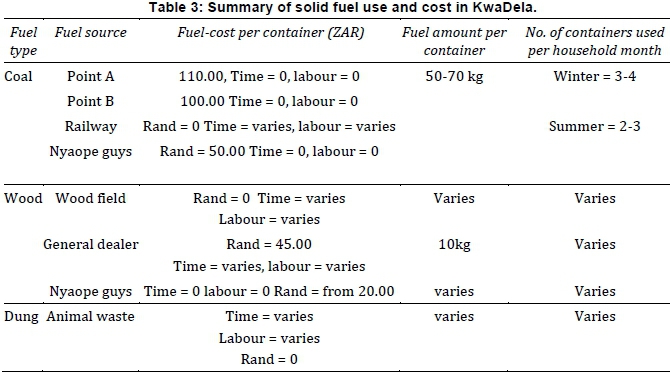
Table 3 summarises the amount of money, time and labour costs spent per quantity of coal, wood, and dung used. Dung is collected and dried before it is used as fuel and therefore has time-and labour-associated costs. Labour required for collection is dependent on the quantity of dung needed, while time is dependent on the quantity required and ambient conditions, which determine how fast the dung will dry. Time spent and labour cost on wood varies within the township, depending on household proximity to the source (wood fields and local dealers). Money is spent when buying it from the local shop or 'nyaope guys'.
The monetary cost associated with coal is dependent on the source. Residents buying coal from Point A spent ZAR 10.00 more than those buying from Point B, while residents collecting coal from the railway do not spend money at all. There is an inverse relationship between time, money and labour spent on fuel. High costs of time and labour result in less monetary cost spent on fuel. Table 3 can be used to estimate the amount of fuel used per household. For example, if the winter season is anticipated to last for 15 weeks (that is, between mid-May and August), and the remaining 37 weeks are considered summer, the estimated maximum amount of coal used per household annually in KwaDela ranges from 1 800 to 2 992.5 kg. The average amount of coal used per burning event is 4 kg, with a standard deviation of ± 2.53 kg, while the average amount of wood used to start the burning event was 1.6 kg, with a standard deviation of ± 1.3 kg. Only three of the ten households reported using dung for domestic burning, with an average amount of 2 kg per burning event and a standard deviation of ± 0, 5 kg.
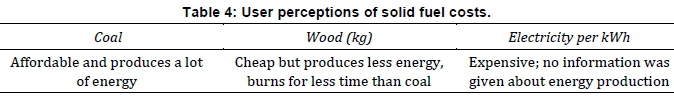
Table 4 summarises residents fuel cost perceptions and show the preferred type of fuel. Residents perceive coal and wood as being more affordable than electricity. Solid fuels are considered convenient for low-income residential areas as they require more time and labour but less money.
Another key element which was observed to play a vital role was the state of appliances used, as most of the surveyed households reported that they inherited their stoves from grandparents and parents. with their ages ranging between 30 and 100 years. Without good maintenance, these stoves are likely good emitters of air pollutants, thus contributing to the contamination of both indoor and ambient air quality. Some the respondent comments were:
'The stove is over 100 years, my grand-mother and my mother used it, I am getting my pension now, I still use it. If it breaks, I repair it.'
'This stove is a second-hand, I bought it approximately 29 years ago when we did not have electricity.'
3.3 Daily and seasonal burning patterns at household and residential area scales
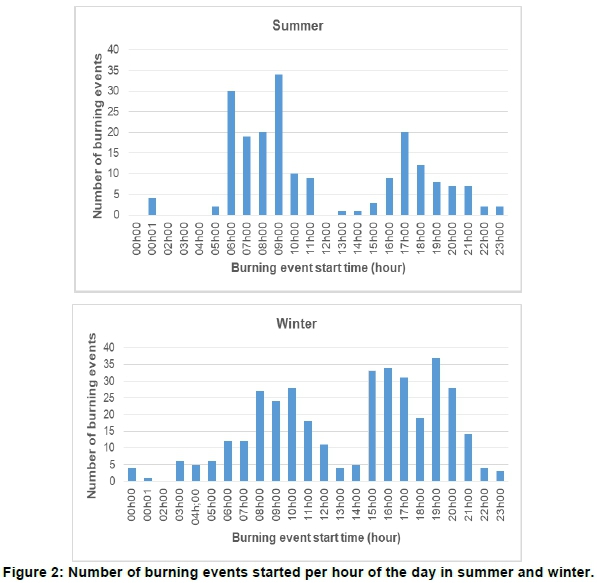
As shown in Figure 2, the number of daily burning events per household in winter ranges between 0 and 3 and in summer between 0 and 2. The start-time of winter morning burning events varies between 05:00 and 08:00, with an average duration of 3 to 4 hours and the evening fire events start between 16:00 and 17:30 and last an average of 4 to 6 hours. During school holidays the start-time of morning burning events shifts to between 07:00 and 08:00 and lasts longer (4 to 5 hours), while evening burning events start between15:30 and 17:00 with a shorter (3 to 4 hours) burning period. One in ten households, during the observation period, had a morning event start-time of 05:30. The observation data also highlights the spatial variability of stove operation behaviour at the household scale. Some residents refuel their burning events mostly if they are cooking food that takes longer or if is cold for space heating purposes. During the summer, residents mostly have a single event, but morning events are also present. The morning event start-time fluctuates between 05:00 and 08:00 with an average duration of 2 hours and evening burning starts between 16:30 and 17:00 and lasts for a duration of 2 to 5 hours.
The total number of burning events for the 13 houses per winter month was higher (366) than for the summer months (188). Also, the number of monthly burning events per household in summer is highly variable, ranging between 1 and 38, with a standard deviation of ± 14.3. For winter, the number of burning events per household is less variable, ranging between 8 and 43, with a standard deviation of ± 10. The daily burning event data time log indicated that the most common start-time for morning and evening burning events in winter is between 08:00 and 16:00, and for summer between 08:00 and 17:00.
Figure 2 also shows morning burning events to be more prevalent in summer, while in winter more fires are started in the evening. Therefore, high daily gaseous and particulate concentrations may be expected in the evening during winter and in the morning during summer. The fuel survey questionnaires' responses and observation study results are consistent with the temperature monitor data in terms of the seasonal and daily number of burning events, event starting time and their duration.
4. Discussion
The National Environmental Management: Air Quality Act (Act No. 39 of 2004) aim is to improve air quality in South Africa at both local and national scales. Attaining this goal may not be easy, due to the complexity and variability of fuel use within and between residential areas. This raises a need for detailed fuel-use data to obtain the best site-specific applicable intervention methods (Qase, 2000).
Solid-fuel use is a complex activity governed by interlinked factors that vary in space and time (Thompson, 1986; Thorn, 1994). Factors such as income, fuel availability, fuel prices, seasonality and household demographics have the most impact on the choice of fuel used (Davis, 1998). Major factors driving solid fuel use include the distance to the source, seasonality, and the relative costs (time, money, and labour) associated with the type of fuel (San et al., 2012). Low-income households perceive costs for modern fuel as high when compared to traditional fuels. By contrast, traditional fuels require mostly labour and time inputs and therefore appear desirable for low-income residents (Nkosi et al., 2017) suffering from energy poverty.
The economic status of a household does not always impact fuel use. When fuel is collected, either from the bush or coal-discard dump, other factors, such as the distance between the household and source of fuel and the availability of alternative fuel, impact on fuel use (Heltberg, 2004). Residents who live close to the railway line mentioned that they collect coal from there and that they are close to the wood fields. This removes the need to save coal, and therefore they are most likely to use more fuel than a household that must buy coal. KwaDela township has a well-connected coal supply network, with two coal sites within the township with one of them offering delivery, and with wood being collected and delivered to the front door of the residents. This removes the time-consuming and labour-intensive costs associated with the collection and transportation of solid fuels. Similar observations were made in KwaGuqa, Doornkop (Mdluli & Vogel, 2010). The proximity to the residential area, the mine in the Vaal Triangle, and a well-established local coal network are the reasons why coal remains cheap and accessible to the residents (Scorgie et al., 2003). This means that if there were to be other clean fuel suggested to replace solid fuels, it should be affordable, accessible, and available in large quantities. The variability, complexity and interlinked relationship of these factors imply that factors governing fuel use in other settings may not be generalised.
Furthermore, the study established that in sampled households domestic fuel consumption is relatively higher in winter than summer, as indicated by the higher frequency of burning events. On average, summer burning events lasted for a maximum of three hours while for winter they lasted for even five hours. This can be attributed to the demand for space-heating, to improve indoor thermal comfort. Even though indoor air quality was beyond the scope of this study, there is a high likelihood that, with the high-frequency use of solid fuels for space-heating, indoor air pollution also increased, thus threatening the well-being of occupants. Exposure to indoor air pollution was also increased by most of the stoves being located indoors, and burning also taking place indoors.
Seasonal variability and fluctuation of fuel costs lead to fuel diversification, and solid fuel is used for energy-demanding household activities such as cooking and space-heating predominantly in winter, while electricity is used for mainly lighting. Madubansi and Shackleton (2007) reported similar results for residents in small urban areas in the Eastern Cape (Madubansi & Shackleton, 2007)
5. Conclusions
Understanding solid-fuel use variability is a requirement for developing local sustainable energy policies and applicable site-specific intervention strategies. Solid fuels are preferred to electricity as they are comparatively accessible, reliable, affordable and produce high energy. Low-income residents use solid fuels mainly for cooking and space-heating, as these are the household activities that are high energy demands. The study established that there are two burning events per day in winter and summer, but may be three in winter due to space-heating needs. Furthermore, the study observed that morning and evening burning events normally commence at or around 03:00 am and 3:30 pm lasting three hours or more after cooking, due to boiling water and space-heating needs. Domestic solid fuels use and burning events temporal variations (burning event duration, start and end time, number of burning events per day) exists at both household and residential level but was not significant. Each household is estimated to consume 1 800-2992.5 kg of coal annually, with an average of 4 kg per burning event. The amount of coal used per burning event varied, with a standard deviation of ± 2.53 kg, while the average amount of wood used to start the burning event was 1.6 kg with a standard deviation of ± 1.3 kg.
Factors such as nearness to the fuel source, sea-sonality, fuel costs, household demographics and food diet have a substantial impact on the households' energy profiles and burning habits. The key to eliminating or reducing coal use in low-income residential areas is integrating intervention strategies that the residents can afford and that do not require high maintenance costs. If there is a proposed clean fuel option that will replace solid fuels in low-income residential areas, it should be affordable, and readily available, in the local area. Long-term intervention strategies may include providing stable, better-paying job opportunities for the residents so they can afford electricity. Improving air quality in low-income residential areas might also need to be integrated with poverty reduction strategies to be sustainable.
Author roles
N. Nkosi: Project conceptualisation, data collection, methodology design, data analysis, article writing/addressing reviewers' comments, project administration. S. Piketh and R. Burger: Project conceptualisation, data collection, methodology design, data analysis, addressing reviewers' comments, project administration, funding acquisition.
C. Pauw: Data collection, methodology design, data analysis.
N. Matarandirotya: Article writing and editing, addressing reviewers' comments.
Acknowledgments
We are indebted to our data collection team, Joe Mahlalela, Reighan Du Preez, Brigitte Language Madoda Mabuza, Boitumelo Ashley Thlapi, and Lehlohonolo Sello. Lastly, we are grateful to the community of KwaDela for their pleasant cooperation during data collection and for welcoming us into their homes.
Conflicts of interest
Authors declare no conflict of interest in terms of the study design, data collection, analysis, or publication of the results.
Funding
The project was partially funded by Sasol South Africa Limited and the Climatology Research Group of the North-West University.
References
Aitken, R., 2017. Household energy use: A comparison of household energy consumption and expenditure across three provinces. Journal of Energy in Southern Africa, 18(1): 20-28. https://journals.assaf.org.za/index.php/jesa/article/view/3338 [ Links ]
Altieri, K., and Keen, S. 2017. The cost of air pollution in South Africa. International GrowthCentre.Available at http://eprints.lse.ac.uk/81698/1/The%20cost%20of%20air%20pollution%20in%20South%20Africa%20-%20IGC.pdf. Accessed 12/02/2021 [ Links ]
Davis, M. 1998. Rural household energy consumption: The effects of access to electricity - evidence from South Africa. Energy Policy 26(3):207-217. https://doi.org/10.1016/S0301-4215(97)00100-6 [ Links ]
Eskom, http://www.eskom.co.za/CustomerCare/TariffsAndCharges/Pages/Tariffs_And_Charges.aspx. Date accessed 2017, 10, 19. [ Links ]
Farrow, A., Miller, K.A. and Myllyvirta, L. Toxic air: The price of fossil fuels. Seoul: Greenpeace Southeast Asia. February 2020. [ Links ]
Granderson, J. Sandhu, J.S. Vasquez, D. Ramirez, E. Smith, K.R. 2009. Fuel use and design analysis of improved wood-burning cookstoves in the Guatemalan Highlands. Biomass and Bioenergy 33(2): 306-315. https://doi.org/10.1016/j.biombioe.2008.06.003 [ Links ]
Heltberg, R. 2004. Fuel switching evidence from eight developing countries. Energy Economics, 26(5): 869-887. https://doi.org/10.1016/j.eneco.2004.04.018 [ Links ]
Johnson, N. and Bryden, K. 2012. Factors affecting fuelwood consumption in household cookstoves in an isolated rural West African village. Energy 46(1): 310-321. https://doi.org/10.1016/j.energy.2012.08.019 [ Links ]
Madubansi, M. and Shackleton, C.M. 2007. Changes in fuelwood use and selection following electrification in the Bush-buckridge Lowveld, South Africa. Journal of Environmental Management 83(4):416-426. DOI: 10.1016/j.jen-vman.2006.03.014 [ Links ]
Makonese, T. Masekameni, D., Annegarn, H. and Forbes, P. 2017. Emission factors of domestic coal-burning braziers. South African Journal of Science 11,33(4):1-11. http://dx.doi.org/10.17159/sajs.2017/20160187 [ Links ]
Mdluli, T.N. and Vogel, C.H. 2010. Challenges to achieving a successful transition to a low carbon economy in South Africa: examples from poor urban communities. Mitigation and adaptation strategies for global change 15(3):205-222. https://doi.org/10.1007/s11027-009-9195-4 [ Links ]
National Environmental Management: Air Quality Act (Act No. 39 of 2004). Department of Environmental Affairs, (DEA). Government Printer, Pretoria, South Africa. [ Links ]
Nkosi, C.N., Piketh, J.S., Burger, P. R. and Annergarn, J. H. 2017. Variability of domestic burning habits in the South African Highveld: A case study in the KwaDela Township, In: International Domestic Use of Energy. Cape Town, South Africa, 03-05 April 2017: https://doi.org/10.23919/DUE.2017.7931820 [ Links ]
Nkosi, N., Piketh, S. and Burger, R. 2018. Fine PM emission factors from residential burning of solid fuels using traditional cast-iron coal stoves. Clean Air Journal 28(1):35-41. http://dx.doi.org/10.17159/2410-972x/2018/v28n1a10 [ Links ]
Patarasuk, R., Gurney, K., O'Keeffe, D., Song, Y., Huang, J., Rao, P., Buchert, M., Lin, J., Mendoza, D. and Ehleringer, J. 2016.Urban high-resolution fossil fuel CO2 emissions quantification and exploration of emission drivers for potential policy applications. Urban Ecosystems 19(3):1013-1039. https://doi.org/10.1007/s11252-016-0553-1 [ Links ]
Piedrahita, R., Dickinson, K.L., Kanyomse, E., Coffey, E., Alirigia, R., Hagar, Y., Rivera, I., Oduro, A, Dukic, V., Wiedinmyer, C. and Hannigan, M. 2016. Assessment of cookstove stacking in Northern Ghana using surveys and stove use monitors. Energy for Sustainable Development 34:67-76. https://doi.org/10.1016/j.esd.2016.07.007 [ Links ]
Qase, N. 2000. Promoting low smoke fuels for the residential sector in South Africa. In World Energy Council Conference on Cleaner Fossil Fuels Systems: A business and investment Agenda for Africa. Dakar, Senegal. [ Links ]
Ruiz-Mercado, I., Canuz, E. and Smith, K. 2012. Temperature dataloggers as stove use monitors (SUMs): Field methods and signal analysis. Biomass and Bioenergy 47:459-468. https://doi.org/10.1016/j.biombioe.2012.09.003 [ Links ]
San, V., Sriv, T., Spoann, V., Var, S. and Seak, S. 2012. Economic and environmental costs of rural household energy consumption structures in Sameakki Meanchey district, Kampong Chhnang Province, Cambodia. Energy 48(1):484-491. https://doi.org/10.1016/j.energy.2012.10.017 [ Links ]
Scorgie, Y., Kneen, M.A., Annegarn, H.J. and Burger, L.W. 2003. Air pollution in the Vaal Triangle: Quantifying source contributions and identifying cost-effective solutions. Clean Air Journal 13(2):5-18. doi:10.17159/caj/2003/13/2.7152 [ Links ]
Simões A, S., Andrade de Carvalho, J., Martins Costa, M. and Pinheiro, C. 2016. Particulate matter emission factors for biomass combustion. Atmosphere 7(11):141. DOI: 10.3390/atmos7110141 [ Links ]
Thomas, E., Wickramasinghe, K., Mendis, S., Roberts, N. and Foster, C. 2015. Improved stove interventions to reduce household air pollution in low- and middle-income countries: a descriptive systematic review. BMC Public Health 15(1):650. https://doi.org/10.1186/s12889-015-2024-7. [ Links ]
Thompson, B. 1986. A directory of appropriate energy technology programmes in Southern Africa, Energy research Institute, University of Cape Town, 1984. Development Southern Africa 3(1):119-122. [ Links ]
Thorn, C. 1994. Energy for rural development, Paper 6. South African Energy Policy Research and Training Project, Energy for Development Research Centre, University of Cape Town, Cape Town, 1986. [ Links ]
Van den Berg, B. 2015. Source apportionment of ambient particulate matter in KwaDela, Mpumalanga. PhD dissertation, North-West University, Potchefstroom Campus, South Africa. [ Links ]
Wernecke, B., Language, B., Burger, R.P. and Piketh, S.J. 2015. Indoor and outdoor particulate matter concentrations on the Mpumalanga Highveld: A case study. Clean Air Journal 25(2):12-16. 17 http://dx.doi.org/10.17159/2410-972x/2015/v25n2a1 [ Links ]
WHO., 2018. Burden of disease from household air pollution for 2016. Available at https://www.who.int/airpollution/data/HAP_BoD_results_May2018_final.pdf. Accessed 12/02/2021 [ Links ]
* Corresponding author: Email: nomhawunkosi93@gmail.com

