


Services on Demand
Article
 English (pdf)
 Article in xml format
 Article references
Indicators

Related links
-
 Cited by Google
 -
 Similars in Google
Share

 Permalink
Journal of Energy in Southern Africa
On-line version ISSN 2413-3051
Print version ISSN 1021-447X
J. energy South. Afr. vol.32 n.1 Cape Town Feb. 2021
http://dx.doi.org/10.17159/2413-3051/2021/v32i1a8362
ARTICLES
Estimating wind power generation capacity in Zimbabwe using vertical wind profile extrapolation techniques: A case study
L. GundaI, *; E. ChikuniII; H. TazvingaIII; J. MudareIV
IUniversity of Zimbabwe, Harare, Zimbabwe; National University of Science and Technology, Bulawayo, Zimbabwe
IIBotho University, Gaborone, Botswana
IIISouth African Weather Service, Pretoria, South Africa
IVUniversity of Zimbabwe, Harare, Zimbabwe
ABSTRACT
Only 40% of Zimbabwe's population has access to electricity. The greater proportion of the power is generated from thermal stations, with some from hydro and solar energy sources. However, there is little investment in the use of wind for electricity generation except for small installations in the Eastern Highlands, as Zimbabwe generally has wind speeds which are too low to be utilised for electricity generation. This paper presents the use of vertical wind profile extrapolation methods to determine the potential of generating electricity from wind at different hub heights in Zimbabwe, using the Hellman and exponential laws to estimate wind speeds. The estimated wind speeds are used to determine the potential of generating electricity from wind. Mangwe district in Matabeleland South province of Zimbabwe was used as a test site. Online weather datasets were used to estimate the wind speeds. The investigation shows that a 2.5kW wind turbine installation in Mangwe can generate more than 3MWh of energy per annum at hub heights above 40m, which is enough to supply power to a typical Zimbabwean rural village. This result will encourage investment in the use of wind to generate electricity in Zimbabwe.
Highlights
• Wind power utilisation is low in Zimbabwe.
• Vertical wind profile is estimated using extrapolation methods.
• Online weather data for soil and water analysis tool was used.
• Electricity can viably be generated from wind in Zimbabwe.
Data Availability: On request from authors
Keywords: renewable energy; wind energy; power estimation, Hellman law
1. Introduction
The global population is growing annually and this directly translates into increased demand for energy. This increased demand can only be met by having a corresponding increase in power generation. Most developing countries depend more on non-renewable fossil fuels than any other form, and Zimbabwe has a particular reliance on non-renewable sources (UNICEF, 2015; Poudyal et al., 2019). However, due to environmental concerns, many countries have subscribed to the Kyoto Protocol, and have made pledges to reduce their emissions by some defined percentages (Nations, 1998). The need to reduce emissions leaves an imbalance between energy demand and generation, since it implies that thermal power stations have to be downsized (Carbon Brief, 2019). The imbalance can be addressed through introducing renewable energy technologies, which have lower emissions. Solar, hydro and wind energy are the three clean energy technologies that have proved best to cover this gap, as can be observed from experience in, for example, Germany, Brazil and India (REN21, 2019). The solar option has the advantage that it can be implemented at small scale and hence is more widely used in many rural areas than wind. Countries like Germany and India, among others, have invested in wind power and have reaped the benefits of the investments (Ministry of New and Renewable Energy of India, 2016). Other countries, like those in sub-Saharan Africa are bedevilled by the lower wind speeds that dominate, except for those, like South Africa, Mozambique, Namibia and Angola, which have coastlines with relatively higher wind speeds caused by the difference between land and sea thermal properties (Ayodele et al., 2012).
There has been widespread use of vertical wind profile extrapolation methods in order to estimate wind speeds at different heights, and these methods have given hope for those areas initially considered as having insufficient wind resources for electric power generation (Firtin, Güler and Akdag, 2011; Kubik, Coker and Hunt, 2011; Bañuelos-Ruedas, Ángeles Camacho and Rios-Marcuello, 2012; Bratton and Womeldorf, 2012; Okorie, Inambao and Chiguvare, 2017; Wood et al., 2017). Estimating wind power generation capacity in Zimbabwe was done using data from pre-set meteorological stations that had been strategically placed in the pre-independence Zimbabwe era for agricultural purposes (Mungwena, 2002), and it was concluded that Zimbabwe did not have enough wind resources for electric power generation. However, research by the International Renewable Energy Agency (IRENA) has shown that Zimbabwe has some areas with great potential for electricity generation using wind (IRENA, 2015).
Meteorological stations measure wind speed at 10 m heights (Tazvinga, Zhu and Xia, 2014) and this is sufficient for agricultural purposes and weather reports and forecasts. For wind power generation capacity estimation, it is ideal to take measurements at greater heights and different locations, since there may be some areas which are far from the meteorological stations but have good wind speeds for electricity generation. Work has already been done to study the wind speed distribution for some areas in Zimbabwe using the Weibull parameters (Hove, Madiye and Musademba, 2014). This alluded to the potential for electric power generation in areas around Gweru, and was based on 50 m hub heights. The conclusion was that that the highest power density at that height was in Gweru at a value of 115 Wm-2.
Wind speed distribution is a function of not only geographical location and height, but also of the landscape in which the measurements are done. Different places may have the same wind speeds at a certain hub height, but a change in height may mean a very different wind speed, due to the surface roughness length and the wind shear coefficient (Ur Rehman et al., 2015). It is against this background that an investigation was conducted to determine the potential for wind power generation in Zimbabwe for selected places at varying hub heights. The Green Energy Zimbabwe website carried a story in which an 'expert' said that there are plans to measure wind speeds up to 100 m heights, since the hubs should be around 80 m for wind power generation in Zimbabwe (Mawire, 2017). However, there is no technical evidence to confirm this in published research about Zimbabwe, and also considering that different wind turbine types can be used at different hub heights. The present study shows, through meteorological data and vertical wind profile extrapolation methods, that there is potential for Zimbabwe to generate electricity from the wind at hub heights far less than the 80 m stated in the article.
There are two prominent methods, namely the exponential law and the power law, used for estimating wind speeds at different heights and these have been widely used in feasibility studies before wind power generators were set up (Kubik, Coker and Hunt, 2011; Okorie, Inambao and Chiguvare, 2017). In this paper, the Hellman power law wind shear coefficient a and the exponential law roughness length z0 for selected areas in Zimbabwe have been determined using available meteorological data. The challenge is that wind speeds at various heights, higher than 10 m, are not readily available, which makes it difficult to estimate power densities, hence the need to extrapolate. The power generation capacity of an area in the absence of wind data for different hub heights makes it necessary to use estimates and predictions (Khosravi et al., 2018). The estimates, however, need two data sets for two hub heights, which means there should be a reliable source of the data.
The values are used to estimate wind speeds and power densities at different heights in the selected areas. The results are used to determine the lowest hub height at which electricity can be generated and power harvested at different heights, and they thus provide help in making decisions about setting up wind farms in Zimbabwe
1.1 The Hellman power law
The vertical wind profile is affected by many factors, which are difficult to determine exhaustively for each site. However, some inferences have been made using fluid dynamics and it was observed that the parameters are dependent on pressure and temperature. Therefore, with good stratification and reduced turbulence, the parameters can be condensed and represented by the power coefficient a (Jung, Jung and Christopher, 2016). The power law relates the speed at two different heights to the heights at which the measurements are taken. Equation 1 shows the mathematical expression representing the power law.
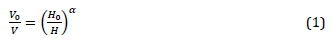
where V0 is the reference velocity at the known height H0, and V is the unknown wind velocity at the known height H, while a is the wind shear coefficient for the given area. It is evident that the determination of a is done when the wind speeds at two heights are known. Studies done in different areas have shown that the value of a cannot be generalised for a place (Werapun, Tirawanichakul and Waewsak, 2017). The generalisation would lead to significant errors in power estimation, values of which could go up to about 40% error. In order to get better estimates, some researchers considered seasonal variation, but again it was shown that there is diurnal variation in the values (Delgado et al., 2016).
Reliable estimates can be obtained by considering the diurnal or seasonal variations to determine average values which can then be used in the wind speed estimations (Tazvinga, Zhu and Xia, 2014). Data for at least a full year is required to make accurate estimations. This would then help in estimating the annual power generation capacity for a site. Table 1 shows the wind shear coefficients and land descriptions for some values of a cited in the literature. When the value of a is taken to be 1/7, then the Hellman exponential law becomes the 1/7 law; however, studies have shown that this value cannot be generalised for all places (Ur Rehman et al., 2015), so it is necessary to determine values for different places and at different times of the day or season.

1.2 The logarithmic law
The power law is used to estimate the vertical wind profile using the surface characteristics of the site. The logarithmic law is used to estimate the vertical wind profile using the surface characteristics of the site as well as the area covered by a certain surface characteristic. The parameter of use in this law is the surface roughness length, z0, which can be determined from Equation 2.

where V and V0 are the wind speeds at heights H and H0 respectively.
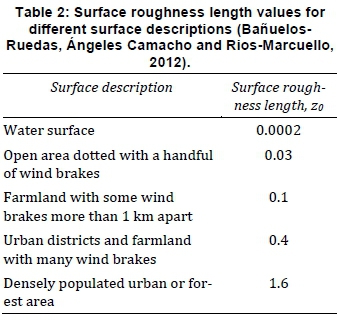
The value of z0 can be determined once the wind speeds at two different heights are known. Studies have shown that all the parameters responsible for vertical wind profile changes can be condensed into the surface roughness length z0 (Emeis, 2014). The variations follow almost the same trend as the wind shear coefficient. The values of the surface roughness length quoted in literature for different surface descriptions are given in Table 2 The values determined using actual measurements may not be exactly the same as the ones in the table, but there should be a close similarity that may be used to even estimate the landscape roughness and extent of the characteristics.
1.3 Wind power estimation calculations
Standard wind power theory shows that there is a cubic power relationship between mechanical wind power and wind speed. The mechanical power available at the turbine blades is given by Equation 3.

where Pm is the mechanical power available in the wind, p is the density of air, and v is the wind speed.
This relationship is the key reason why wind speed estimation should be accurate. Assuming all other values constant, a change in speed from 5 ms-1 to 5.5 ms-1 causes a change in power generation of 33%. If this is an error in speed estimation or measurement, then there will be a 33% error in the estimation of power available in the wind. Different relationships are used to calculate the most probable wind speed, the wind speed carrying the maximum power, and the power density. If these are combined with the duration of wind speeds, the annual power generation capacity for a site can be determined. The Weibull distribution is used in the estimation of power density, and the accuracy of the estimate is as good as the Weibull parameters. The power density calculated using the Weibull function is given by Equation 4.
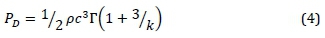
where r0 is the Gamma function, k and c are the Weibull shape and scale parameters respectively, and Pd is the power density. The power density can, however, be directly computed if the wind turbine is selected and the dimensions and power factors are known. The direct computations can be done if the wind speeds are known for different heights. The most probable wind speed can be calculated from the Weibull parameters using Equation 5.

Direct determination of the most probable wind speed can be done by producing the frequency distribution curve for the wind speeds, and the modal speed is the most probable wind speed.
The wind speed with the maximum power can be determined from the Weibull parameters using Equation 6.

When the wind distribution data of the area is available, the wind with the maximum power corresponds to the maximum value of the wind speed attained for that area. It is therefore important to estimate the wind speeds with high accuracy and also determine the Weibull parameters with high accuracy. A combination of these two can enable accurate estimation of potential power generation
2. Vertical wind profile extrapolation and power estimation strategy
The data used in this research is from the meteorological stations in Zimbabwe, available online from SWAT (2019). However, the data is from 10 m heights, so satellite data available from an online data source (Meteoblue, 2019) was included in the work, because it has data sets at 10 m and 80 m heights. Both the power law and the exponential law are used in the extrapolation of wind speeds and the results are compared.
2.1 Wind speed data analysis
Wind speeds must be analysed at a site so that good estimates can be made about its wind power generation potential. The analysis involves determining the wind speed patterns at a site, the wind speed distribution, and other statistics like mean, modal and maximum wind speeds.
Testing online datasets against meteorological stations data
Data for a weather station in Plumtree, acquired from the metrological station and the online source was used in statistical analysis. The statistical methods used to analyse the data in Sigma (2013) and Wood (2018) show that the paired T-test is relevant in determining if the data acquired from online sources varies from that acquired from the meteorological station. The paired T-test is given as an example in Sigma (2013) where student marks were compared before and after a teaching convention. Since the difference is not known, it can either be positive or negative, so a 2-tailed T-test is more relevant.
The method is used to determine the difference between the scores. This can also be inferred from the two data sets, one from the meteorological station and the other from the online data source. The analysis then shows if there is a significant difference between the two data sets. An acceptance level can also be established. The null hypothesis developed can be that there is no difference between the two data sets, or that there is a 95% confidence level that the data from the online source is the same as the meteorological data from the ground weather station. If the null hypothesis can be accepted, then the online data source can be used in all the calculations on any selected site.
Alternatively, the two data sets can be compared by enumerating the difference between readings at the same time of the day, in the same month and year. The difference can then be treated as a new data set and analysed as if it is a single sample. The mean can be calculated and, for the data to be acceptable, the mean difference should be close to zero and the standard deviation should be small. This can be done by assuming that the difference follows a normal distribution.
For this analysis, 'W' is used for identifying data from online sources and 'U' is used for identifying data from the ground meteorological stations. For each set of data, the average wind speed is given by Equation 7.

where x¡ is wind speed at a time i, and N is the number of readings in a data set.
The standard deviation of the data set is given by the expression in Equation 8.

By using the paired-T-test and proposing that there is no difference between the data from online sources and the data from the meteorological stations, the results shown in Tables 3 and 4 have been observed.


The T-test statistical probability is 0.304, which is far greater than the 0.05 required to pass the hypothesis. It can therefore be concluded that there is no significant difference between the two readings, so the online data sets can be used as a true representation of the meteorological data for a chosen area.
Five areas in Zimbabwe identified from the interactive maps from IRENA (IRENA, 2015) are used in this study: Gweru, Insiza, Magunje, Makoni and Mangwe. According to the interactive maps, these areas have wind power densities greater than 245Wm-2 at the 80 m hub height.
2.2 Wind shear coefficient and surface roughness length determination
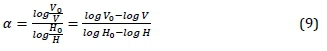
The Hellman exponent a is the wind shear exponent which relates the wind speeds at two heights to the heights above the ground. The relationship was given in Equation 1. Using the meteorological data, the value of a is determined by making a the subject of the formula in Equation 1, resulting in Equation 9, and then substituting for the measured values of the wind speeds at the given heights.
By making z0 the subject of the formula in Equation 2, Equation 10 can be used to calculate z0 at different heights when the wind speed and height measurements are given.

where V is the wind speed at height H and V0 is the wind speed at height H0.
The data collected from the meteorological department is measured at 10 m heights and is not sufficient for determining the parameters, which require measurements at two different heights for a selected area. In order to enable the determination, the data from the online sources has been used, as explained in section 2.1.
3. Results and discussion
After the comparative analysis of the winds speed data from the ground meteorological offices and the wind speed data from the online dataset, it was concluded that the online datasets can be used to represent the meteorological data for the selected locations. The online data was used to determine the wind shear coefficient, a, and the surface roughness, z0, for the selected areas using Equations 9 and 10. The results for the selected areas are presented and discussed in this section, as well as the power estimation calculations and results.
3.1 Values of wind shear coefficient and surface roughness length.
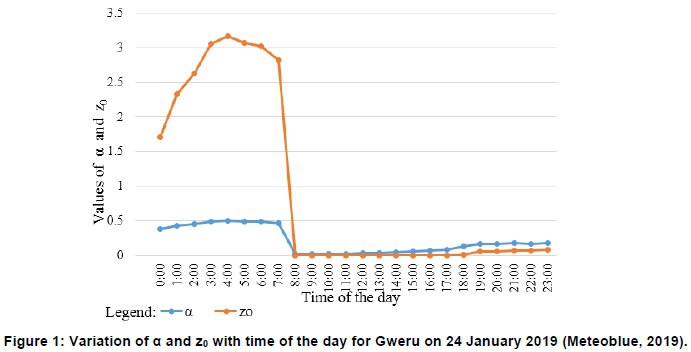
The general observation is that both a and Z0 vary with the time of the day. Hourly data for Gweru is used as an illustration and is shown in Figure 1 indicating that there is a significant change in the values of a and Z0 through the day, explained by the variations in temperature. The average value for a day can be used. but more accurate values would take cognisance of the variations. For this work, the daily averages were used and the wind vertical profiles were extrapolated. A comparison was also done to determine the differences in the estimated wind speeds while using the power law and the exponential law.
Table 5 shows the average values of a and Z0 for the selected areas and chart is shown in Figure 2 The values of a for Insiza, Magunje and Mangwe are almost the same and this may suggest similarities in land use for Insiza, Magunje and Mangwe. Gweru is a city with high buildings and hence has larger values of a and Z0, as expected from Table 1


Figure 3 (a-e) shows the vertical wind profile estimates using the two methods for Gweru, Insiza, Magunje, Makoni and Mangwe.

3.2 Wind speed distribution for the five sites
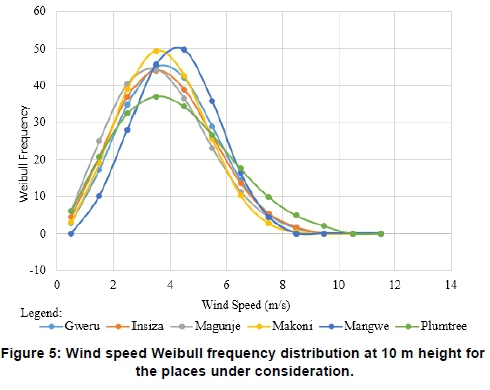
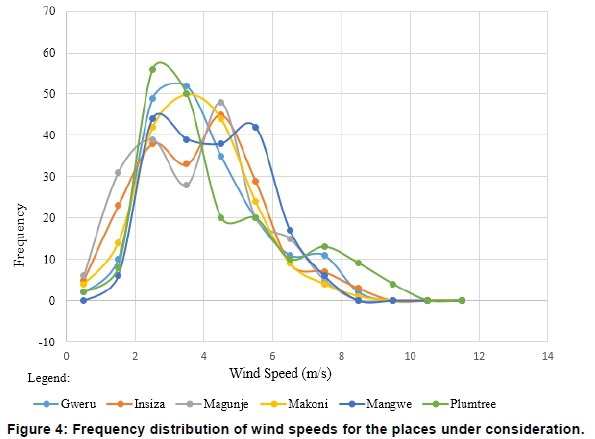
Figure 4 shows the frequency distribution of wind speeds for the selected areas. At 10m heights for the selected period, Mangwe, Magunje and Insiza exhibit relatively high frequencies in occurrences of wind speeds above 4.5 ms1, with Mangwe showing high occurrences of speeds above 5.5 ms-1. The trends are further analysed by producing the Weibull frequency distribution curves. Comparing Figures 4 and 5 shows that statistical inferences in wind data analysis give a clearer presentation of the wind data for an area. From Figure 5 it is easier to determine which area has higher occurrence of higher wind speeds, and in this case Mangwe has higher occurrences of wind speed above 4.50ms-1. The use of the Weibull distribution is therefore a good starting point in site selection.
3.3 Wind power calculations for Mangwe
Mangwe is selected in this study as a case to demonstrate the power calculations.
3.3.1 Estimated wind speeds at different hub heights
Figure 6 shows the estimated wind speeds at different heights for Mangwe and the average estimated speed using values calculated from the use of a, Z0 and the average of the two methods. The trends in the graph show that there is considerable gain in wind speeds with height. This observation is made possible by using the vertical wind profile extrapolation techniques.

3.3.2 Estimated wind power densities at different hub heights
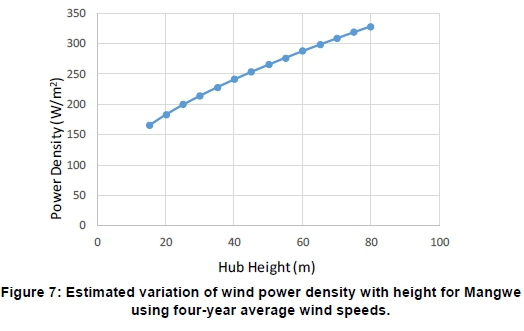
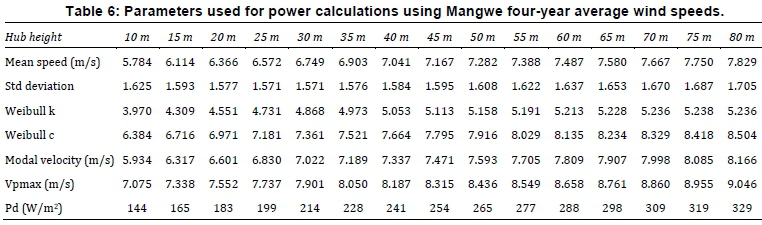
Using the average speed, the power density at any height can be calculated from Equation 4. Table 6 shows the parameters deduced from the estimated data and Figure 7 shows variation of power density with height using four-year average wind speeds. Using the classification of wind regimes in an area given by Premono, Tjahjana and Hadi (2017), Mangwe is in Class 4, considering wind speed at 10 m, 30 m and 50 m heights.
3.3.3 Estimated wind energy harvest per annum at different hub heights
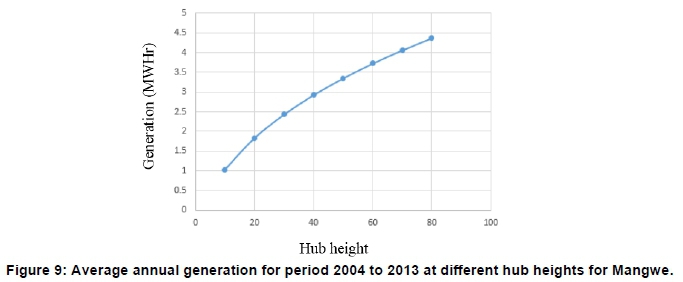
The energy generation potential per annum is determined by selecting a turbine and using its power curve to get the power generated per day. This can be extended to the annual harvest. Table 7 shows parameters of the WT2500 (Proven Energy, Scotland) turbine which is used to estimate the power generation potential. Using the parameters, power and energy calculations have been done for and are presented in Figures 8 and 9. However, the turbine power equation must be modified to define the operational points which include the cut-in speed, the rated speed and the cut off speed. Using the WT2500 turbine as an example, output power is calculated using Equation 11.


The daily average speed per month is used to calculate the annual power generation at different hub heights. This is achieved by summing up the daily generation and multiplying by the hours in a year to get the annual energy production (AEP), as given by Equation 12.

where N is the number of hours in a year (8 760), and Pi is the average power on the ith day of the year. The approach gives a more accurate estimation because the wind vertical profile extrapolation parameters vary through the day. The results for the period of ten years between 2004 and 2013 are presented in Figure 8. The average annual generation over the same period is presented in Figure 9. The results show that the 2.5kW generator can produce over 3 MWh of energy per annum, at hub heights above 40 m, which is sufficient to supply a standard Zimbabwean village.
4. Conclusions
The analysis of vertical power profile has been presented in general and in particular for Mangwe. The results show that there is potential to generate power from the wind at hub heights of 40 m and more, giving power densities above 250 Wm-2. It is evident that the determination of the vertical wind profile per hour can yield more accurate results, because the wind speed extrapolation parameters change through the day, as does the wind speed.
Acknowledgements
The authors acknowledge the contributions of the National University of Science and Technology, Zimbabwe for the funds availed for the research. The University of Zimbabwe is acknowledged for availing facilities for the research, and the Meteorological Department of Zimbabwe for allowing the use of weather data collected at their weather stations.
Author roles
L. Gunda: Writing - original draft, conceptualisation, methodology, investigation, formal analysis. E. Chikuni: Project administration, resources, supervision, validation.
H. Tazvinga: Writing, review and editing, resources, supervision, validation.
J. Mudari: Project supervision and editing
References
Ayodele, T. R., Jimoh, A. A., Munda, J. L., and Agee, T. J. 2012. Statistical analysis of wind speed and wind power potential of Port Elizabeth using Weibull parameters, Journal of Energy in Southern Africa, 23(2): 30-38. doi: 10.17159/2413-3051/2012/v23i2a3160. [ Links ]
Bañuelos-Ruedas, F., Ángeles Camacho, C. and Rios-Marcuello, S. 2012. Methodologies used in the extrapolation of wind speed data at different heights and its impact in the wind energy resource assessment in a region. Suvire, G. (Ed.), ISBN: 978-953-307-483-2, InTech. Available from: http://www.intechopen.com/books/wind-farm-technical-regulations-potential-estimation-and-sitingassessment/methodologies-used-in-the-extrapolation-of-wind-speed-data-at-different-heights-and-its-impactin-the-wind-energy-resource-assessment-in-a-region (Accessed 11 March 2019). doi: 10.5772/20669. [ Links ]
Bratton, D. C. and Womeldorf, C. A. 2012. The wind shear exponent: Comparing measured against simulated values and analyzing the phenomena that affect the wind shear. Proceedings of the ASME 2011 5th International Conference on Energy Sustainability (ES2011), 7-10 August 2011, Washingon, DC, USA. 2245-2251. doi: 10.1115/es2011-54823. [ Links ]
Carbon Brief. 2019. Analysis: Global coal power setfor record fall in 2019. Available at: https://www.carbonbrief.org/analysis-global-coal-power-set-for-record-fall-in-2019 (Accessed: 29 November 2019). [ Links ]
Delgado, A., Gertig, C., Blesa, A., Loza, A., Hidalgo, C. and Ron, R. . 2016. Evaluation of the variability of wind speed at different heights and its impact on the receiver efficiency of central receiver systems. AIP Conference Proceedings. doi: 10.1063/1.4949063. [ Links ]
Emeis, S. 2014. Current issues in wind energy meteorology, Meteorological Applications, 21(4): 803-819. doi: 10.1002/met.1472. [ Links ]
Firtin, E., Güler, Ö. and Akdag, S. A. 2011. Investigation of wind shear coefficients and their effect on electrical energy generation, Applied Energy, 88(11): 4097-4105. doi: 10.1016/j.apenergy.2011.05.025. [ Links ]
Globalweather. 2019. Global weather data for SWAT. Available at: https://globalweather.tamu.edu/ (Accessed: 18 July 2019). [ Links ]
Hove, T., Madiye, L. and Musademba, D. 2014. Mapping wind power density for Zimbabwe: A suitable weibull-parameter calculation method, Journal of Energy in Southern Africa, 25(4): 37-47. [ Links ]
IRENA. 2015. Multi-criteria Analysis for Planning Renewable Energy (MapRE): Interactive map-Zimbabwe. doi: 10.1016/B978-0-444-62722-3.00004-5. [ Links ]
Jung, C. 2016. High spatial resolution simulation of annual wind energy yield using near-surface wind speed time series, Energies 9(5): 344-350. doi: 10.3390/en9050344. [ Links ]
Khosravi, A., Koury, R. N. N., Machado. L. and Pabon, J. J. G. 2018. Prediction of wind speed and wind direction using artificial neural network, support vector regression and adaptive neuro-fuzzy inference system, Sustainable Energy Technologies and Assessments 25(January) : 146-160. doi: 10.1016/j.seta.2018.01.001. [ Links ]
Kubik, M. L., Coker, P. J. and Hunt, C. 2011. Using meteorological wind data to estimate turbine generation output: A sensitivity analysis, Proceedings of the World Renewable Energy Congress - Sweden, 8-13 May, 2011, Linköping, Sweden, 57: 4074-4081. doi: 10.3384/ecp110574074. [ Links ]
Mawire, W. 2017. Wind energy resource assessment to be conducted in Zimbabwe - Green Energy Zim, Green Energy Zimbabwe. Available at: http://greenenergyzim.misa.org/2017/10/27/wind-energy-resource-assessment-conducted-zimbabwe/ (Accessed: 15 April 2019). [ Links ]
Meteoblue (2019) Weather tube pan - meteoblue. Available at: https://www.meteoblue.com/en/weather/forecast/week/tube-pan_botswana_932969 (Accessed: 8 March 2019). [ Links ]
Ministry of New and Renewable Energy of India. 2016. Draft national wind-solar hybrid policy. Available at: http://mnre.gov.in/file-manager/UserFiles/Draft-Wind-Solar-Hybrid-Policy.pdf. [ Links ]
Mungwena, W. 2002. The distribution and potential utilizability of Zimbabwe's wind energy resource, Renewable Energy, 26(3): 363-377. doi: 10.1016/S0960-1481(01)00141-0. [ Links ]
Okorie, M. E., Inambao, F. and Chiguvare, Z. 2017. Evaluation of Wind Shear Coefficients, Surface Roughness and Energy Yields over Inland Locations in Namibia, Procedia Manufacturing, 7, pp. 630-638. doi: 10.1016/j.promfg.2016.12.094. [ Links ]
Poudyal, R., Loskot, P., Nepal, R., Parajuli, R. and Khadka, S. K. 2019. Mitigating the current energy crisis in Nepal with renewable energy sources, Renewable and Sustainable Energy Review 116(April): doi: 10.1016/j.rser.2019.109388. [ Links ]
Premono, B. S., Tjahjana, D. D. D. P. and Hadi, S. 2017. Wind energy potential assessment to estimate performance of selected wind turbine in northern coastal region of Semarang-Indonesia. Proceedings of the International Conference on Engineering, Science and Nanotechnology 2016 (ICESNANO 2016), 1788. doi: 10.1063/1.4968279. [ Links ]
REN21. 2019. Renewables2019global report. Paris. Available at: https://www.ren21.net/wp-content/uploads/2019/05/gsr_2019_full_report_en.pdf (Accessed: 16 October 2019). [ Links ]
Sigma. 2013. Statistical analysis 3: Paired t-test. [ Links ]
Tazvinga, H., Zhu, B. and Xia, X. 2014. Energy dispatch strategy for a photovoltaic - wind - diesel - battery hybrid power system, Solar Energy, 2068. [ Links ]
United Nations Children's Fund. 2015. Sustainable Energy for Children in Zimbabwe : Situational analysis of the energy status of institutions that support children in five districts of Zimbabwe. ISBN: 9789280648508. [ Links ]
United Nations. 1998. Kyoto protocol to the United Nations Framework. doi ; 10.1111/1467-9388.00150. [ Links ]
Rehman, S., Shoaib, M., Siddiqui, I., Ahmed, F., Rashid, T. M. and Jilani, S. U. 2015. Effect of wind shear coefficient for the vertical extrapolation of wind speed data and its impact on the viability of wind energy project, Journal of Basic & Applied Sciences, 11: 90-100. Available at: http://lifescienceglobal.com/pms/index.php/jbas/article/viewFile/2723/1595 (Accessed: 11 March 2019). [ Links ]
Werapun, W., Tirawanichakul, Y. and Waewsak, J. 2017. Wind shear coefficients and their effect on energy production, Energy Procedia. 138: 1061-1066. doi: 10.1016/j.egypro.2017.10.111. [ Links ]
Wood, M. 2019. Simple methods for estimating confidence levels , or tentative probabilities , for hypotheses instead of p values. Methodological Innovations. 1-9. Available from https://doi.org/10.1177/2059799119826518 (Accessed 03 March 2019). [ Links ]
* Corresponding author: Email: loveugunda@gmail.com

