


Services on Demand
Article
 English (pdf)
 Article in xml format
 Article references
Indicators

Related links
-
 Cited by Google
 -
 Similars in Google
Share

 Permalink
Journal of Energy in Southern Africa
On-line version ISSN 2413-3051
Print version ISSN 1021-447X
J. energy South. Afr. vol.31 n.4 Cape Town Nov. 2020
http://dx.doi.org/10.17159/2413-3051/2020/v31i4a8808
ARTICLES
The electrical energy impact of small-scale onsite generation: A case study of a 75 kWp grid-tied PV system
Russel MhundwaI, *; Michael SimonII; Joel Nana YongouaIII
IUniversity of Fort Hare, Fort Hare Institute of Technology, P. Bag X1314, Alice 5700, South Africa ORCID iD: https://orcid.org/0000-0002-5031-1697
IIUniversity of Fort Hare, Fort Hare Institute of Technology, P. Bag X1314, Alice 5700, South Africa ORCID iD: https://orcid.org/0000-0003-4982-8055
IIIUniversity of Fort Hare, Fort Hare Institute of Technology, P. Bag X1314, Alice 5700, South Africa ORCID iD: https://orcid.org/0000-0001-5943-5058
ABSTRACT
This study presents an analysis of a 75 kWp grid-tied solar photovoltaic (PV) system with a grid tie limiter to provide energy requirements for an aquaculture centre in the Eastern Cape province of South Africa. A data acquisition system, comprising power and energy consumption meters, was deployed to measure solar PV generation, demand for the facility, and energy drawn from the utility grid. Statistical analysis was conducted on the data to determine the impact of the solar PV plant in reducing demand from the utility grid throughout the day, and this was extrapolated into monthly and annual contributions by the PV system to meeting the energy requirements. Findings reveal that the annual energy yield for the system was 1 864.29 kWh/kWp. The solar contribution to the total load requirement on a 24 hour cycle was 28% (139.82 MWh) from July 2018 to June 2019. Summer and winter average contributions by the PV system were 62% and 57% respectively for the period of 05:30-18:30. The mean monthly solar fraction for operating the farm between sunrise and sunset was 0.44. Furthermore, a total of 141.07 tCO2 has been avoided due to the operation of the PV system.
Keywords: solar PV; grid tie limiter; solar fraction; electrical contribution; emissions reduction; aquaculture
1. Introduction
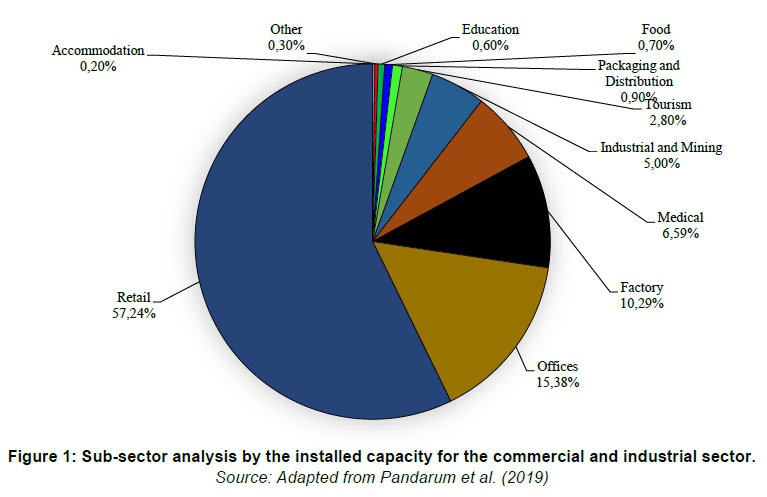
Over the past few years, South Africa has experienced a gradual shift from utility-scale renewable energy procurement, through the National Renewable Energy Independent Power Producers Procurement Programme, to a more distributed approach which favours small-scale solar photovoltaic (PV) systems. This move follows global trends, with many countries now viewing renewable energy as technologically mature and affordable, as well as environmentally friendly, and thus are including it in their development strategies (REN21, 2019). Combating climate change (through CO2 reductions) is amongst the main drivers of small-scale embedded generation (SSEG), but recently the significance of cost became increasingly important, as SSEG became financially more attractive in South Africa due to steep increases in the price of grid electricity and a steady decline in the price of solar PV technology (SEA, 2016). SSEG is growing exponentially across South Africa, with, according to South African Photovoltaic Industry Association (SAPVIA), installations as of July 2019 standing at 60 000 countrywide, totalling some 400 MW (Gov-ender, 2019). Other sources estimate the total installed generation capacity for privately owned rooftop and ground-mount systems at an excess of 700 MW in 2019 (AREP, 2019). A breakdown of the solar PV sub-sectors, by installed capacity for the commercial and industrial sector, is given in Figure 1.
An increasing trend in installations is visible across all segments of consumers - including industrial, agricultural, commercial and residential - as the market price continues to fall. Today, solar PV is emerging as one of the most competitive sources of new power generation capacity, with an international overall reduced installation cost of 74% between just 2010 and 2018 (IRENA, 2019). Globally, the total installation cost of solar PV projects is expected to continue to decline dramatically in the next three decades, averaging in the range of USD 340-834 per kW by 2030 and USD 165-481 per kW by 2050, compared to the average of USD 1 210 per kW in 2018 (IRENA, 2019).
With the government's Integrated Resource Plan 2019 making provision for distributed generation, South African municipalities are expecting a big increase in SSEG applications to connect to the local network (<1 MW generators). This is fostered by the exemption for SSEG systems below 1MW from obtaining a generation licence from the energy regulator (NERSA), as well as the countrywide rollout of national small-scale embedded generation rules, regulations and tariffs to promote the safe and legal uptake of SSEG for own use.
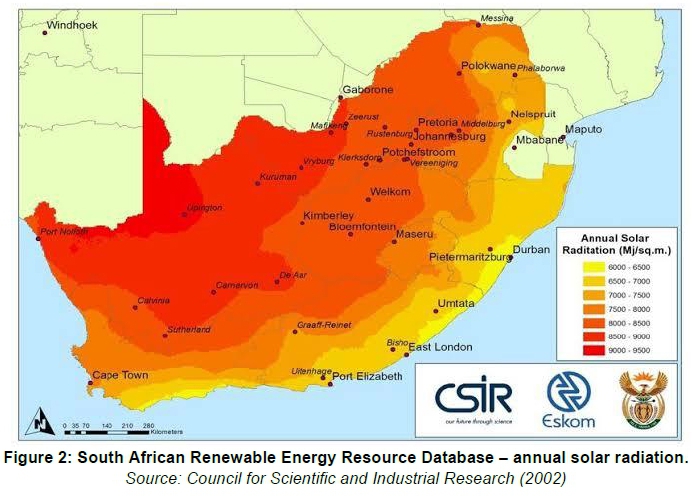
In terms of solar radiation, South Africa is regarded as one of the countries with the best solar resources, these illustrated by the map of the country's annual solar radiation in Figure 2.
Estimates have shown that the deserts of South Africa receive almost 3 000 kW/km2 a year. According to the Department of Minerals and Energy (2018), South Africa's annual direct normal irradiation (DNI) is between 2 500 and 2 900 kWh/m2, putting it amongst the highest in the world. With the country having almost 300 days of sunshine per year, solar PV thus offers a lucrative opportunity.
Several studies have been conducted on grid-tied PV systems over the years. Okello et al. (2015) compare the actual measured and simulated performance of a 3.2 kWp grid-connected PV system in Port Elizabeth, South Africa. Their results showed a measured performance ratio of 84% and that the system supplied a total of 5 757 kWh to the local grid. A study was conducted by Sharma and Goel (2017) on the performance of a 11.2 kWp grid-connected solar power system in Eastern India, where the entire 14.960 MWh of electricity generated by the system was fed into the state grid. Kymakis et al. (2009) evaluated the performance of a grid-connected PV park on the island of Crete, with a peak power of 171.36 kWp; the study showed that the Park supplied 229 MWh to the grid during 2007, and the energy supplied ranged from 335.48869.68 kWh. Bouacha et al. (2020) presented an experimental performance analysis based on results attained from monitoring a 9.5 kWp PV grid-connected solar system for three years. Their results showed that the annual average final yield for the system was 3.37 h/day.
In line with such st udies, this paper presents an analysis of the electrical energy impact of small-scale onsite generation of a 75 kWp grid-tied PV system installed at an aquaculture centre in the Eastern Cape Province of South Africa, during June and July 2019. This impact assessment broadly looks at the energy savings achieved, and the solar PV contribution to the commercial facility.
2. Materials and methods
2.1 Location
The Graaff-Reinet-based freshwater fish farming and processing initiative is said to be one of the biggest aquaculture investments in South Africa to date. The Blue Karoo Trust (BKT) brand, Karoo Catch is located in the Eastern Cape Province of South Africa. Figure 3 shows an aerial view of the aquaculture centre and the location of the PV plant.

2.2 Solar system description
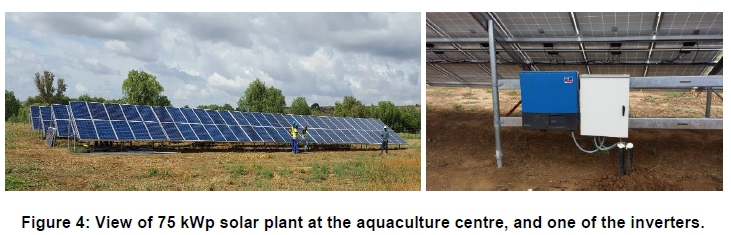
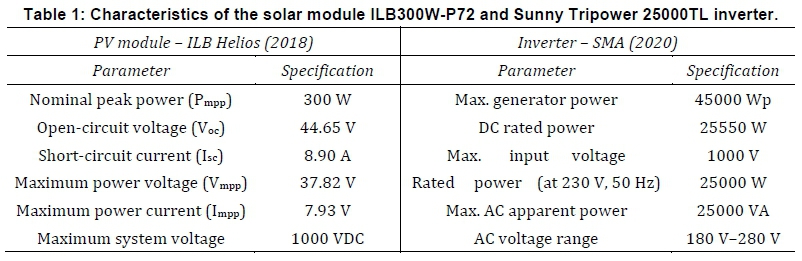
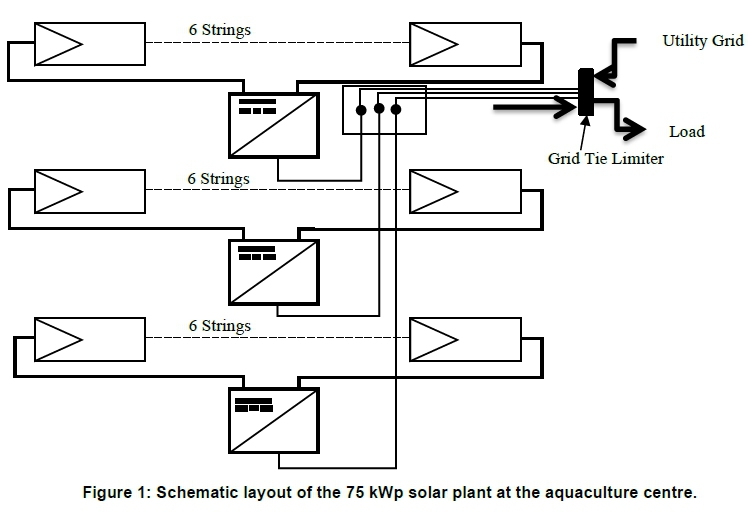
A fixed ground-mounted PV grid-tied 75 kWp installation at the aquaculture centre has been in operation since October 2016, with full system operation commencing in July 2017. The plant consists of 250 polycrystalline modules rated at 300 Wp (ILB300W-P72). The system configuration has 18 strings of 14 modules each. The solar modules are mounted on a steel structure inclined at 32° toward the north and covers approximately 900 m2. The solar plant is shown in Figure 4, and Table 1 shows the specifications of the modules and the inverter used for the plant.
Three 25 kW SMA (Sunny Tripower 25000TL) inverters are used for the system; thus each inverter is connected to six strings. The Sunny Tripower is a transformerless PV inverter with two maximum power point trackers (MPPT), which convert the direct current of the PV array to grid-compliant three-phase current and feed into the utility grid. The inverter is equipped with SMA Speedwire/Webconnect as standard. This is a type of communication based on the Ethernet standard. This enables inverter-optimised 10/100 Mbit data transmission between Speedwire devices in PV systems and the software Sunny Explorer. The Webconnect function enables direct data transmission between the inverters of a small-scale system and the Internet portal Sunny Portal without any additional communication device and for a maximum of four inverters per Sunny Portal system. SMA OptiTrac Global Peak is an advancement of SMA OptiTrac and allows the operating point of the inverter to follow the optimal operating point of the PV array MPP precisely at all times. Figure 5 illustrates the simplified schematic layout of the solar plant.
2.3 Data acquisition system
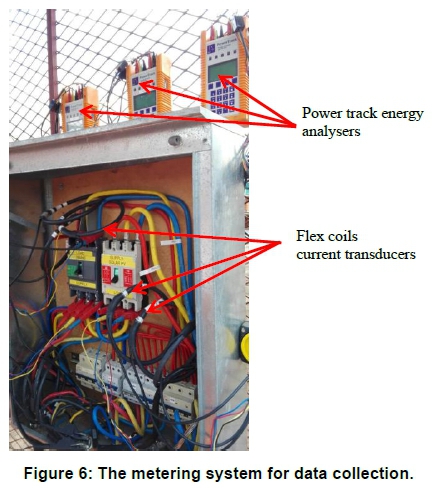
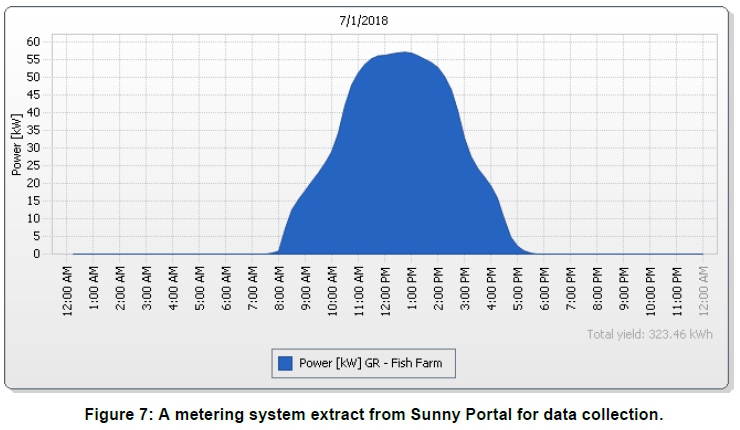
A data acquisition system comprising of three power track energy analysers was installed onsite to measure solar PV generation, demand for the facility, and energy drawn from the utility grid. The power track energy analyser is a Class 1 3 phase meter which enables continuous recording of apparent power (kW) and reactive power (kVAr), with a capacity of data storage in a 4 MB non-volatile flash memory. The meter can be installed at any three-phase (3-wire/2 Watt or 4-wire/3 Watt) and single-phase supplies. The power track uses standard fused voltage leads and various types of current transducers can be used. For the purposes of this study, flexible coils measuring up to 1600 Amps were used. The meters were configured to log at five-minute intervals and the data was further integrated to 30-minute intervals for the duration of the measurements. These meters were installed on the main distribution board, where the PV plant and grid combined to supply the load. They were logging the power and energy output from the PV plant, power and energy drawn from the grid and the power and energy requirements of the load. The measurements were done continuously over a twelve month period (July 2018 to June 2019). Data was downloaded using the power track software and from the Sunny Portal for further analysis. Simulated solar radiation data was obtained from PVGIS. Data analysis was conducted using MATLAB to determine the impact of the solar PV plant on the demand and energy reduction from the utility grid throughout the day, which was further extrapolated into months, and finally the annual contribution of the solar PV to the savings for the aquaculture centre. Also, further analysis was carried to ascertain the contribution of the PV plant in greenhouse gas reduction and the payback period based on the simple payback analysis. Figure 6 shows the three meters (PV, grid and load meters). Figure 7 demonstrates average kW generated by the solar PV plant on 1 July 2018 as accessed from the Sunny Portal.
The solar PV system was fitted with a grid tie limiter which was configured to restrict the PV plant from feeding into the grid. Solar PV performance metrics used for this study include final yield (Yf), capacity utilisation factor (CUF), solar fraction (SF) and performance ratio (PR)
2.4 Calculations and theory
2.4.1 Final yield (Yf)
The final PV yield is defined as the ratio of the AC energy generated by a PV power plant to the rated DC power of the PV power plant at standard test conditions (STC) (IEC, 1998; Adaramola and Vágnes, 2015; Singh et al., 2014; Eke and Demircan, 2013). It indicates the number of full sun hours that PV power plant would operate. It is the most important parameter in comparing the energy generated by PV power plants of different size. It is calculated using Equation 1.

where Enet = net AC energy produced by the PV array (kWh); and Pr = rated DC array capacity (kW).
2.4.2 Solar fraction
The SF is defined as the ratio of the energy supplied by the solar PV system to the total energy consumed by the load at a given instant, and is given by Equation 2.
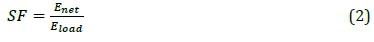
where Eload = total energy required by the load (kWh).
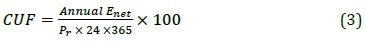
2.4.3 Capacity utilisation factor
The CUF is defined as the ratio of the actual output from a solar plant over the year to the maximum possible output from it for a year under ideal conditions as denoted by Ayompe et al. (2011) and Va-sisht et al. (2016). It is given by Equation 3.
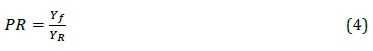
2.4.4 Performance ratio
Performance ratio is the relationship between the yield factor (Yf) and the reference yield (Yr) of the solar plant. PR is given by Equation 4.
where:

and Gopt = total amount of the global solar energy falling on 1m2 of the solar modules on the solar PV system.
2.4.5 Emissions reductions
The emission reductions due to reduced utility grid energy consumption are calculated using established and trusted emission factors linked to energy consumption savings. The emission reductions are calculated for carbon dioxide (CO2), nitrous oxides (NOx), sulphide oxides (SOx) and particulate matter (par) (Eskom, 2019). The emission reduction per MWh was calculated using Equation 6.

where Emission impact x = the reduction of emission X (in kg/year), which can be CO2, NOX, SOx, particulate matter or water; and EFx = Emission factor for emission X (in kg/MWh) for CO2, NOx, SOx, par.
In order to calculate the reductions in the above emissions, the following emission factors were used, according to Eskom (2019):
EFco2 = 1009 kg /MWh;
EFnox = 4.07 kg/MWh;
EFsox = 8.46 kg/MWh;
EFpar = 0.47 kg/MWh.
The annual savings in water consumption on the supply side can be calculated using Equation 7

where WCR = Water consumption reduction (in litres per year) to generate electricity on the supply side due to the reduction in electricity consumption; and Fwater = 1.41 litres/kWh (Eskom, 2019).
3. Results and discussion
The performance of the grid-tied solar system was monitored from July 2018 to June 2019. The results are analysed mainly for the power output of the solar plant, solar and utility grid contribution, energy savings, capacity utilisation factor and solar fraction.
3.1 Peak power output
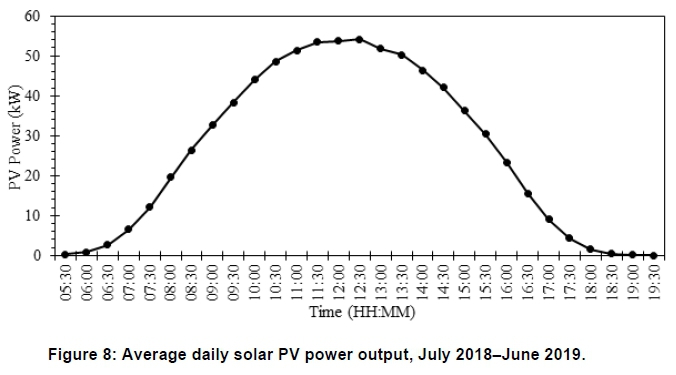
The solar plant started generating as early as 05:30 and continuing to 19:30, in some months for the monitoring period. The power output from the solar PV plant is summarized in Table 2. On average the plant had a power output of between 22.19 kW and 33.55 kW, as recorded during the winter and summer months respectively. The power output from the solar PV reached an average of 27.45 kW and 31.76 kW, considering the winter (July-August, March-June) and summer (September-February) months separately. Figure 8 illustrates the average daily solar PV output power obtained from the half hourly average for the whole period.
It can be deduced from Figure 8 that the average yearly peak power output was 54.20 kW, which occurred around 12:30. Overall, output ranged between 9.35 kW and 51.62 kW. It can be noted that for the whole period studied, the winter months' average daily plant capacity was 34.07%, while for the summer months it was 39.96% on average. It should also be noted that during the peak sunshine hours (09:00-14:00) the plant reached an average of 57.50% and 71.31%, for the winter and summer respectively. The winter period had a maximum of 67.75% (50.81 kW) and the summer had 78.60% (58.95 kW). The increment of plant capacity with about 11% was due to the increase in the intensity of radiation.
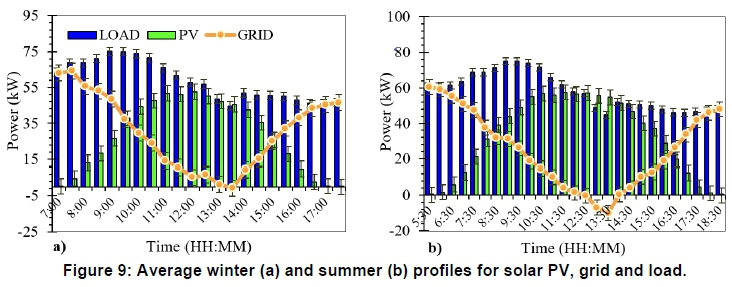
The average daily winter and summer profiles for the PV and grid power output towards the load of the facility for July 2018 to June 2019 is shown in Figure 9.
During the year in consideration, the demand for the aquaculture centre was constant and it exhibited a similar profile through the year studied. The peak demand from the load was 75 kW between 07:00 and 10:00, and during the late afternoon it reduced by about 38.46 % to a minimum of 40 kW. This is attributed to the fact that there will be minimum heating up of the water for the fish by the heat pumps because of elevated ambient temperatures raising the temperature of the water. During both the winter and summer seasons, as the solar PV came online it can be observed in Figures 9 that the demand from the grid started to decrease as preference was being given to the solar PV plant. This was between 05:30 and 07:00 for the summer and winter respectively, and as the day progressed, around 14:00 the grid gradually started to complement the PV until it realigned with the load at about 17:30-18:30.
During winter, the PV system was online from around 07:00 until 17:30, which translates to 10.5 hours of availability. On average the load, grid and PV power profiles were 58.78 kW, 30.34 kW and 28.44 kW respectively. The solar PV plant attained a peak of 52.57 kW. It can be further inferred that during the winter period the solar contribution to the load requirements averaged 46%, with a maximum of 102% at some part of the day (Figure 9). However, due to regulations of the municipality where the system is located, the system is fitted with grid-tie limiter which restricts exporting to the grid. A comparison of the load, grid and PV demand was carried out using ANOVA. The test showed that there was no significant difference between the grid and PV supply for the load, as evidenced by p = 0.76. In that regard, at least 50% of the time the grid catered for 12.44 kW to 54.2 6 kW, with the PV plant catering for 15.70 kW to 50.69 kW as a contribution to meet the demand for the fish farm. It can be deduced the PV plant was online from 05:30 to 18:30 with an average production of 33.18 kW. The maximum production of the system was 57.46 kW. For about 11% of the time, the PV was tying up with the load requirements and producing an excess of 36% - that is, between 12:30 and 13:30. It should be noted that there was a demand peak increase of 8% due to the change from winter to summer. An ANOVA test was conducted for the summer period peak demand and the results showed that there was no significant difference between the grid and PV supply for the load, as evidenced by p = 0.17, and for at least 50% of the time the grid managed to supply the load from 12.44 kW to 54.26 kW, with the PV plant providing 15.70 kW to 50.69 kW to meet the demand. However, during the period 08:00-17:00 for the winter and summer seasons, the means for the two power sources were significantly different, with a p-value = 0.025. Generally, there was an average increase of 26% in generation by the PV system from 32.66 kW to 44.63 kW owing to the change from winter to summer.
3.2 Energy generation
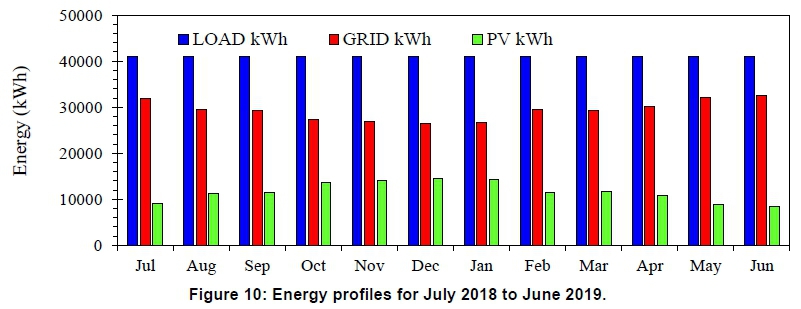
The energy generated by the solar PV, the energy drawn from the grid, and the total energy consumed by the load at the centre for the period July 2018 to June 2019, is presented in Figure 10. The graph shows that average energy requirements for the load did not change over this period, and a constant energy requirement of 40 950.81 kWh was recorded. On average, during the winter months (July, August, March, April May and June) an average energy production of 10 029.68 kWh was achieved by the PV system and the utility grid supplied 30 921.13 kWh. During the summer months, 13 273.90 kWh was generated by the solar plant and 27 676.91 kWh came from the utility grid. It can be deduced that the total annual energy supplied by the solar PV and the utility grid was 13 9821.48 kWh and 35 1588.24 kWh respectively. The results show that during the period July 2018-June 2019 the solar plant contributed 28% of the total farm's energy requirements with the remaining 72% being met by the utility grid. A multi-comparison test was done for the winter and summer energy supply from the solar PV, as reflected in Figure 11.
For 50% of the time the solar plant generated 8 802.91-11 387.46 kWh and 11 558.99-14 281.35 kWh, for winter and summer respectively. Cumulatively, the total energy for winter and summer were 60 178.08 kWh and 79 643.40 kWh respectively.
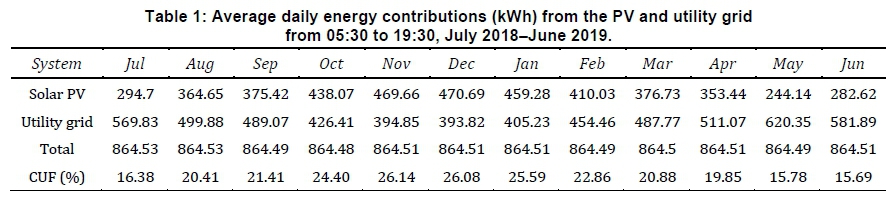
The difference of 24.44% in the generation capacity was generally because of the long sunshine hours for the summer months as well as the increase in radiation during the same period. Table 3 presents the average daily contributions of the solar and the utility grid towards the energy requirements for the farm during 05:30-19:30.
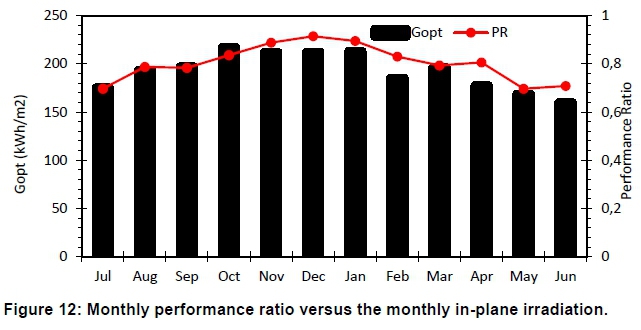
The solar PV system contributed 4 539.43 kWh for the year July 2018-June 2019 between 05:30 and 19:30, an average monthly contribution of 378.29 kWh; the grid contributed 5 834.63 kWh, an average monthly contribution of 486.22 kWh. The solar system provided the bulk of the energy from 10:30-15:30. For 12:30-14:30, it supplied all the energy required by the entire farm, for almost all the months, and 69 kWh of energy was exported into the grid. However, synchronisation of the grid and the solar PV plant through the grid-tie limiter could not allow the system to continue pumping into the grid, given the regulations of the local municipality. The inverters were responding to the energy requirement from the load at all time, as a result of the grid-tie limiter. The annual energy yield for the system was 1 864.29 kWh/kWp, which is significantly high. The average final yields of the system were 5.11 hours per day with winter and summer daily yields of 4.36 and 5.86 hours respectively. It should be noted that the plant had an annual capacity utilisation factor of 21.29% for July 2018-June 2019. Figures 12 and 13 illustrate the monthly performance ratio versus the monthly inplane irradiation and ambient temperature, based on the simulated data from PVGIS.
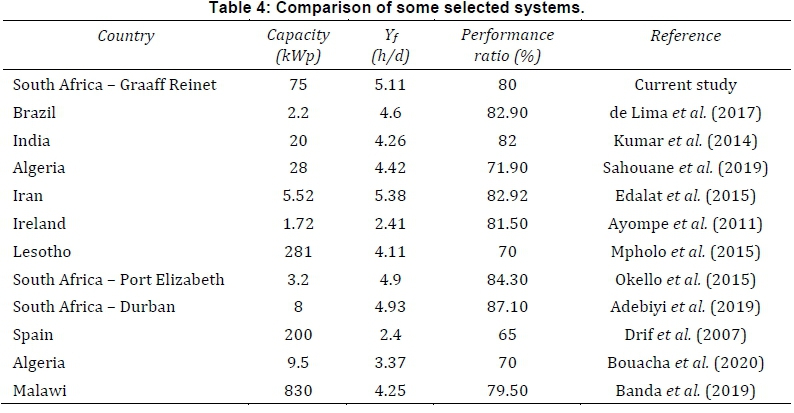
The average performance ratio for the system was 80%. The PR of the system ranges from 0.700.91, with the winter months recording the lowest values. The summer months are charaterised by high insolation as well as high ambient temperatures. It can be noted from the PR that, as temperatures rose from July to December, the performance ratio also increased, with a decrease noticeable from January until winter. This could be as a result of module temperatures tending to increase significantly. Table 4 illustrates a comparison of some selected systems.
The final yield of the present study is higher than that of some studies in Africa and across the world as indicated in Table 4. This is mainly due to the variation in irradiance for the different places where the system is installed. It should be noted that the PR for the current study of 80% is based on simulated radiation data reflecting the substantial solar energy of the Eastern Cape. In that regard, approximately 20% of the incident solar energy in the analysis period is not converted into usable energy due to circumstances such as conduction loss, thermal loss or, for example, defects in components (these not covered in this study).
3.3 Instantaneous solar fraction
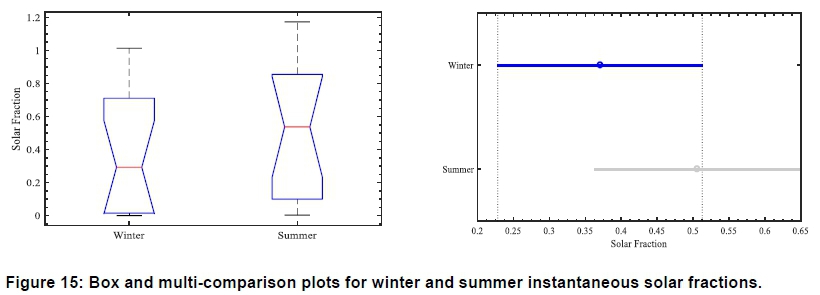
The solar fraction is is defined as the ratio of the energy supplied by the solar PV system to the total energy consumed by the aquaculture centre. For this study the SF was determined for the period 05:3019:30 (sunrise to sunset), as indicated in Figure 14 for typical winter (average for winter months) and summer (average for summer months) days for the studied period. Figure 14 indicates that, between 05:30 and 19:30, average SFs ranged from 0.13 to 0.91. On average the SF from 05:30-19:30 was 0.44, with a maximum of 1.9 achieved at 13:30. One-way ANOVA test and multi-comparison test were conducted for the summer and winter SFs; the box plot and multi-comparison plots are illustrated in Figure 15.
It was deduced that there was no mean significant difference between the winter and summer SFs, as evidenced by the interaction between the summer and winter SFs on the multi-comparison plot. Also, 50% of the time, the solar fraction was 0.015-0.711 during the winter months and 0.1000.855 during the summer months.
3.4 Monthly mean solar fraction
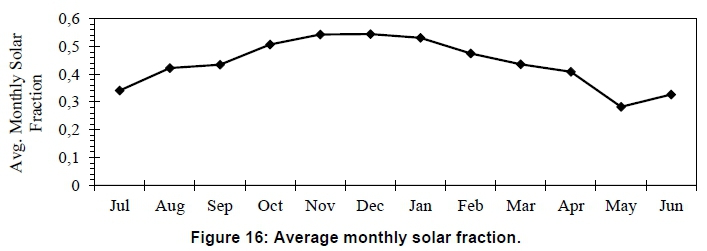
The monthly mean SFs over the twelve-month cycle are presented in Figure 16. It can be deduced from Figure 16 that, on average, the minimum solar fraction was 0.282 and the maximum was 0.544 during May and December respectively.. Higher SFs were achieved during the summer months (September-February), which had an average of 0.51, while the winter months (July-August, March-June) had an average SF of 0.37. On average, the monthly SF for operating the farm between sunrise and sunset was 0.44. Figure 17 compares the monthly SFs.
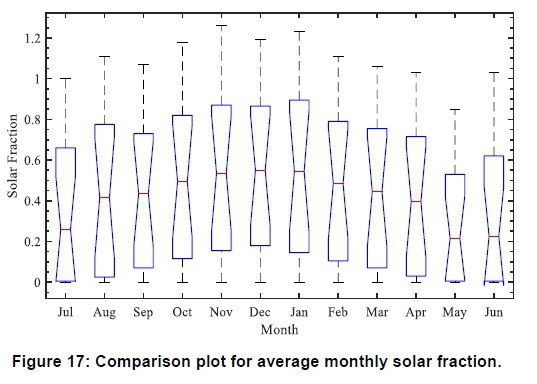
The SFs for all the months followed a normal distribution and there were no outliers. It was deduced that there was no mean significant difference between the monthly SFs. The results show that there was more contribution to the load from the solar PV system during summer (averaging 62% for 05:3018:30) than winter (57%).
3.5 Greenhouse gas emissions reduction
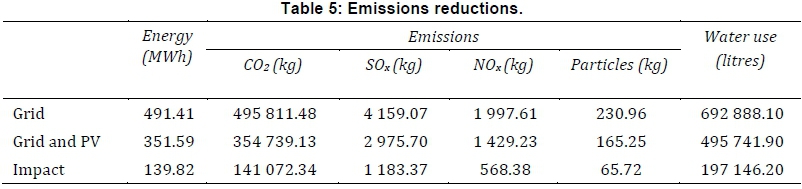
The implementation of the PV system also led to reductions in greenhouse gas emissions and the amount of water used for energy generation from coal power plants. These reductions for July 2018-June 2019 are summarised in Table 5.
Savings of 139.82 MWh were realised through implementing the solar PV plant at the facility for the year, while a total of 141.072 tCO2 was avoided, as well as 1.183 tSOx and 0.568 tNOx.
3.6 Investment analysis
The installation of the solar plant at the aquaculture centre resulted in significant electricity and cost saving.The plant was built at a cost of ZAR 2 million. For the economic analysis, the simple payback period was used to assess the economic performance of this installation based on energy savings. The on-site consumption flat rate tariff of ZAR 1.95/kWh for 2018-2019 was used. Table 6 summarises the energy and cost savings from the installation of the plant.

From this analysis, it was calculated that the payback period for the plant will be 7.34 years. A further analysis was made, based on an assumed average annual inflation rate of 5.2%, and keeping average energy generation for the plant at 139.82 MWh/year. In this scenario, the payback period reduces to 6.44 years.
4. Conclusion
The 75 kWp grid-tied PV system installed at an aq-uaculture centre in the Eastern Cape province of South Africa was monitored between July 2018 and June 2019, and its monthly and annual energy savings were analysed. The final yield of the PV system was compared with that of other grid-tied PV systems. Based on this analysis, the notable findings from this study are as follows.
• The yearly average final yield of the 75 kW system was 5.11 hours per day (1 864.29 kWh/kWp per year), which is higher than the final yield of all other studies referred to in Table 3 and some studies in South Africa.
• The total energy output per annum from solar PV plant was 139.82 MWh, which was the savings realised by the centre during its operation for the studied period.
• The solar contribution to the load requirement was 28%.
• The mean monthly solar fraction for operating the farm between sunrise and sunset was 0.44.
• The total avoided CO2e amounted to 141.07 tCO2e.
• The estimated payback time for the system, based on a simple payback analysis, is 7.34 years; 6.44 years if an annual inflation rate of 5.2% is considered.
5. Future work
Further performance evaluation of the PV plant should be undertaken, to determine the losses encountered by the system, the effects of panel degradation on the energy yield, and a detailed cost-benefit analysis of operating the PV plant.
Author roles
Russel Mhundwa conceptualised the study, research formulation, data analysis, and write-up.
Michael Simon conceptualised the study, quality assurance and guidance, checked results and reviewed the text.
Joel Nana Yongoua: Data collection, data analysis and write up.
Acknowledgements
The authors thank the University of Fort Hare for financial support to conduct the research.
References
Adaramola, M.S. and Vägnes, E.E., 2015. Preliminary assessment of a small-scale rooftop PV-grid tied in Norwegian climatic conditions. Energy Conversion and Management, 90: 458-465. https://doi.org/10.1016/j.encon-man.2014.11.028 [ Links ]
Adebiyi, A.A., Lazarus, I.J., Saha, A.K. and Ojo, E.E., 2019. Performance analysis of 8 kW Grid-tied solar photovoltaic power plant in Durban South Africa. International Journal of Mechanical Engineering and Technology, 10(4): 82-95. https://doi.org/10.34218/IJARET.10.4.2019.017 [ Links ]
Akinyele, D.O., Rayudu, R.K. and Nair, N.K.C., 2015. Development of photovoltaic power plant for remote residential applications: The socio-technical and economic perspectives. Applied Energy, 155: 131-149. https://doi.org/10.1016/j.apenergy.2015.05.091 [ Links ]
Ayompe, L.M., Duffy, A., McCormack, S.J. and Conlon, M., 2011. Measured performance of a 1.72 kW rooftop grid connected photovoltaic system in Ireland. Energy Conversion and Management, 52(2): 816-825. https://doi.org/10.1016/j.enconman.2010.08.007 [ Links ]
Banda, M.H., Nyeinga, K. and Okello, D., 2019. Performance evaluation of 830 kWp grid-connected photovoltaic power plant at Kamuzu International Airport-Malawi. Energy for Sustainable Development, 51: 50-55. https://doi.org/10.1016/j.esd.2019.05.005 [ Links ]
Bouacha, S., Malek, A., Benkraouda, O., Arab, A.H., Razagui, A., Boulahchiche, S. and Semaoui, S., 2020. Performance analysis of the first photovoltaic grid-connected system in Algeria. Energy for Sustainable Development, 57: 1-11. https://doi.org/10.1016/j.esd.2020.04.002 [ Links ]
CSIR [Council for Scientific and Industrial Research], 2002. South African Renewable Energy Resource Database - Annual Solar Radiation. [ Links ]
De Lima, L.C., de Araújo Ferreira, L. and de Lima Morais, F.H.B., 2017. Performance analysis of a grid connected photovoltaic system in northeastern Brazil. Energy for Sustainable Development, 37: 79-85. https://doi.Org/10.1016/j.esd.2017.01.004 [ Links ]
Department of Minerals and Energy, 2018. Annual report. Online at http://www.dmr.gov.za/resources. Accessed 08/10/2020. [ Links ]
DoE [Department of Energy], 2019. Integrated resource plan. http://www.energy.gov.za/files/docs/IRP%202019.pdf. [ Links ]
Drif, M., Pérez, P.J., Aguilera, J., Almonacid, G., Gomez, P., De la Casa, J. and Aguilar, J.D., 2007. Univer Project. A grid connected photovoltaic system of 200kWp at Jaén University. Overview and performance analysis. Solar Energy Materials and Solar Cells, 91(8): 670-683. https://doi.org/10.1016/j.solmat.2006.12.006 [ Links ]
Edalati, S., Ameri, M. and Iranmanesh, M., 2015. Comparative performance investigation of mono-and poly-crystalline silicon photovoltaic modules for use in grid-connected photovoltaic systems in dry climates. Applied Energy, 160: 255-265. https://doi.org/10.1016/j.apenergy.2015.09.064 [ Links ]
Eke, R. and Demircan, H., 2013. Performance analysis of a multi crystalline Si photovoltaic module under Mugla climatic conditions in Turkey. Energy conversion and Management, 65: 580-586. https://doi.org/10.1016/j.enconman.2012.09.007 [ Links ]
Eskom Holdings Limited, Integrated Report 2019. Accessed on 12 August 2020 from http://www.eskom.co.za/IR2019/Pages/default.aspx. [ Links ]
Hrayshat, E.S. and Al-Soud, M.S., 2004. Solar energy in Jordan: current state and prospects. Renewable and Sustainable Energy Reviews, 8(2): 193-200. https://doi.org/10.1016/j.rser.2003.10.005 [ Links ]
ILB Helios Spain SA. 2020. Technical specifications. Accessed from http://www.solarsolved.co.za/datasheets/solar-panels/ILBHelios/300Watt.pdf on 08/10/2020. [ Links ]
International Electrotechnical Commission, 1998. Photovoltaic system performance monitoring-guidelines for measurement, data exchange and analysis. IEC 61724. [ Links ]
IRENA [International Renewable Energy Agency], 2019. Future of solar photovoltaic: Deployment, investment, technology, grid integration and socio-economic aspects (A Global Energy Transformation paper), International Renewable Energy Agency, Abu Dhabi. [ Links ]
KamalAttari, A., & Elyaakoubi, A., 2016. Performance analysis and investigation of a grid-connected photovoltaic installation in Morocco. Energy Reports, 2, 261-266. https://doi.org/10.1016/j.egyr.2016.10.004 [ Links ]
Kumar, K.A., Sundareswaran, K. and Venkateswaran, P.R., 2014. Performance study on a grid connected 20 kWp solar photovoltaic installation in an industry in Tiruchirappalli (India). Energy for Sustainable Development, 23: 294304. https://doi.org/10.1016/j.esd.2014.10.002 [ Links ]
Kumar, M. and Kumar, A., 2020. Experimental characterization of the performance of different photovoltaic technologies on water bodies. Progress in Photovoltaics: Research and Applications, 28(1): 25-48. https://doi.org/10.1002/pip.3204 [ Links ]
Kymakis, E., Kalykakis, S. and Papazoglou, T.M., 2009. Performance analysis of a grid connected photovoltaic park on the island of Crete. Energy Conversion and Management, 50(3): 433-438. https://doi.org/10.1016/j.enconman.2008.12.009 [ Links ]
Mpholo, M., Nchaba, T. and Monese, M., 2015. Yield and performance analysis of the first grid-connected solar farm at Moshoeshoe I International Airport, Lesotho. Renewable Energy, 81: 845-852. https://doi.org/10.1016/j.renene.2015.04.001 [ Links ]
Govender, N. 2019. Debating the benefits and challenges of SSEG. Electric Power and Energy, July 2019: 8-9. [ Links ]
Okello, D., Van Dyk, E.E. and Vorster, F.J., 2015. Analysis of measured and simulated performance data of a 3.2 kWp grid-connected PV system in Port Elizabeth, South Africa. Energy Conversion and Management, 100: 10-15. https://doi.org/10.1016/j.enconman.2015.04.064 [ Links ]
Pandarum A, Lekoloane G, Milazi D, 2019. Trends and statistics of solar PV distributed generation in South Africa. Available at https://bit.ly/2RcqoYK. [ Links ]
Association for Renewable Energy Practitioners (AREP) , 2019. Report on the estimated growth for the Solar PV sector for 2019. Available at https://arepenergy.co.za/south-africa-solar-pv-update-2019/. [ Links ]
Photovoltaic Geographic Information Systems (PVGIS) 2020. Accessed from http://re.jrc.ec.europa.eu/pvgis/apps4/pvest.php?lang=en&map=africa on 08/10/2020 [ Links ]
Quansah, D.A., Adaramola, M.S., Edwin, I.A. and Anto, E.K., 2016. An assessment of grid-charged inverter-battery systems for domestic applications in Ghana. Journal of Solar Energy,1-11. https://doi.org/10.1155/2016/5218704 [ Links ]
Renewable Energy Policy Network for the 21st Century (REN21), 2019. Renewables in cities: 2019 global status report. REN21 Secretariat, Paris. [ Links ]
Sahouane, N., Dabou, R., Ziane, A., Necaibia, A., Bouraiou, A., Rouabhia, A. and Mohammed, B., 2019. Energy and economic efficiency performance assessment of a 28 kWp photovoltaic grid-connected system under desertic weather conditions in Algerian Sahara. Renewable Energy, 143: 1318-1330. https://doi.org/10.1016/j.renene.2019.05.086 [ Links ]
Sustainable Energy Africa (SEA), 2016. City of Tshwane Sustainable Energy Framework: Suggested strategies and actions to pursue a sustainable energy future. Accessed from http://www.cityenergy.org.za/uploads/resource_420.pdf on 08/10/2020. [ Links ]
Sharma, R. and Goel, S., 2017. Performance analysis of a 11.2 kWp roof top grid-connected PV system in Eastern India. Energy Reports, 3: 76-84. https://doi.org/10.1016/j.egyr.2017.05.001 [ Links ]
Sharma, S., 2017. Performance analysis of grid-connected photovoltaic systems in Western India: A case study. International Journal of Engineering Trends and Technology, 1(1). [ Links ]
Singh, V.P., Ravindra, B., Vijay, V. and Bhatt, M.S., 2014. A comparative performance analysis of C-Si and A-Si PV based rooftop grid tied solar photovoltaic systems in Jodhpur. In 2014 International Conference on Renewable Energy Research and Application: 250-255. IEEE. https://doi.org/10.1109/ICRERA.2014.7016565 [ Links ]
SMA Solar Technology. 2020. Inverter technical specifications Accessed from https://files.sma.de/downloads/STP15-25TL-30-DS-en-40.pdf on 08/10/2020. [ Links ]
* Corresponding author: +27 (0)67 267 3500;email: rmhundwa@gmail.com

