


Services on Demand
Article
 English (pdf)
 Article in xml format
 Article references
Indicators

Related links
-
 Cited by Google
 -
 Similars in Google
Share

 Permalink
Journal of Energy in Southern Africa
On-line version ISSN 2413-3051
Print version ISSN 1021-447X
J. energy South. Afr. vol.31 n.3 Cape Town Aug. 2020
http://dx.doi.org/10.17159/2413-3051/2020/v31i3a8002
ARTICLES
The adoption of energy efficiency and a policy framework for Zimbabwe
Oliver DzoboI, *; Henerica TazvingaII; Chido Hermes ChihoboIII; Edward ChikuniIV
IDepartment of Electrical and Electronic Engineering Science, University of Johannesburg, South Africa ORCiD: https://orcid.org/0000-0001-9602-6835
IISouth African Weather Service ORCiD: https://orcid.org/0000-0002-7538-6169
IIIDepartment of Fuels and Energy, Chinhoyi University of Technology, Zimbabwe ORCiD: https://orcid.org/0000-0003-1653-3891
IVDepartment of Electrical Engineering, Botho University, Botswana ORCiD: https://orcid.org/0000-0002-7691-7822
ABSTRACT
Recent policy discussions on energy use in Zimbabwe sparked interest in the economic case for energy efficiency, suggesting the need to investigate the relevant costs and benefits. This paper investigated the potential of energy efficiency in manufacturing industries in Zimbabwe. Data collection was done using questionnaires, walk-through audits and semi-structured interviews. The data set was then analysed using regression analysis. The results show that there would be significant potential energy saving in Zimbabwe through adopting various energy efficiency programmes. The main energy efficiency barriers identified were: poorly structured electricity tariffs; risk of production disruption; resistance of operational staff to a changed working style; lack of coordination between company divisions; lack of information on energy efficiency programmes; and lack of support from senior management on issues that relate to energy efficiency. A straightforward energy efficiency policy framework is proposed, and three main players identified, namely government, energy regulator, and research institutions.
Keywords: investment, energy regulator, Zimbabwean industry, energy research
1. Introduction
The world increase in demand for energy has doubled in the last decade (International Energy Agency (IEA), 2017). Energy access is used as a measure for the living standard level of people in a country (Legros et al., 2009; Azimoh et al., 2017). The use of fossil fuel presents many challenges to the environment, owing to the greenhouse gases (GHG) produced in the energy production process when fossil fuels are used, and this has increased the interest in renewable energy and energy conservation (Sichilalu et al., 2016; Dzobo & Xia, 2017; Dzobo & Sun, 2019). Energy conservation efforts can be divided into two categories, namely energy efficiency (EE) and demand response. Energy efficiency is the cheapest way of conserving energy as it does not need any changes to the power system network for it to be effective.
Recent world energy use estimates from the IEA show that it will grow by approximately 30% by 2040 (IEA, 2017), requiring an investment of about USD 26 trillion to enhance system capacity to cater for this increment. Developing countries are expected to contribute a significant portion of this expected growth: the IEA states that, as they develop their industries, their contribution would be about 20%. Therefore, there is a critical need for developing countries to be able to keep pace with their growing energy needs so that socioeconomic development is not hampered. Energy efficiency has been singled out as one of the most important policy interventions that can help meet this substantial growth in energy demand.
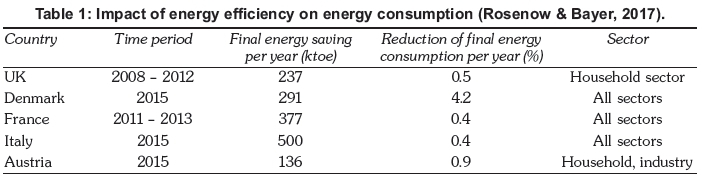
The economics of EE, in terms of benefits and costs, has been a debate for several years (Cagno et al., 2019; Sarkar & Singh, 2010;). The bone of contention is on agreeing which EE programmes are most cost-effective, and the technological applicability of such programmes. Although EE programmes have shown the potential for great financial returns, EE is far from being considered comparable with other investments projects. Research on the cost-effectiveness of different types of EE programmes is still scarce, especially for developing countries such as Zimbabwe. Table 1 shows the final energy savings of selected countries as a result of implemented EE programmes.
The results show that the impact and cost-effectiveness of the EE programmes that were analysed is very high. Denmark has the highest energy saving percentage, and France and Italy the lowest.
Figure 1 shows energy consumption in Zimbabwe from 2000 to 2018, indicating a significant reduction in energy consumption between 2014 and 2018. This was, however, mainly due to reduced production in most sectors rather than energy efficiency, as discussed below.
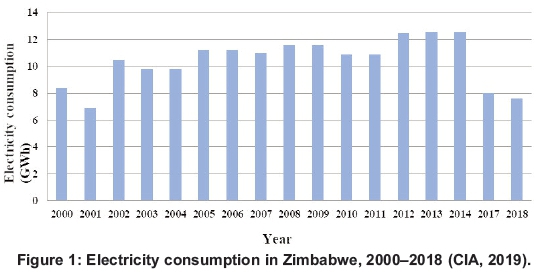
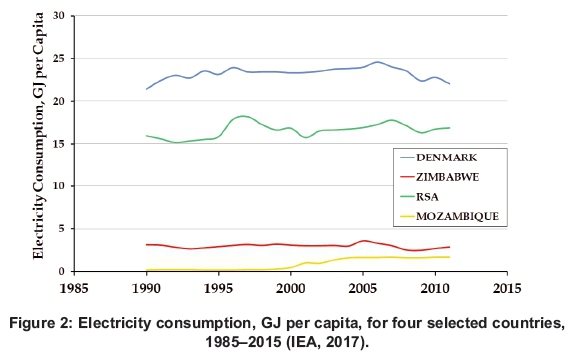
Figure 2 shows the electricity consumption per capita of four different countries, with Zimbabwe's higher than Mozambique's, but very much lower than that of neighbouring South Africa, let alone Denmark.
The government of Zimbabwe has predicted economic growth of 2.5% to 5% in the next five years (ADB, 2019a). However, the acute shortage of electricity has been identified as the main hindrance to this growth, and this has sparked a debate on energy efficiency in all sectors. There has been a lot of load shedding due to the high electricity demand and depleted power industry infrastructure. Manufacturing industries have been finding it difficult to operate under such conditions and the government has opened discussions on the costs and benefits of energy efficiency, as part of the National Action Plan for Energy goal for achieving cost-effective energy efficiency by 2030 (ADB, 2019b). The government has also said that it will achieve the status of a middle-income economy by 2030, and this has put pressure on the already acute shortage of power in the country. The Zimbabwean government through its regulatory arm, the Zimbabwe Energy Regulatory Authority (ZERA), has pointed out the need of a regulatory framework in order to optimise the benefits of energy efficiency (MEPD, 2011). This can only be achieved when the economic case for EE is investigated and revealed.
This paper presents the costs and benefits of introducing EE programmes in Zimbabwe, and proposes an EE policy framework. It aims to identify barriers to the adoption of EE in industry, to assess the importance and prevalence of these barriers, and provide a framework for policy makers to effectively address them. The paper is organised as follows: Section 2 reviews the core benefits of EE and how other countries have benefited from it; Section 3 presents a case study which quantifies the costs and benefits of EE, and Section 4 presents concluding remarks and a discussion of policy implications.
2. The energy efficiency concept
Energy efficiency is defined as a process of reducing the electricity required to perform a particular task or activity through more efficient end-use devices (Patterson, 1996; Giacone & Manco, 2012). This may involve the installation of new energy-efficient devices or the replacement or adjustment of existing devices. EE programmes should not affect the end product of the task or activity, but result in the same or better levels of enery service.
To measure EE is a difficult task and a number of different indicators that quantify changes in EE are used (Giacone & Manco, 2012; Worrell et al., 2003). In simple terms, EE is the ratio between the useful output of a process or task with the energy input into the process or task (Patterson, 1996). The difficulty arises when one tries to define the useful output of a task and the energy input. This has given rise to several proposed methodologies and a number of different indicators have been derived (Varone & Aebischer, 2001; Tanaka, 2008). The choice of indicators is dependent on the individual and the intended use of the indicator. Indicators fall into three categories, as follows:
Economic: In these metrics, the energy input and service delivery are evaluated in monetary terms. These are highly aggregated metrics which are derived from data collected from government or international databases. The energy input to gross domestic product (GDP) ratio is the most commonly used aggregate economic metric for measuring a nation's EE (Patterson, 1996; Greening et al., 2000; Boyd & Pang, 2000). The metrics are normally used for high-level policy strategies but are not short-term EE indicators. Their main disadvantage is that they include many other effects besides EE, such as the fuel mix used to provide electricity, power sector efficiency, etc. Commonly, they are used as indicators to show the trend of biggest GHG emitters, and can be determined at different geographical levels. Data used to derive these metrics normally come from national surveys, which are sometimes not well coordinated.
Process output: These metrics are specifically designed to reflect the relationship between the physical units and the end-use consumer service. For example, in the transport industry, the cargo weight of freight over a defined distance is the desired output which can be measured in tonnes per kilometre. The metrics have the advantage that they can be compared across all industries because the physical units do not change. Sometimes, hybrid metrics can be used as an EE measure and can be developed on a sectoral basis to match their outputs (Boyd & Pang, 2000, Wei et al., 2007). For example, in the residential or commercial sectors, the commonly used process output metric is energy input per square metre. In such cases, this metric can be extended to take into account, for example, the total number of degree days or amount of hot water used.
Market segment: These metrics are normally measured at market segment or sector level. They therefore vary for each sector, mainly depending on the type of equipment used in that sector. For example, in the residential sector, the measure can be derived by tracking the average efficiency of specific home appliances according to test standards adopted in the country. In office buildings (commercial sector), this can be achieved by collecting data on the thermal conductivity of the building envelope. This data can be collected over a long period and used to calculate the energy savings in a specific sector.
2.1 Energy efficiency programmes
2.1.1 Voluntary programmes and agreement
In this type of EE programme, the government can engage the industrial sector and come up with different programmes for each group or type of industry. The EE programmes or agreements can be in the form of contracts that are negotiated between the government and the entity (Geller et al., 2006; Worrell & Price, 2001; Painuly et al., 2003). The agreements can be in different forms: for instance, a complete voluntary agreement, or a voluntary agreement with future taxes or regulations if the agreement is violated, or a voluntary agreement with energy or carbon taxes. Several research studies have shown that voluntary agreements with penalties yield the best results (Painuly et al., 2003; Sarkar & Singh, 2010). These voluntary agreements can cover a period of five to ten years to allow for the targeted industry partners to plan and implement the EE programme. The long-term advantages of these voluntary agreements are that the employee attitudes towards electricity usage will change, and they encourage quick adoption of innovative and technological industrial equipment. They also allow industry to engage with technology research and development institutions in their efforts to reduce electricity use and thus encourage continuous engagement of cooperation that provides learning mechanisms within the industry.
2.1.2 Financial programmes
The government can use financial incentives or rebates to encourage industry to invest in EE technologies. The financial incentives can be in the form of grants, reduced taxes on energy-efficient equipment, tax reductions and/or credits (Abrahamse et al., 2005; Berg, 2015; Rohdin & Hollander, 2006). These programmes have been widely used in many countries, and research studies have shown that significant energy saving can be achieved and result in new, innovative, energy-efficient technology companies (Zhou et al., 2010; Laitner, 20l3). This has resulted in the growth of the industry and the creation of more job opportunities. The application of such EE strategies is, however, still limited in most developing countries like Zimbabwe. This is mainly because of the limited capital base of investors and financial institutions. Research has shown that financial institutions play an important role in providing the project finance and often influence the technology choice and direction of innovation for any industry (Painuly et al., 2003; Palm & Thollander, 2010). To encourage financial institutions to provide loans or capital for the EE programmes, the government can provide a buffer to reduce the associated risks that prevent most of the financial institutions from providing financial support for industrial EE projects.
2.1.3 Regulation and labelling
Most countries have energy regulatory boards that govern how energy is used. In Zimbabwe, ZERA has the mandate to monitor and enforce regulations on how to efficiently use electricity. Where these regulators are actively involved, it has been proven that significant reduction in electricity usage can be achieved (Berg, 2015). The government, through its regulatory arm, can enforce a mandatory labelling of mass-produced equipment or the type of imported equipment used in industry, such as motor systems, light bulbs, etc.
2.1.4 Technology research and innovation
Several research studies have shown that technological improvement and innovation in most industrial process can save more than half of their electricity usage (Hasanbeigi et al., 2010; Ernedal & Gombosuren, 2011; Zhou et al., 2010; Sardianou, 2008). Technology research needs to capture the potential savings and evaluate the different energy-efficient technologies, based on parameters such as performance criteria, cost-competitiveness and safety, to ensure acceptance by consumers. Commonly, in most industrialised countries, the government is responsible for identifying the barriers to technology and finding the solutions that improve the performance: that is, cost, environmental concerns, safety, and customer acceptance (Rosenow & Bayer, 2017). However, the industry must be able to bear the associated risk of the technology and capture the benefits of commercialising the technology. Adoption of new technology by industry entails re-training of personnel, and this is the main reason that most industries do not take up new EE technologies.
2.2 Benefits of energy efficiency
Participant benefits: These are benefits that individuals and business attain as a result of directly participating in EE programmes. The most commonly discussed benefit is that of energy cost-saving, although there are other benefits, like increased comfort or increased value of property or assets (Elliot et al., 2011; Amann, 2006; Dzobo et al., 2017; Oikonomou et al., 2009). The energy-saving benefit can be modelled with respect to time in order to balance the investments made and the cost of energy-saving. Initially, the cost is high, but over a longer period the energy-saving benefits will surpass the cost of implementing the EE measures. It is sometimes difficult to quantify or appreciate the value of other benefits such as increased comfort. In some research studies, increased comfort is modelled with respect to temperature changes and preferences, and this is converted to cost by a constant (Setlhaolo & Xia, 2014), enabling it to be included in the model.
Utility benefits: These are benefits that the power provider experiences in providing energy services to its customers. The power utility will benefit most from the decrease in energy consumption, which means less pressure on its transmission lines and thus a reduction in transmission losses (Saulo et al., 2010a; Saulo et al., 2010b). Reduced pressure on transmission lines means the power provider will be able to defer transmission line generation, distribution investments or upgrades. In addition, there will be reduced GHG emissions, a requirement which most power providers are now exposed to, as pressure from environmentalist and government institutions have increased. The deferred investments by the power provider depend on the scale of EE measures and the number of participants in the EE programmes. On the other hand, the power utility will also suffer from reduced revenue collection as participating electricity customers reduce energy consumption.
Social benefits: The most common societal benefit is that of reduced GHG emissions from the power generation plants. This adds to health benefits such as reduced respiratory diseases. Improved comfort is also an important social benefit that encourages most participants to engage in EE programmes.
2.3 Barriers to energy efficiency
Market barriers: There is a lack of information or knowledge about energy efficiency on the part of the electricity consumer (Varone & Aebischer, 2001; Cagno et al., 2013; Schleich & Gruber, 2008). This causes lack of confidence in the available information and proposed different EE programmes. The lack of government support and involvement as a customer is also a big hinderance to the adoption of EE programmes, because large potential EE projects lie in government-owned facilities or entities. The lack of competition among companies means entities will not see the incentive to cut costs using the EE products. In most cases, the financial institutions who are supposed to fund the EE programmes are not willing to fund the EE project as long as the company is doing financially well. In some countries, market development of EE programmes is hindered by poor energy policies and practices (Painuly et al., 2003; Berg, 2015; Saulo et al., 2010a). For example, in countries where there is poor electricity revenue collection, most entities do not value the need to reduce their electricity bills since they will anyway not be paying for the actual electricity usage. Non-market electricity prices and bad quality of supply of electricity are additional factors that affect the marketing of EE programmes to consumers.
Institutional barriers: EE programmes in different entities are normally driven by the behaviour of decision makers, such as financial managers in the entity. Each entity is guided by its own rules of procedure when making an investment. In some entities, preference is given to modernising manufacturing processes and environment awareness. In most public sector entities, procurement is always centred on assets rather than services (Sarkar & Singh, 2010), which hinders the market for EE programmes, as these entities are the ones that have large potential EE projects. Weak legal and contract enforcement frameworks in many developing countries means that the adoption of EE there is slow (Legros et al., 2009). The lack of trained technical personnel in most entities to champion EE programmes is also a hindrance. Most of the personnel are there to maintain the production process only. In most cases, the disruption caused by the implementation of EE programmes in the production process is also a barrier, as it is perceived to lead to high transition or opportunity costs.
Financial barriers: Capital is the main hindrance to EE programme adoption in many countries. The lack of financial institutions that are willing to fund EE programmes due to their initial capital-intensity slows their adoption (Sarkar & Singh, 2010; Boyd & Pang, 2000). This is mostly experienced in small- to medium-sized entities, which are the majority of companies in most developing countries, as they fail to access the capital required to initiate the EE programmes. In some cases, the EE projects are so small that the financial institution or the entity will see no need to implement the project because of its viability or ability to pay for itself.
3. Case study
3.1 Methodology
Data collection for this research study was carried out using questionnaires, walkthrough audits, and semi-structured interviews with high level management, as well as more detailed data-logging. The combination of these data collection methods allowed the authors to get a deep understanding of the existing EE barriers that most industries face. Eighteen (18) energy-intensive manufacturing and commercial industries were surveyed, and the results are presented in this paper. The industries were selected across the whole country of Zimbabwe and in accordance with the requirements of the regulatory authority, ZERA. The requirements were based on the geographical location and energy consumption of the company or entity. The questionnaires were designed to capture the baseline data of each company and tailored to suit the activities and equipment inventories of particular sectors or subsectors. The baseline data was for the period July 2012 to June 2013. Sectors investigated were food processing, metal processing, cement and brick manufacture, textile processing, and mining. Walk-through audits were done to identify the obvious areas of energy wastage, maintenance conditions and areas that require detailed assessments. The walk-through audits also allowed an understanding of facility operations and the types of technologies used. A systematic approach was followed, and assessors used checklists and scoring systems prepared for each sector in order to ensure consistency in evaluation. The results from the walk-through audits were mainly qualitative, except for spot measurements like office temperature, light intensity, and power consumption of different pieces of equipment. These results would then guide the assessors on key areas of further investigation in the audit. More detailed data-logging for the identified key areas was then performed. Typical measurements would include entity energy use data-logging lasting for up to a week, in order to determine the entity's load profiles and power quality. In most cases the detailed data-logging would focus on the top 20% of systems, or processes that contribute at least 80% of the site energy use. The top 20% energy use equipment were identified from the entity's process equipment inventory. Data-capturing equipment used in the audit included electronic data-loggers, a thermal imaging camera, and a fluke gas analyser.
The energy-use models were determined using simple linear regression analysis (standard ordinary least squares) (Navidi, 2008). The first step in deriving the energy-use models was to perform a scatter diagram analysis in order to find the variables that have the highest coefficient of correlation value with energy consumption. A coefficient of correlation above 0.7 was considered to be good enough to generate a valid energy-use model for the assessed entity. The linear regression model assumes that a linear relationship exists between the respective variable and energy use. The linear regression model would take a mathematical linear relationship as given by Equation 1.
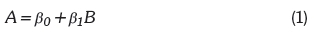
where ß0and ß1are the coefficients of regression (constant and gradient of the linear relationship respectively, A is the dependent variable (output variable), and B is the predictor variable being investigated (respective input variable).
The strength of relationship or association between the dependent variable and the predictor variable is measured using the coefficient of determination, R2. The coefficient of determination, R2 is given by Equation 2.
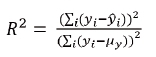
where yiis the predicted value from the regression model for observation i, y is the actual value for observation i, and μyis the mean for all observations.
The coefficient of determination, R2 varies between 0 and 1. When R2 is 0, the prediction error is very large and the regression model has no predictive power at all. When R2 is 1, there is no prediction error, which means the regression model is exact. The quantitative data results in this paper are reported in terms of R2.
The energy use was modelled at the energy service demand or process stage, while in other instances an equipment was explicitly modelled alone. The process and equipment were parameterised using the unit energy consumption. This paper does not present all the results obtained from the survey, for confidentiality reasons, but only to enough to highlight the potential of energy-saving through EE programmes in Zimbabwe.
3.2 Results and discussion
Figure 3 shows the regression analysis of clinker for one of the surveyed industries. The regression analysis was done between electricity consumption and tonnes of clinker. The graph shows that about 94% kWh of electricity consumption is explained by the tonnes of clinker. The linear relationship between electricity consumption and tonnes of clinker shows that 1 million kWh of electricity is required just to run the production line equipment without feeding in the clinker. When the clinker is fed into the production line, electricity consumption increases linearly at a gradient of 79.80 per tonne of clinker added.
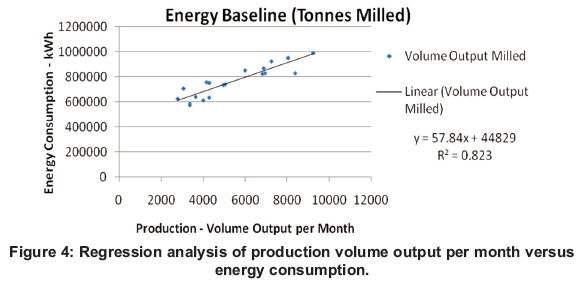
Figure 4 shows the relationship between production volume output per month with electricity consumption. The regression model shows a linear relationship with a coefficient of determination, R2, of above 82%. Both Figures 3 and 4 show good predicting power of the regression models, which can be used to predict future electricity consumption for the respective production variables that are outside the range analysed.
Figure 5 shows the state in which some electrical machines, like motors, were operating in the industry. It is clearly seen from the graph that the compressor motor operates at a low power factor of about 0.35, which means that 65% of the energy supplied to it is wasted.
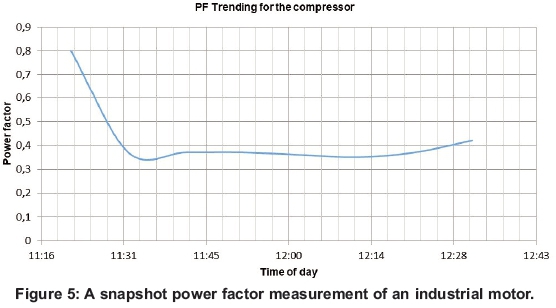
The main cause of this situation was found to be that most of the motors are repaired or rewired by the companies, and they do not conform to the stipulated standard. In some cases, it was found that the companies were reluctant to fix their low power factor electrical motors, since this would not give them any advantage as they were on a flat electricity tariff which did not include the maximum demand charge. Charging the heavy industries both maximum demand and electricity consumption would deter them from ignoring such energy-wasteful habits. However, some energy-saving initiatives were observed during the survey, such as the use of variable speed drives (VSDs) for motor loads and incorporation of programmable load controllers on compressors.
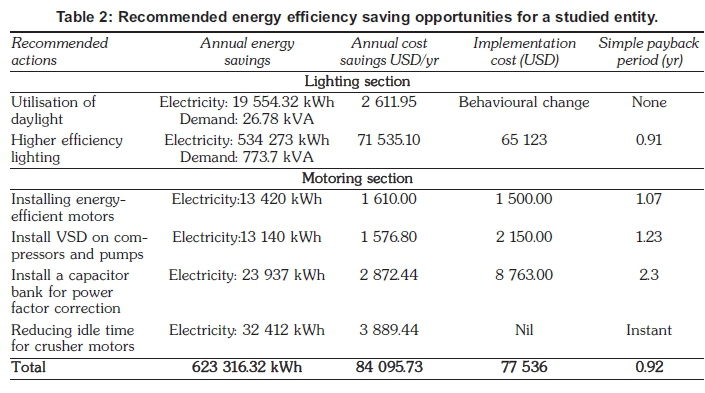
Table 2 shows a summary of results for one entity surveyed, indicating the energy-efficiency opportunities that were found, the associated savings, implementation costs, and payback periods. The energy-efficiency saving opportunities recommended represent a total value of approximately USD 84 000 per year, with implementation costs of about USD 77 000. This gives a simple payback period of 0.9 years.
The answered questionnaires and structured interviews revealed that the lack of financial resources in Zimbabwe has forced many industries to be careful when investing in EE technologies. In addition, senior managers generally think that the technologies currently available may become cheaper in the future and may not be able to satisfy future environmental and/or energy regulation standards. A good example was when ZERA funded the fluorescent tube lightbulb project, which encouraged all industries to use this technology. When the national energy audit was carried out, it was difficult to introduce a new lighting bulb technology, e.g. LEDs, to many industries, as they thought it was now a waste of money and the technology would keep on changing every year. It would be advisable to look at the technology cycles that industries require to change their technology in terms of EE. For example, the new technology can be adopted after it has paid itself for the investments made in the EE project, that is, after its payback period.
The main barrier for EE in the industry was identified as senior management concern over production disruption, investment cost, and the time required for EE projects. Lack of coordination among divisions within the company was also cited as a hindrance to adoption of EE technology. Middle-level management expressed the view that senior-level management is more concerned with production and/or sales of their company products than energy consumption, as the latter can represent less than 3% of the total expenses of the company. Therefore, the production and/or sales managers will have more influence on company decisions than the energy or maintenance managers. This lack of support or commitment from senior management in understanding the importance of EE was also identified as an important barrier.
EE technology in Zimbabwe is still very new, and the expertise and lack of personnel to analyse and implement EE projects was still a significant barrier to its adoption at the time of this research study. This was exacerbated by the lack of practical studies at institutions like the Zimbabwe Institute of Engineers to provide continuous professional development courses in this field, and also at universities or technical colleges. This has resulted in most industries not wanting to invest in such technologies without the acceptance of their engineers and proof that they are able to work with it. Middle-level management engineers indicated that they were comfortable working with the current installations since there was enough knowledge and confidence within the company about the existing facilities.
Change in working behaviour of operational-level staff was found to be one of the hardest ways of implementing EE. It was found that most such staff members were uncomfortable changing their usual working style to suit new proposed EE programmes. It is therefore recommended that management should find ways to encourage the operational-level staff by giving those who have significantly contributed to the EE goal additional incentive appraisals. It was also found that the current financial incentives for EE investments were not well communicated to the industry, and in some cases were not enough to encourage an industry to adopt EE technologies. In some cases, industries complained about the complicated procedures involved in the implementation of EE programmes and accessing the incentives offered by government and/or the energy regulator.
4. Policy recommendations
A number of crosscutting EE technologies, such as cogeneration, energy recovery techniques, and efficient drive system technologies, were identified as potentially capable of bringing substantial energy savings in all industries. More simply, however, a significant energy saving could be achieved by replacing old process equipment with new, more efficient process equipment. This was evident in many of the energy-intensive industries that were surveyed in this case study.
Adoption of EE programmes is dependent on government policies on EE. Figure 6 shows a proposed policy framework that would enhance the participation of different industries in EE programmes. The diagram shows the three main players identified: government, energy regulator, and research institutions, with arrows indicating the flow of data between them. There should be bidirectional communication between the three players. This would enhance the smoothness of implementation of any EE programme undertaken. The government should make the final regulations and standards that must be enforced by the regulator. These regulations and standards are developed or derived from research by research institutions like the Scientific and Industrial Research Development Corporation, University of Zimbabwe, etc. The regulations from research institutions are developed in consultation with the energy regulator, whose main role is to monitor, evaluate and disburse EE information to the electricity customers. The regulator will adopt different demonstration projects that are developed by the research institutions in order to show customers how to save electricity. In some cases, voluntary projects from different industries, especially intensive energy users, can be tailor-made for their industry.
The regulator should also be able to monitor the EE programmes that are adopted by the different industries, and in doing so provide data to the research institutions to develop incentive options for the participating electricity customers. Monitoring EE programmes is further important in revealing the challenges most industries face in adopting them. The challenges can be analysed by the research institutions, in order to develop alternative energy options, or to recommend currently available technologies. The regulator should also have the necessary skills to train electricity customers in EE programnes through seminars, industrial visits, etc. The regulator can provide coordinated marketing and education programmes. Education is an important aspect of EE, as it enhances the understanding of benefits of EE.
The EE programmes must not be restricted to utilities and public organisation but must be extended to cover private firms. In addition, different target groups within the industry - i.e. top senior management and operational-level staff - must be engaged differently. Thus, a blended EE policy that takes into account the different industry technologies and target groups is required. Blending these differences in policy design is essential, as it enable effective communication of the importance of EE and its benefits to consumers.
Benchmarking EE products is an essential tool to enhance EE. Building codes and appliance efficiency standards can be made mandatory. The regulator can also ensure that imported equipment complies with the appliance efficiency standards. The government, through its standards and regulatory arm, the Standard Association of Zimbabwe, will take responsibility for testing that imported equipment conforms to efficiency standards.
Monitoring and evaluation of EE programmes means that the regulator would be able to design a well-structured electricity tariff to suit the different electricity users, depending on their electricity usage and efficiency achieved. For example, for industries that use large industrial motors, a power factor penalty could be used as a deterrent, encouraging the use of efficient motors. In large commercial entities, a maximum demand charge and time-of-use electricity tariffs could be applied. As technology advances, automation and control of electricity price become easier, so that consumers could select and control effectively target loads that can be curtailed or shifted. The availability of smart meters would enable electricity consumers to see sufficient detailed and informative electricity prices that will motivate them to take action and change their electricity consumption behaviour. Well designed electricity tariffs that are dynamic and/ or time-varying are essential in changing consumer behaviour.
5. Conclusion
The study argued that the adoption of energy efficiency (EE) and a proposed policy framework could significantly improve Zimbabwe's economic growth, as indicated by the EE saving opportunities it discussed. The main EE barriers identified were: poorly structured electricity tariffs; risk of production disruption; resistance of operational staff to a change in working style; lack of coordination between company divisions; lack of information on EE programmes; and a lack of support from senior management on issues relating to EE. A policy framework was proposed in which the government, energy regulator and research institutions engage with each other to ensure effective bidirectional communication in solving problems facing industries when adopting EE technologies.
Future research needs to focus on collecting more energy-use data for other sectors and the potential energy savings that can be achieved in each sector. This would enable the development of a comprehensive EE policy framework for all sectors, thus increasing energy-saving in Zimbabwe. Tracking new EE technologies and detailed evaluation of its effect and cost-effectiveness would enable the development of a transparent EE policy framework that would reveal the costs and benefits of EE programmes, and thus lead to acceptance by electricity users.
Author roles
Oliver Dzobo: Conceptualised the study and formulated the primary research hypotheses, data collection, case study system design and simulations, analytical techniques, implementation models, write-up.
Henerica Tazvinga: Research formulation, implementation models, checked the results of the case study and reviewed the text.
Hermes Chido Chihobo: Research formulation, data collection, case study system design and simulations
Edward Chikuni: Conceptualised the study and formulated the primary research hypotheses, data collection, case study system design and simulations, analytical techniques, implementation models, write-up.
References
Abrahamse W., Steg L., Vlek C., and Rothengatter T. 2005. A review of intervention studies aimed at household energy conservation. Journal of Environmental Psychology, 25(3): 273-291. [ Links ]
African Development Bank. 2019a. African Economic Outlook 2019. Online at https://www.afdb.org/fileadmin/uploads/afdb/Documents/Publications/2019AEO/AEO_2019-EN.pdf. [ Links ]
African Development Bank. 2019b. Zimbabwe infrastructure report 2019. Online at http://www.afdb.org/en/countries/southernafrica/Zimbabwe/ [ Links ]
Amann, J., 2006. Valuation of non-energy benefits to determine cost-effectiveness of whole-house retrofit programmes, Rep. No.AO61. American Council for an Energy-Efficient Economy, ACEEE, Washington, DC. [ Links ]
Azimoh, C. L., Dzobo, O. and Mbohwa C. 2017. Investigation of net metering as a tool for increasing electricity access in developing countries, EPEC 2017, Toronto, Canada. [ Links ]
Berg, S.V. 2015 Energy efficiency in developing countries: Roles for sector regulators. Energy for Sustainable Development 29: 72-79. [ Links ]
Boyd, G.A. and Pang, J.X. 2000. Estimating the linkage between energy efficiency and productivity. Energy Policy 28: 289-296. [ Links ]
Cagno, E., Moschetta, D. and Trianni, A. 2019. Only non-energy benefits from the adoption of energy efficiency measures? A novel framework. Journal of Cleaner Production 212: 1319-1333. [ Links ]
Cagno, E., Worrell, E., Trianni A. and Pugliese, G. 2013. A novel approach for barriers to industrial energy efficiency. Renewable and Sustainable Energy Reviews 19: 290-308. [ Links ]
CIA World Factbook. 2019. https://www.indexmundi.com/zimbabwe/electricity_consumption.html, accessed on 17 July 2019 [ Links ]
Dzobo, O..and Sun, Y. 2019. Optimal power control strategy of a hybrid energy system considering demand response strategy and customer interruption cost. Recent Advances in Electrical & Electronic Engineering (Formerly Recent Patents on Electrical & Electronic Engineering) 12: 20-29. [ Links ]
Dzobo, O., Tazvinga, H., Mungofa, E., Chihobo, C. H., Chikuni, F. and Chikuni E. 2017. Energy audit: A case study to reduce lighting cost for an industrial site. European Alliance for Innovation (EAI): International Conference for Research, Innovation and Development for Africa (ACRID 2017), Victoria Falls, Zimbabwe. [ Links ]
Dzobo O. and Xia X. 2017. Optimal operation of smart multi-energy hub systems incorporating energy hub coordination and demand response strategy. Journal of Renewable and Sustainable Energy 9 (4): 045501. [ Links ]
Elliott, R.N., Gold, R. and Hayes, S. 2011. Avoiding a train wreck: Replacing old coal plants with energy efficiency. American Council for an Energy-Efficient Economy, Washington, DC. [ Links ]
Ernedal S. and Gombosuren E. 2011. On a path towards an energy efficiency policy framework - the case of Mongolia, ECEEE summer study proceedings - Panel 2: Current energy efficiency policies, 2011: 393-399. [ Links ]
Geller, H.S., Harrington, P., Arthur, H., Satoshi Tanishima, R. and Unander, F. 2006. Policies for increasing energy efficiency: Thirty years of experience in OECD countries. Energy Policy 34, 556-573. [ Links ]
Giacone, E. and Manco, S. 2012. Energy efficiency measurement in industrial processes. Energy 38: 331345. [ Links ]
Greening, L.A., Greene, D.L. and Difiglio, C. 2000. Energy efficiency and consumption - the rebound effect - a survey. Energy Policy 28: 389-401. [ Links ]
Hasanbeigi, A., Menke, C. and du Pont, P. 2010. Barriers to energy efficiency improvement and decision-making behavior in Thai industry. Energy Efficiency 3: 33-52. [ Links ]
International Energy Agency [IEA] (2017). World Energy Outlook, 2017. Online at https://webstore.iea.org/download/summary/196?fileName=English-WEO-2017-ES.pdf. [ Links ]
Laitner, J. A. 2013 An overview of the energy efficiency potential. Environmental Innovation and Societal Transitions 9: 38-42. [ Links ]
Legros, G., Havet, I., Bruce, N., Bonjour, S., Rijal, K., Takada, M. and Dora C. 2009. The energy access situation in developing countries. A review focusing on the least developed countries and sub-Saharan Africa. United Nations Development Programme. [ Links ]
Navidi, W. 2008. Statistics for engineers and scientists (Second edition). McGraw- Hill, New York, 2008. [ Links ]
Oikonomou, V., Becchis, F., Steg, L. and Russolillo, D. 2009. Energy saving and energy efficiency concepts for policy making. Energy Policy 37: 4787-4796. [ Links ]
Painuly, J.P., Park, H., Lee, M.K. and Noh, J. 2003. Promoting energy efficiency financing and ESCOs in developing countries: Mechanisms and barriers. Journal of Cleaner Production 11: 659-665. [ Links ]
Palm J. and Thollander P. 2010. An interdisciplinary perspective on industrial energy efficiency. Applied Energy 87: 3255-3261. [ Links ]
Patterson, M. G. 1996. What is energy efficiency? Concepts, indicators and methodological issues. Energy Policy 24(5): 377-390. [ Links ]
Rohdin, P. and Hollander, P. 2006. Barriers to and driving forces for energy efficiency in the non-energy intensive manufacturing industry in Sweden. Energy 31: 1836-1844. [ Links ]
Rosenow, J. and Bayer, E. 2017. Costs and benefits of energy efficiency obligations: A review of European programmes. Energy Policy 107: 53-62. [ Links ]
Sardianou, E. 2008 Barriers to industrial energy efficiency investments in Greece. Journal of Cleaner Production 16: 1416-1423. [ Links ]
Sarkar, A. and Singh, J. 2010. Financing energy efficiency in developing countries: Lessons learned and remaining challenges. Energy Policy 38: 5560-5571. [ Links ]
Saulo, M. J., Gaunt, C.T. and Dzobo, O. 2010. Comparative assessment of short term electricity distribution planning with long term vision oriented planning, 3rd IASTED African Conference on Power and Energy Systems Africa PES2010 (2010a), 6-8 September 2010, Botswana University, Gaborone, Botswana. [ Links ]
Saulo, M. J. Gaunt, C.T. and Dzobo O. 2010. The impact of vision driven planning approach on electricity distribution system planning in Kenya. Universities Power Engineering Conference (UPEC), 2010 45th International, 2010b, Cardiff, Wales. [ Links ]
Schleich, J. amd Gruber E. 2008. Beyond case studies: Barriers to energy efficiency in commerce and the service sector. Energy Economics 30: 449-464. [ Links ]
Setlhaolo D. and Xia X. 2014. Optimal scheduling of household appliances incorporating appliance coordination. Energy Procedia 61: 198-202. [ Links ]
Sichilalu, S., Tazvinga, H. and Xia, X., 2016. Optimal control of a fuel cell/wind/PV/grid hybrid system with thermal heat pump load. Solar Energy 135: 59-69. [ Links ]
Tanaka, K. 2008. Assessment of energy efficiency performance measures in industry and their application for policy. Energy Policy 36: 2887-2902. [ Links ]
Varone, F. and Aebischer, B. 2001. Energy efficiency: The challenges of policy design. Energy Policy 29: 615-629. [ Links ]
Wei, Y., Liao, H. and Fan, Y. 2007. An empirical analysis of energy efficiency in China's iron and steel sector. Energy 32: 2262-2270. [ Links ]
Worrell, E., Bernstein, L., Roy, J., Price, L. and Harnisch J. 2009. Industrial energy efficiency and climate change mitigation. Energy Efficiency 2: 109-123. [ Links ]
Zhou, N., Levine, M.D. and Price, L. 2010. Overview of current energy-efficiency policies in China. Energy Policy 38: 6439-6452. [ Links ]
Zimbabwe, Ministry of Energy and Power Development, MEPD (2011) National Energy Policy Implementation Strategy. [ Links ]
* Corresponding author: Cnr Kingsway Road & University Road, Auckland Park, 2006, Johannesburg, South Africa: email: odzobo@yahoo.com; tel: +27 11 559 4010

