


Services on Demand
Article
 English (pdf)
 Article in xml format
 Article references
Indicators

Related links
-
 Cited by Google
 -
 Similars in Google
Share

 Permalink
Journal of Energy in Southern Africa
On-line version ISSN 2413-3051
Print version ISSN 1021-447X
J. energy South. Afr. vol.31 n.1 Cape Town Feb. 2020
http://dx.doi.org/10.17159/2413-3051/2020/v31i1a7571
ARTICLES
Effects of current mismatch due to uneven soiling on the performance of multi-crystalline silicon module strings
M. VumbugwaI, *; J.L. Crozier McClelandI; E.E. van DykI; F.J. VorsterI; T.J. SeramengII
IDepartment of Physics, Nelson Mandela University, Post Office Box 77000, Summerstrand, Port Elizabeth, 6031, South Africa. ORCiDs: M. Vumbugwa: http://orcid.org/0000-0002-5436-3152; J.L. Crozier McCleland: http://orcid.org/0000-0002-0468-6893; E.E. van Dyk: http://orcid.org/0000-0001-7596-0223; F.J. Vorster: http://orcid.org/0000-0002-1854-4642
IIEskom, Research Testing and Development, Private Bag X40175, Cleveland, 2022, South Africa.ORCiDs: T.J. Serameng: http://orcid.org/0000-0002-8580-1688
ABSTRACT
Photovoltaic (PV) module operation is critical in PV systems for optimum generation of electrical power. Modules installed in the field suffer uneven soiling caused by bird droppings and dust build-up on their front surface. This study investigated the impact of partial shading caused by non-uniform soiling on the electrical characteristics of multi-crystalline silicon (mc-Si) modules and strings, and compared this with simulated I-V parameters. Light and heavy uneven soiling on mc-Si solar cells resulted in current mismatch which can be simulated. The effects of partial soiling on the I-V characteristics of mc-Si module strings were experimentally measured and agreed with the simulated results.
Keywords: non-uniform shading; modelling; thermal infrared imaging; I-V characteristics
1. Introduction
Solar photovoltaics (PV) is expanding rapidly and is destined to be a cheap and widely used global energy source (Breyer et al., 2017), due to the international drive for clean power production (Wara et al., 2015). Therefore, operation and maintenance of PV systems become a crucial and valuable activity to meet energy efficiency and for PV modules to operate for the expected period. A PV module, which consists of series-connected solar cells, is a key component in PV systems as it is where generation of electrical power occurs. It is meant to last for more than 20 years. When installed, however, PV modules are exposed to real field conditions, which can affect normal operation of the modules, reduce their efficiency and accelerate module degradation (Meyer and van Dyk, 2004; Ferrara and Philipp, 2012). Soiling refers to the building up of contaminants on the surface of PV modules, including dust, snow, bird droppings and other forms of particulate matter. Modules in the field are prone to dust and bird droppings just like any outdoor surface, so it is practically impossible to avoid the contaminants. Birds commonly find warmth and ideal nesting areas in roof-mounted PV installations, resulting in localised soiling (depending on the location of the system). The modules are installed at an optimum inclination angle to absorb maximum solar irradiance, but this inclination angle may contribute to the retention of wind-blown dust (Mani et al., 2016). Dust builds up on the bottom frame of the module and bird droppings cause uneven soiling on solar cells, which results in either light shading (s) or heavy shading (S) on the cells. Uneven soiling partially shades solar irradiation and causes non-uniform illumination on the cells, leading to current mismatch in series-connected cells and substrings (Kõntges et al., 2014).
Cell mismatch occurs when a shaded (or defective) cell in a substring underperforms and generates less current than the other cells in the substring. This forces the cell to operate in reverse bias, dissipating excess substring power as heat, thus limiting the substring's generated current and, in turn, creating current mismatch with other substrings operating normally (Crozier et al., 2015). The simulation program PVSim (King et al., 1996) can be used to model current mismatch in substrings of multi-crystalline silicon (mc-Si) modules. It is used to model and analyse the performance of PV module strings and arrays, including bypass diodes, using a two-diode equivalent circuit. The cell-to-cell statistical variance, defined by the user, is applied to the fundamental parameters used to simulate the cells. The bypass diodes' characteristics are also defined in the same manner, allowing configuration of PV modules, strings and arrays in the software, as well as enabling modelling of cell mismatch of PV modules. In general, the current mismatch in PV modules has a significant impact on the I-V curves. It alters the shape of the I-V curve (Vorster and van Dyk, 2005), indicating the effect on output power of the PV module and string.
Current mismatch in solar cells causes a non-uniform temperature distribution in the affected module and such an anomaly can be identified as a hotspot in thermal infrared (TIR) imaging. A significant temperature difference (AT) of 5 °C or more between an anomaly (faulty cell or interconnect) and a reference cell in the same module indicates a thermal signature, which has the potential to reduce the performance of the module. Elevated temperature of singular spots or cells having a significant AT of 5 °C or more between an anomaly and reference cell temperature highlights irregularities that have a substantial effect on the performance, reliability and longevity of PV module strings. The abnormal continual heating of areas where hot spots occur can be circumvented by incorporation of bypass diodes in mc-Si modules (Kõntges et al., 2014). The TIR imaging is a contactless technique that can be applied on operating PV modules. The ideal conditions for capturing thermal images are clear sky, low air mass (<1.5) and minimum irradi-ance of 650 W/m2, and the angle of the TIR camera should be almost perpendicular to the module surface under inspection to avoid reflections (FLIR Systems, 2011).
The electrical performance of a PV module or string is given by its I-V characteristics, and any deviation from the expected I-V parameters reveals a problem with the PV source. For comparison and analysis, I-V measurements captured from the PV plant are corrected to standard test conditions (STCs). The STC for testing solar PV modules is an irradiance of 1000 W/m2, a temperature of 25 °C and air mass of 1.5 (Solmetric Corporation, 2018). The power at any point along the I-V plot characteristic of a PV module or string is a product of current and voltage. The maximum power point (MPP) is located around the 'knee' of the I-V curve. The MPP is given by the product of maximum power voltage (Vmp) and maximum power current (Imp). If the MPP is shifted, it affects the fill factor (FF) of a PV module or string. The FF is also an important performance indicator in PV systems. It is the ratio of maximum power to the product of open circuit voltage (Voc), short circuit current (Isc) and typical FF values for mc-Si cells are in the range 0.75-0.85 (Smets et al., 2016). The present study discusses the impact of current mismatch on performance of mc-Si PV modules, so as to understand the effect of the thermal signatures caused by light (s) and heavy (S) partial shading on the string electrical characteristics, together with linking the string parameters to the simulated I-V curves of mismatched strings.
2. Experimental procedure
The work involved modelling current mismatch of module substrings in PVSim, taking I-V measurements and TIR images of mc-Si strings soiled under controlled and real field conditions, and comparing with simulations.
2.1 Simulation of current mismatch
The PVSim was used to model mismatched sub-strings of a mc-Si module with sixty solar cells in three substrings. It was assumed that a string of fourteen modules contains one underperforming module (M01). The substrings of M01 and the string (other thirteen modules in the string) were assumed to produce the short-circuit currents indicated in Table 1; and I-V parameters of the reference and Simulations 1 and 2 were generated in PVSim. Simulation 1 represented a scenario when the substrings were lightly shaded, while Simulation 2 was for heavily shaded solar cells. The current generated by a heavily shaded substring is less than that produced by a lightly shaded substring.
2.2 Controlled soiling experiment
A controlled soiling experiment was carried out at the Outdoor Research Facility (ORF) at Nelson Mandela University, Eastern Cape, South Africa (34.00852S, 25.66522E). The experiment was conducted to observe the effect of current mismatch, due to soiling of substrings in a module, on the string I-V characteristic. The string at the ORF consisted of fourteen mc-Si PV modules connected in series, which were ground-mounted and north-facing. The PV modules were manufactured by Solar World, with each module containing sixty cells connected in three substrings and having a maximum power rating of 230 W. Each substring had a bypass diode in parallel over it.
In Scenario 1, soft dough was applied on one cell in the module to represent bird-droppings. Dough was used to partially shade one cell in module 2, creating light shading and I-V parameters of module 2 and the string of fourteen mc-Si modules were measured. The dough was then thickly applied to create heavy shading on one cell of module 2, covering almost the same area as for light shading. The I-V measurements of module 2 and the string were taken with the cell under heavy shading using an I-V curve tracer.
In Scenario 2, the bottom row of cells of module 3 were unevenly shaded with dry flour, to represent dust accumulation, on the lowermost parts of the inclined PV modules, near the bottom frame. The flour was evenly applied, partially shading five cells at the bottom row of module 3, and more flour was put on the sixth cell at the bottom row of the module. The I-V measurements of the string were taken with module 3 shaded, and reference I-V parameters of the string were measured when modules 2 and 3 were unshaded.
Thermal images of the shaded modules in all the scenarios were taken using a TIR camera. The I-V measurements and TIR images were taken under cloudless sky conditions with irradiance above 650 W/m2, low air mass and avoiding thermal reflections during TIR imaging.
2.3 Soiled mc-Si modules under real operating conditions
The TIR imaging on operating module strings was carried out at Eskom Research and Innovation Centre (ERIC) PV plant, Rosherville, Johannesburg, South Africa (26.2321°S, 28.11382E). The strings consisted of fourteen series-connected 300 W mc-Si PV modules manufactured by Astronergy, which were seventy-two cell modules. Hot cells having AT of > 5 °C were located on thermal images. Visual inspection was carried out and uneven soiling corresponding to the hot cells was the only optical impediment observed. The I-V characteristics of the strings-containing modules with hot cells were measured as recommended (Solmetric Corporation, 2018), using a Solmetric Photovoltaic Analyzer, model PVA-1000S-30. The reference I-V parameters were obtained from measuring a normal operating string next to the soiled strings. The modules were labelled according to their position on the plant's site map, e.g., area 600, inverter 2, string 4, module 2 (A600-Inv2-ST4-M02), which made it easier to locate, inspect and test the strings. The measured I-V values were corrected to STC and correlated to the thermal images obtained to understand the impact of the thermal signatures caused by partial soiling on mc-Si string performance and to compare with the simulated I-V curves. Quantification of uncertainty is an obligation for measurements, therefore the root-sum-of-squares method for standard uncertainties and the International Guidelines of Uncertainty in Measurement (Joint Committee For Guides In Metrology, 2008), were used for calculating the percentage uncertainties because of field measurements and STC translations.
3. Results and discussion
3.1 Simulated current mismatch in mc-Si Modules
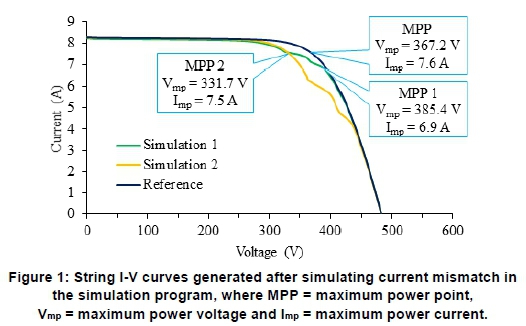
The I-V characteristics obtained when the mismatch scenarios in Section 2.1 were modelled in PVSim are shown in Figure 1. The I-V curves of Simulations 1 and 2 were similar and showed steps because of current mismatch. The I-V curve of Simulation 2 showed deep steps caused by the increase in current mismatch. Steps in I-V curves of mc-Si modules reflected active bypass diodes (Vorster and van Dyk, 2005), therefore Simulation 2 indicated that if current mismatch increases (high mismatch) then the bypass diode conducts at a lower current than at low mismatch. The effect of current mismatch on MPP was revealed by the shift of the MPP. The MMP shifted to the right towards Voc (MPP 1) when the current mismatch was low and moved to the left (MPP 2) along the curve towards Isc for high mismatch, i.e., when comparing to the expected MPP of the reference I-V curve.
3.2 Performance of a mc-Si string under controlled soiling
Figure 2(a) shows thermal and optical images taken when Scenario 1 with light shading was applied on one cell of module 2 at ORF, as described in Section 2.2. The partially shaded cell exhibited an abnormal temperature of 47.7 °C because of non-uniform illumination on the cell treated with dough. The uneven shading caused the cells in the substring to mismatch, forcing the shaded cell to operate in reverse bias (Crozier et al., 2015). The partially soiled cell wasted some of the substring's generated electrical power and caused the substring's output current to be less than that of the substrings operating normally. This caused the shaded cell to operate at 9.9 °C higher than the untreated cells because of heat dissipation, and also caused a bypass diode parallel to the affected substring to conduct, resulting in the module's I-V curve (light shading) having a step, as shown in Figure 2(c). Heavy shading conditions were stimulated by adding more flour to the same area. This led to the shaded cell operating at 47.9 °C and the affected substring contributing less current because of the increased current mismatch. This is reflected by the module's I-V curve of heavy shading in Figure 2(b). The I-V curves of the module in Figure 2 (c) are similar to the string I-V curves in Figure 2(d), indicating that the impact of uneven soiling on a cell of the module (light and heavy shading) cascaded to the string's output. The localised hot spotting on the cell string was detrimental, as it changed the substring's short circuit current, ΔI, with the change in shading. The AI indicated in Figure 2(d) shows that, under heavy shading, the bypass diode across the affected substring conducts at a lower current than for light shading and bypasses the un-derperforming substring, thus minimising the hot spotting impact and the string power loss.
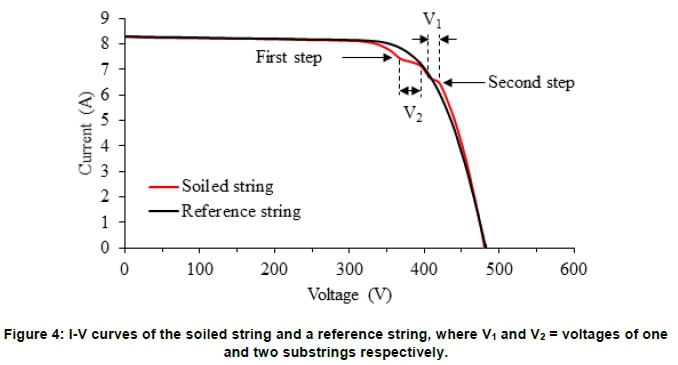
Thermal and optical images from Scenario 2 (Figure 3) were captured after uneven soiling with dry flour on cells at the bottom row of module 3. The hot cell shown in the thermal image in Figure 3(a) indicates that the abnormal heating of 48.1 °C of the cell was attributable to uneven soiling. The effect on the string performance is revealed by the I-V curve in Figure 4, which has two steps and is similar to the I-V curve of Simulation 1 in Figure 1.

The two steps were caused by current mismatch produced by the non-uniform soiling on module 3. The I-V curve showed that V1 gave the voltage of the most affected substring with a hot cell, while V2 equalled to the voltage of the other two substrings in the soiled module. The voltage of the soiled module Vm can therefore be approximated to Equation 1.

The I-V curve of the affected string indicated that the relationship between V2 and V1 could be given by Equation 2, where the position of the step is affected by the number of active bypass diodes.

The step shifted to the left as the number of conducting bypass diodes increased. Many conducting bypass diodes meant that many (N) substrings were soiled, while if the number of active bypass diodes was small, few (n) substrings would be shaded. This was reflected by the first step caused by two active bypass diodes (across two substrings) of the soiled module and was more to the left than the second step that was caused by one active bypass diode paralleled to the most affected substring.
3.3 Performance of mc-Si string soiled under real operating conditions
Figure 5(a) shows a thermal image of a mc-Si module contained in string A600-Inv16-ST04, with an abnormally hot cell at 47.8 °C, i.e., 11.1 °C higher than the normal operating cells. This was the only module in this string that was observed to have thermal irregularities. Its optical image, shown in Figure 5(b), shows a bird-dropping being the only optical impediment corresponding to the hot cell.

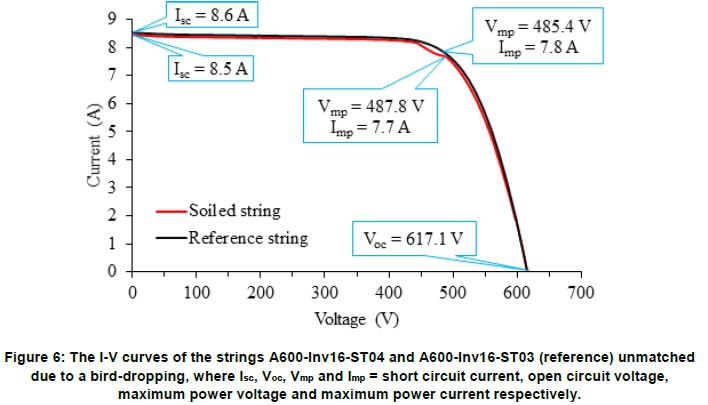
Figure 6 shows the I-V curve of the soiled string, A600-Inv16-ST04, compared with a reference string, A600-Inv16-ST03. A step in the I-V curve is similar to that in Figure 2, obtained after shading one cell of a module and indicates a bypass diode that was forced into forward bias by the mismatch effect of the partially shaded cell.
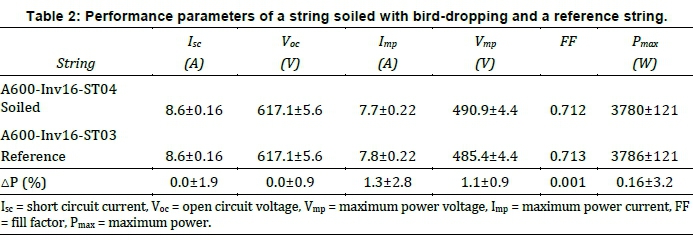
The bypass diode of the soiled module minimised the string power loss by conducting the generated current and bypassing the affected substring. The result was a reduction in FF and a power loss of approximately 6 W (0.16%), presented in Table 2.
Considering that each module produced approximately 270 W, each cell in the module of 72 cells produced 3.7 W on average, which was less than the string power loss of 6 W. This shows that the substring containing the soiled cell had been bypassed when the string current was higher than (mismatched) the substring's generated current; and without bypass diode protection, the power loss and hot spot damage might be severe.
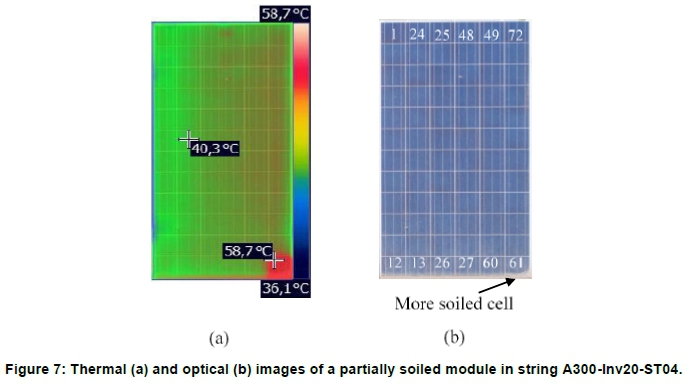
One module in string A300-Inv20-ST04 was observed to have hot areas shown by the module's thermal image in Figure 7(a). The abnormally hot parts of the cells correspond to partially soiled areas on the module's optical image in Figure 7(b). There was build-up of dust along the bottom module frame that resulted in uneven shading on cells 12, 13, 26, 27, 60 and 61. No other optical impediment was observed when visual inspection was carried out. Five cells (12, 13, 26, 27 and 60) seemed to be partially hot and cell 61 had more sediments that caused it to be abnormally hot at 58.7 °C, resulting in it having a temperature difference of 18.4 °C with the reference temperature of 40.3 °C.
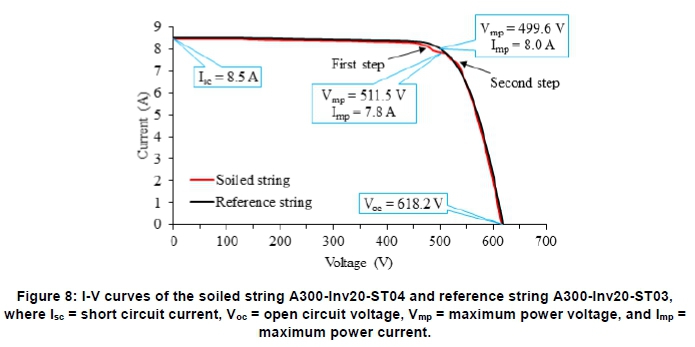
The I-V curve of the entire string A300-Inv20-ST04 is affected by the uneven soiling of the module, as seen in Figure 8.
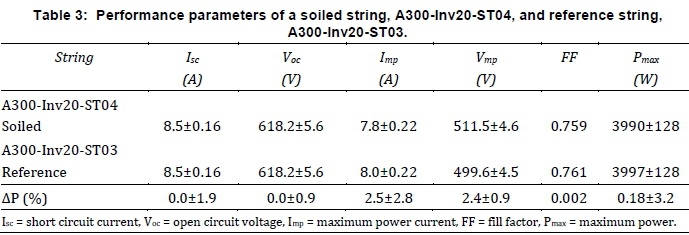
The I-V curve of the soiled string A300-Inv20-ST04 is similar to the I-V curves generated in PVSim in Figure 1. It shows two clear steps at about 500 V and 540 V and deviates from the expected I-V curve of the adjacent string A300-Inv20-ST03. This indicates that bypass diodes were conducting current as a result of uneven shading in substrings of the soiled module, causing the string to underperform by 7 W, translating to a small drop in FF and 0.18% decrease in performance as shown in Table 3.
The I-V parameters of the affected module were not measured. However, based on the shape and position of the steps in the string's I-V curve, it can be inferred that the substrings containing the partially shaded cells 12, 13, 26, 27, 60 and 61 suffered current mismatch. Current mismatch attributable to partial shading on solar cells and the effect of bypass diodes on power loss is discussed in Section 1 and is explained in detail by Vorster and van Dyk (2005) and Crozier et al. (2015). The I-V curve of the string A300-Inv20-ST04 show voltage drops of approximately 30 V on first step and 15 V on second step, which points to the possibility that two substrings of the soiled module were affected at first step and one substring affected at second step. The decrease in current at each step imply that the affected substrings experienced different levels of shading, one lightly shaded (first step) and one heavily shaded (second step). The two lightly shaded substrings (first step) and the single more heavily shaded substring (second step) are observable in the thermal image Figure 7. The partial soiling seems to be uniform across the cells 12, 13, 26, 27, and 60, but there is more soiling on cell 61, causing the substring with cell 61 to generate less current (second step) than the other two substrings (first step). The partial soiling on the module is causing the module to generate less current than the expected 8.5 A. This is also similar to Scenario 2 in the controlled experiment carried out at ORF when cells at the bottom row of module 3 were soiled. The I-V curves in Figures 8 and 4 show this similar shape but have different Voc, since the modules at ORF have sixty cells while those at ERIC have seventy-two cells.
The power loss due to soiling in the strings A300-Inv20-ST04 and A600-Inv16-ST04 is statistically insignificant when considering the percentage uncertainty of 3.2% in Tables 1 and 2. It proves, however, the effectiveness of bypass diodes in the mc-Si PV modules. The activated bypass diode minimises the power loss of the entire string and lessens the detrimental effect of hot spotting, but continual conduction of huge current generated by the string can overheat and damage the diode by 'shorting' or 'opening' it. 'Open' failing of a bypass diode can leave the corresponding underperforming substring vulnerable to a destructive hot spotting, while if it were 'shorted' a significant power loss of the module string would be experienced (Kõntges et al., 2014). The abnormally heated bypass diode can be revealed by a hot junction box on thermography inspection. The partially soiled solar cell heats up since it is generating less current than the good cells in the substring, so it is forced into reverse bias and consumes the substring's generated electrical energy as heat. Additionally, not all the solar radiation received by the soiled cell is converted to electrical power; some is wasted as heat. This results in the cell temperature being extraordinarily high, and may cause other secondary effects such as delamination, module glass cracks and burns if the cells are shaded for long. The secondary defects are irreversible even after cleaning the module. Therefore, routine cleaning of the modules should be carried out to avoid such abnormalities, a further drop in string efficiency and fast deterioration of the modules.
This study shows that when mc-Si solar cells are under uneven soiling, two variables and four possibilities exist. The two variables are 1) heavy (S) or light soiling (s); and 2) number of affected cells/substrings (many (N) and few (n)). The variables result in having four combinations SN, Sn, sN and sn, with each combination causing a different effect on the I-V curve. Light and heavy soiling result in shallow and deep steps (kinks) respectively and, if more cells are soiled/shaded, the step in the I-V curve would appear more towards lower voltage with a big drop in voltage. The step will be closer to Voc along the curve if few cells are shaded.
Current mismatch causes steps in I-V curves of mc-Si modules and strings to show activation of bypass diodes as revealed by the I-V characteristics obtained at ORF and ERIC. The general shape of the I-V curves of soiled string A300-Inv20-ST04 matches to the string soiled with flour at ORF (Figure 4) and the I-V parameters modelled in PVSim in Figure 1. Mismatched substrings force the maximum operating point, MPP, to shift along the I-V curve towards Isc on light shading, and towards Voc when shading is heavy and subsequently reducing the FF and the generated power, thus affecting performance of the string. The position and shape of the step relates to how heavy the shading is (deepness of steps) and the number of conducting bypass diodes (step shifting towards Isc as number of active diodes increase). The I-V curve of a soiled mc-Si module or string can be modelled using the simulation program PVSim when the soiling pattern on the module is known. Modelled electrical characteristics of current mismatch in a module or string agree with the I-V curves of the mismatched modules under real field conditions.
Minimal power loss (less than 1.0%) was realised on the soiled strings since the soiling covered a small area and bypass diodes in the modules minimised the impact of shading on the string's generated power. This shows the importance of bypass diodes in series-connected PV modules. It is beneficial to properly clean the modules periodically as it avoids soiling power loss, minimises rate of module degradation and avoids secondary irreversible defects such as bypass diode failure, module glass cracks, delamination, burns and damage of bypass diodes that result if the cells are partially soiled for long period of time.
4. Conclusions
The study investigated the effects of uneven soiling on performance of multi-crystalline silicon modules to understand the impact of the mismatched substrings and thermal signatures on output electrical characteristics of PV module strings. The I-V parameters obtained after modelling substrings current mismatch in the program PVSim were linked to the observations made in a controlled experiment at Outdoor Research Facility at Nelson Mandela University and electrical characteristics of multi-crystalline silicon strings at Eskom Research and Innovation Centre, soiled under real operating conditions. The soiling combinations that can occur in real PV plant situations can be modelled with simulators and observations agreeing.
Acknowledgements
The authors thank the National Research Foundation for financial support.
Author roles
References
Breyer, C., Bogdanov, D., Gulagi1, A., Aghahosseini, A., Barbosa, L.S.N.S., Koskinen, O., Barasa, M., Caldera, U., Afanasyeva, S., Child, M., Farfan, J. and Vainikka, P. 2017. On the role of solar photovoltaics in global energy transition scenarios. Progress in Photovoltaics: Research and Applications 25(8): 727-745. [ Links ]
Crozier, J. L., van Dyk, E. E. and Vorster, F. J. 2015. Identification and characterisation of performance limiting defects and cell mismatch in photovoltaic modules. Journal of Energy in Southern Africa 26(3): 19-26. [ Links ]
Ferrara, C. and Philipp, D. 2012. Why do PV modules fail? Energy Procedia 15: 379-387. [ Links ]
FLIR Systems. 2011. Thermal imaging guidebook for building and renewable energy applications. Available at: http://www.flirmedia.com/MMC/THG/Brochures/T820325/T820325_en.pdf. [Accessed: 07 September 2018]. [ Links ]
Joint Committee for Guides in Metrology. 2008. Evaluation of measurement data: Guide to the expression of uncertainty in measurement. International Organization for Standardization, Geneva [ Links ]
King, D. L., Dudley, J. K. and Boyson, W. E. 1996. PVSIM©: A simulation program for photovoltaic cells, modules, and arrays. 25th IEEE Photovoltaic Specialists Conference Proceedings. Washington, DC, USA. 1295-1297. [ Links ]
Kõntges, M., Kurtz, S., Packard, C.E., Jahn, U., Berger, K., Kato, K., Friesen, T., Liu, H. and Van Iseghem, M. 2014. Review of failures of photovoltaic modules. IEA-Photovoltaic Power Systems Programme. IEA-PVPS. [ Links ]
Mani, F., Pulipaka, S. and Kumar, R. 2016. Characterization of power losses of a soiled PV panel in Shekhawati region of India. Solar Energy 131: 96-106. [ Links ]
Meyer, E. L. and van Dyk, E. E. 2004. Assessing the reliability and degradation of photovoltaic module performance parameters. IEEE 53(1): 83-92. [ Links ]
Smets, A., Jãger, K., Isabella, O., Swaaij van, R., and Zeman, M. 2016. Solar energy: The physics and engineering of photovoltaic conversion technologies and systems, first edition. Cambridge, England: UIT. [ Links ]
Solmetric Corporation. 2018. Solmetric PV Analyzer I-V Curve Tracer with SolSensor TM user's guide. Available at: http://www.solmetric.net/get/Solmetric_PV_Analyzer_Users_Guide_1500_en.pdf [Accessed: 2 February 2019]. [ Links ]
Vorster, F. J. and van Dyk, E. E. 2005. Current-voltage characteristics of high-concentration, photovoltaic arrays. Progress in Photovoltaics: Research and Applications 13(1): 55-66. [ Links ]
Wara, M., Cullenward, D. and Teitelbaum, R. 2015. Peak electricity and the clean power plan. Electricity Journal 28(4): 18-27. [ Links ]
* Corresponding author: +27793134739. email: s218207115@mandela.ac.za

