


Services on Demand
Article
 English (pdf)
 Article in xml format
 Article references
Indicators

Related links
-
 Cited by Google
 -
 Similars in Google
Share

 Permalink
Journal of Energy in Southern Africa
On-line version ISSN 2413-3051
Print version ISSN 1021-447X
J. energy South. Afr. vol.31 n.1 Cape Town Feb. 2020
http://dx.doi.org/10.17159/2413-3051/2020/v31i1a7670
ARTICLES
Revisiting electric utilities' efficiency in the Southern African Power Pool, 1998-2009
F.J. Ramos RealI; B. TovarII, *
IInstitute of Social Studies and Tourism, Department of Economics, Accounting and Finance. University of La Laguna. Campus de Guajara, Camino de la Hornera, 37, 38200, Spain ORCiD: https://orcid.org/0000-0001-6730-1084
IITourism and Transport Research Unit, Institute of Tourism and Sustainable Economic Development, Department of Applied Economics, Las Palmas University. Campus Universitario de Tafira, Módulo D, Las Palmas de Gran Canaria, 35017, Spain. ORCiD: https://orcid.org/0000-0002-3444-7842
ABSTRACT
This study analyses the determinants of the technical efficiency performance for Southern African Power Pool (SAPP) power utilities in the period 1998-2009, excluding South Africa's Eskom. The study formulated an explicit model for technical inefficiency by considering the vertical structure of the utilities and the definition of the product, considering the specific characteristics of this sample. It was found that the most significant improvement in the average efficiency of the sample occurred from 2000 to 2002, coinciding with the first SAPP Energy Plan of2001. Density in consumption, control of corruption and load factor also contributed to the different levels of efficiency. The results provided a new empirical evidence that can be useful for the design of energy policy and incentive regulation.
HIGHLIGHTS:
• Significant improvement in the average efficiency of SAPP firms
• A bad specification could lead to incorrect energy policy implications
• Density and load factor contribute to explain efficiency levels
• Institutional aspects represent a promising line of study
Keywords: technical inefficiency; vertical structure; density in consumption, control of corruption, load factor
1. Introduction
The countries of sub-Saharan Africa have generally been behind other regions of the world in terms of power sector infrastructure and performance. They have low rates of electrification, considering that less than 30% of the population has access to electricity, compared with about 65% in South Asia and more than 90% in East Asia [1]. Moreover, the average consumption of electricity per capita is just 124 kWh if South Africa is excluded; by contrast, the annual average consumption per capita in the developing world is 1 155 kWh and 10 198 kWh [1]. Most African countries have small, isolated economies and, in order to promote economic integration enabling industries to benefit from economies of scale, the development of physical infrastructure is necessary. Further, deficient power infrastructure and operational inefficiency of electric utilities hinder economic growth through their negative effect on the productivity of utilities. Infrastructure accounts for 30-60% of the effect of investment on productivity in most countries of Sub-Saharan Africa. In half of the countries, the power sector accounted for 40-80 % of this effect [2]. Lawrence Musab, Coordination Centre Manager of the Southern African Power Pool (SAPP), in a 2016 interview in ESI Africa [3], emphasised that one of the main objectives of the association is the implementation of energy efficiency in the African power industry.
One of the priorities of African policy makers is the funding of investments to link up the continent's power grid. The strategy has focused on the creation of different regional power pools [4]. This work highlights the expected benefits from power pools, which include reduction of capital and operating costs through coordination among utilities, optimisation of generation resources, improved power system reliability with reserve sharing, enhanced security of supply, improved investment climate through pooling risks, coordination of generation and transmission expansion, increase in inter-country electricity exchanges, and the development of regional markets for electricity.
Currently, there are five power pools in Africa in various stages of development [5]. The SAPP is the most advanced in terms of power trade, with 28 bilateral contracts already signed among the member countries and with an active role played by the short-term electricity market since 2001 and by the day-ahead market since 2009 [5]. Institutional setup and market rules and regulations have been already implemented, but there are other factors influencing the poor performance of electric utilities in Africa. It has been argued that sub-Saharan African reforms have largely targeted the easiest part of the problem: addition of new capacity, rather than the transmission and distribution sides of the electricity industry [6]. Future reform measures should therefore primarily address the challenges that still face transmission and distribution in the region. Most electric utilities in sub-Saharan Africa experienced significant technical and commercial losses [7]. Inefficient operation has an adverse effect on investment and less-efficient utilities also have difficulty in meeting demand for power [7]. Thus, there is increasing evidence that governance reform of state-owned utilities can improve their performance.
Performance analysis has emerged as a powerful tool to assess the structure of the electricity and network industries and to help utilities and regulators to analyse the productivity and efficiency determinants. Although there have been several studies concerning these issues in the electricity industry, relatively little work has been conducted on the efficiency of electricity in African countries, as shown by [8] and [9]. Research showed that only two works have estimated the performance of SAPP utilities [10, 11]. The first of these [10] analysed the efficiency levels and the evolution of total factor productivity of 12 electricity operators of the SAPP using data envelopment analysis (DEA) techniques, for 1998-2005. In this first attempt of measuring the power pool performance, relatively low levels of efficiency were found, especially in single output models. Depending on the output definition, average technical efficiency (TE) under variable returns of scale (VRS) varied between 69% and 74% in 1998 and between 67% and 78% in 2005. When two outputs were considered, the average TE under VRS was 88% in 1998 and 87% in 2005. It was concluded that no significant improvements had been observed on technical efficiency and no catching up effect was found. However, technological opportunities had been better utilised over the period considered in the analysis, which showed technological improvements.
The other study [11] investigated the convergence pattern of TE of the SAPP utilities during 2003-2010, by means of several convergence approaches. To feed those convergence models, TEs were estimated through parametric and non-parametric techniques. On average, DEA-TE varied between 66% under constant returns of scale and 75% under VRS, whereas stochastic frontier analysis (SFA) TE was 71%. It was, therefore, found that average efficiency level scores occurred close to those found by the first study [10] for single output models. These average TE levels were again relatively low, and it is possible to reduce equi-propor-tionately all inputs by 34%-25% (depending on the model), keeping output constant. Regarding the TE convergence levels, it was concluded that, taken as a whole, TE diverged among the utilities operating in the power pool.
In this context, the present study revisited the electric utilities' efficiency in the SAPP with three main goals. The first was to analyse how the efficiency results could be affected by a bad specification of the model in relation with the output definition and with the sample selection. This fact could induce incorrect energy policy implications. The second goal is to assess the technical efficiency levels and its evolution for the SAPP utilities in 1998-2009. Finally, the study identified the main variables that contribute to explain technical inefficiency by focusing on technical, economic and institutional factors.
2. Methodology
Taking into account the results of the pioneering works in the sector that are summarised in [12], certain classic drivers of efficiency were analysed, such as load factor or density in consumption [13, 14] while other less-frequent factors such as transmission losses [15] and corruption were also considered. The utilities' technical efficiency in the period 1998-2009 was evaluated following [16] within a fixed effect model (FEM) framework [17, 18]. This methodology has been applied in some empirical papers [including 19, 20, 21]. The model consists of two equations: the first allows an estimation of the inefficiency level of firms by characterising the technology (frontier); the second contains a set of explanatory variables associated with a utility's technical inefficiency. The variables of the second equation are also called contextual variables [22, 23], which, in the present study, are treated as inefficiency determinants that could be under the control of utilities or not. The model was estimated by using a panel data [24] instead of a pool within a FEM by introducing specific firm dummy variables to capture unobservable heterogeneity. Thus, the estimated coefficients will not be biased if there is heterogeneity among utilities, because it is explicitly considered in the model.
A distance function was used instead of a production function, as it has certain advantages. Distance functions describe a multi-input, multi-output production technology without making behavioural assumptions such as cost minimisation or profit maximisation. This is especially suitable for regulated industries. In fact, it has been used to measure efficiency and/or productivity changes in electricity utilities [13, 14, 15] and in other regulated infrastructure services: among others this includes: gas distribution [21], railways [25], airports [26], ports [27]. Moreover, another advantage of distance functions is that input and output prices are not necessary. This study followed an input-oriented approach to represent the behaviour of companies to meet an exogenous demand [28, 29], as it best represented the electricity public service provision.
The input distance function characterises the production technology by considering the maximum proportional contraction of the input vector for a given output vector. The empirical estimation of a parametric distance function requires the definition of an appropriate functional form that should be flexible, easy to calculate, and must allow for the imposition of the homogeneity condition. The translogarithmic functional form meets these conditions.
Two equations for the model were derived. Equation 1 represented stochastic translogarithmic input distance function:
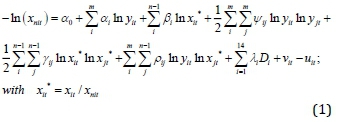
where y is a vector of m outputs; x is a vector of n inputs; i relates to the istfirm; a, β, ψ, y, p, and λ are the coefficients to be estimated; Di is a dummy variable for the distribution company i to capture un-observable heterogeneity; Vitis a symmetrical error term, i.e.; N+ ~ (δzip,σu2), has a zero average that represents the random variables that cannot be controlled by the firm; and uit is a one-sided negative error term, i.i.d. N ~ (0,σv2), that measures the technical inefficiency that is distributed independently of Vit. The Vit therefore becomes a random term, while uit represents inefficiency. Equation 2 allows the modelling of the effects of technical inefficiency, uit, as a function of the utility-specific variables (contextual variables) which are considered to be potential drivers of electricity distributor's efficiency.
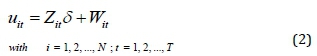
where Zit is a vector of firm-specific variables, and 5 the parameter vector to be estimated. The error term in Equation 2, Wit, is a random variable obtained from the truncation of a normal distribution, where (- zit δ) is the point of truncation. The system formed by the two equations was estimated by maximum likelihood.
2.1 Background
It was first necessary to determine a proper sample to study technical efficiency, which required the exclusion of one of the utilities. Secondly, several variables that allow a proper study of the vertical structure of the utilities was proposed. Finally, some variables that allow to study the sources of inefficiency in details were determined.
There are primarily five power pools in Africa: the Central Africa Power Pool (CAPP); the Comité Maghrébin de l'Electricité (COMELEC); the Eastern Africa Power Pool (EAPP); SAPP; and the West Africa Power Pool (WAPP). A 2011 report about regional power status in African Power Pools [5] showed that electricity traded was less than 1% for CAPP and for EAPP and approximately 7% for
COMELEC, SAPP and WAPP. The same report indicated that institutional set up and market rules and regulations had already been implemented in the SAPP, were being implemented in the WAPP, and were under design in EAPP. However, CAPP and COMELEC have still to develop their power market institutions and rules. About half of the countries now have an independent electricity regulator.
The SAPP was created by the Southern African Development Community (SADC) in 1995. The SADC includes 12 countries on the mainland African region, namely: Angola, Botswana, the Democratic Republic of Congo (DRC), Lesotho, Madagascar, Malawi, Mozambique, Namibia, South Africa, Swaziland, Tanzania, Zambia and Zimbabwe. The SAPP coordinates the planning and operation of the electric power system among member utilities and provide a forum for regional solutions to electric problems. Power consumption by SAPP member countries was estimated at 260 081 GWh. South Africa represented 84% of total consumption, Zambia 4% and Zimbabwe 3% and the other countries a total of about 1%. The SAPP installed capacity reached 56 000 MW in 2010, with South Africa representing 82.5% of the capacity available. Coal represented the greatest part of the generation mix with 39 666 MW (73%), followed by hydropower with 9 474 MW (17%), distillate with 2 639 MW (5%), nuclear with 1 930 MW (4%), and natural gas with 646 MW (1%).
Exports from South Africa reached 13 754 GWh and imports 10 047 GWh in 2010. The country is, by far, the greatest exporter of electricity, followed by DRC with 871 GWh. Botswana and Mozambique import nearly all their consumption, while Namibia imports 67% (2 462 GWh). This implied that the region was dominated by the state-owned utility of South Africa, Eskom. While most countries relied on hydro sources, a significant role of Eskom as a supplier implied that the main source of energy for many of the smaller countries was thermal. Net imports within the SAPP represented 7% of total generation and the day-ahead market was already active. However, the development of the regional trade is constrained by transmission congestion within the transit countries (Zimbabwe and Mozambique) and at interconnection level (Zimbabwe-Zambia-Botswana-Namibia).
This study considered a data set of a balanced panel of 11 national utilities belonging to SAPP for a 12-year period (1998-2009): Botswana Power Corporation (BPC), Electricidade de Mocambique (EDM), Angola's Empresa Nacional de Electricid-ade, Electricity Supply Commission of Malawi, Lesotho Electricity Corporation, Namibia's NamPower; Swaziland Electricity Board, the DRC's Société Na-tionale d'Electricité (SNEL); Tanzania Electric Supply Company (TANESCO); Zimbabwe Electricity Supply Authority, and Zambia Electricity Supply Corporation.
Eskom was excluded from the sample for several reasons. Firstly, inclusion would gave unrealistic results and associated convergence difficulties, likely caused by large differences in scale between values of Eskom and other utilities in the pool; e.g., sales and generation figures for Eskom in 2009 were respectively 448 and 808 times those of the smallest utility, and more than 22 times the second biggest. These differences were larger in terms of customers: almost eight times the second biggest in the pool and 1 294 times the smallest. The dominance of Eskom in SAPP generation could not be considered as a homogeneous observation, but an outlier. The second reason was that 'in SFA, outliers may distort the estimation curvature and also increase the magnitude of the idiosyncratic error term, thus influencing average efficiency estimates in the sample' [30]. The exclusion of Eskom, therefore, allowed sensible results.
2.2 Data and variables
The variables in Equation 1 are those associated with the technological frontier (mainly the output and the input). Contextual variables in Equation 2 are the ones that might influence the levels of efficiency. Regarding the technological frontier, the vertical structure of the utility is important in defining inputs and outputs [31]. For example, the estimated degree of economies of scale and that of vertical integration decrease slightly when there is an increase in the degree of detail in how production is described. Therefore, the manner in which the production process is seen when analysing data has an impact on the policy conclusions.
All the utilities considered are vertically integrated, i.e., they generate and distribute electricity to final consumers. Therefore, given the multi-stage characteristic of electric utilities, one output for each stage is considered: generation (GWh) and customers (number of customers). Figure 1 explains the production process where generation is used either to feed an own market or to deliver to other electricity distribution firms through the network. On the second stage, the distribution process is independent of the origin of electricity. Thus, a firm distributes all the energy that is obtained independently of its origin.
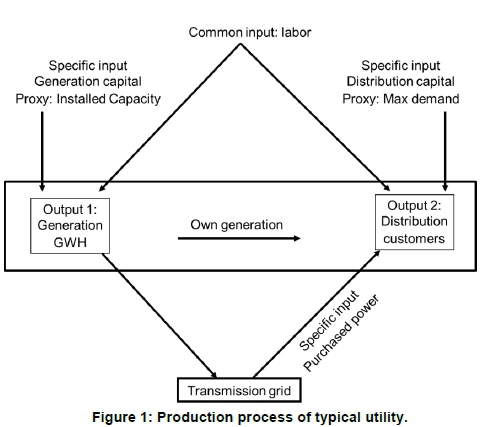
Two main inputs involved in electricity generation and distribution were considered: capital and labour, measured by physical units. Labour is common to generation and distribution and measured as number of workers. One measurement was, however, considered for capital and the other for distribution, taking into account the different levels of vertical integration and the characteristics of each firm. Installed capacity (MW) was used as a proxy for capital in the generation stage. As [8] points out, this is a common practice in literature [32, 33, 34]. There was, however, no similar variable for the distribution stage, so maximum demand (MW) was used as a proxy for capital in this stage. This variable is associated with the size of networks and the transformation capacity. Finally, purchased power was not included as an input in the model [35, 36, 37, 33]. Thus, both the operating and maintenance activities of generation and distribution stages were considered, regardless of whether the electricity was own-generated or not. This is because considering it or not does not affect the analysis of the production process of distributing electricity. When speaking about costs, what is considered are the technical, maintenance and others costs of electricity circulation that are not affected by purchase management. When considering cost functions, this is a way to avoid double accounting of generation costs [34, 33]. Two complete analyses of the variables that represent major cost drivers in electricity industry have been offered in the literature [8, 32].
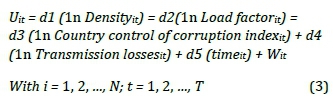
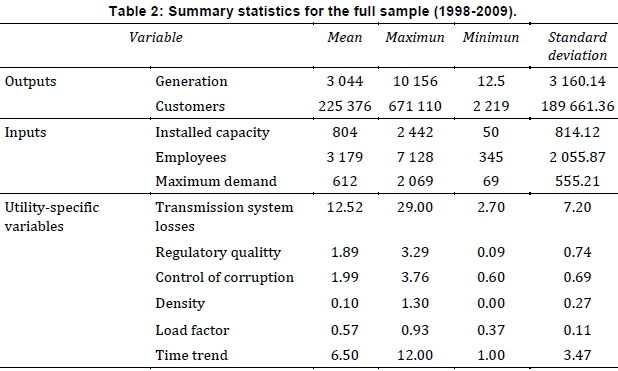
Table 1 presents a summary of the main characteristics of the current structure of the utilities. Those in the sample have similar sizes, the largest of which was about 2.5 times bigger than the average for the variables measuring the product (Table 1, rows 3-5). This meant that companies were comparable. On the other hand, all were vertically integrated, but in different degree (Table 1, last row); i.e., some were more specialised in the product of one phase, some in that of the other. This provided an adequate variability for estimation. Additionally, a set of possible contextual variables was included to explain efficiency. These were the components of uit in Equation 2, which allowed modelling the effects of technical inefficiency as a function of the utility-specific variables considered, which may influence efficiency. Different models were tested and the best one included: time trend and natural log of density; load factor; country control of corruption index; and transmission losses.
Consumption per capita was considered to account for certain territorial characteristics of utilities. This variable was named as density in consumption, reflecting the spread of demand among the connection points that were regarded as major efficiency driver. The maintenance cost per customer was lower in higher density networks. It was therefore expected that a higher customer density would lead to a more efficient situation. On the other hand, the load factor was measured by dividing sales by maximum demand. It was also ex-pectedthat a greater utilisation of installed capacity would contribute positively to efficiency.
Finally, two contextual variables that might be important in the context of sub-Saharan Africa were added: transmission losses and control of corruption. Transmission losses take into account that infrastructure problems affect not only generation capacity but also transmission networks. It is assumed that, if the networks are congested, major transmission losses would occur. For corruption, the corruption index constructed by the Worldwide Governance Indicators project was used. This is one of the aggregate indicators of six broad dimensions of governance (voice and accountability, political stability and absence of violence/terrorism, government effectiveness, regulatory quality, rule of law, control of corruption? constructed by the Worldwide Governance Indicators project. The six aggregate indicators are based on 30 underlying data sources reporting the perceptions of governance of a large number of survey respondents and expert assessments worldwide. Details on the underlying data and indicators can be found in [38]. These indicators reflect perceptions of the extent to which public power is exercised for private gain, including both petty and grand forms of corruption, as well as 'capture' of the state by elites and private interests. It was expected that higher country corruption control levels lead to higher efficiency. Table 2 shows the descriptive statistics.
3. Results and discussion
3.1. Empirical results and hypothesis tests
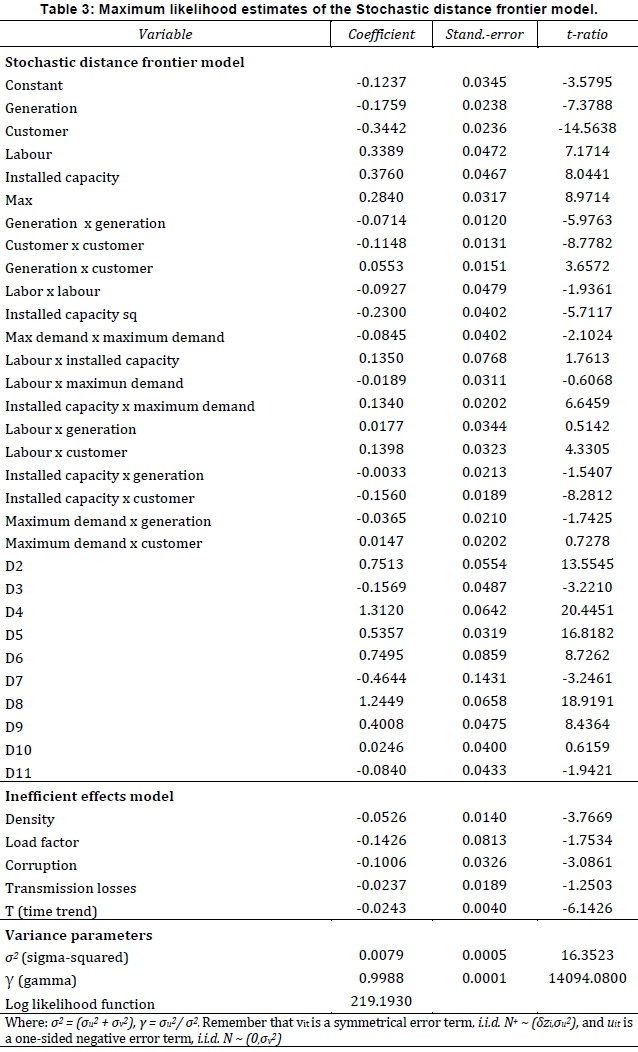
Table 3 shows the estimated maximum likelihood parameters of the distance function and the inefficiency effect model. It shows that all the first order parameters were statistically significant and had the correct sign. Thus, the estimated distance function complied with all the expected theoretical properties. The conditions of regularity were satisfied at the sample mean, implying that the input-oriented distance function was non-decreasing and concave with respect to inputs and non-increasing and quasi-concave in outputs.
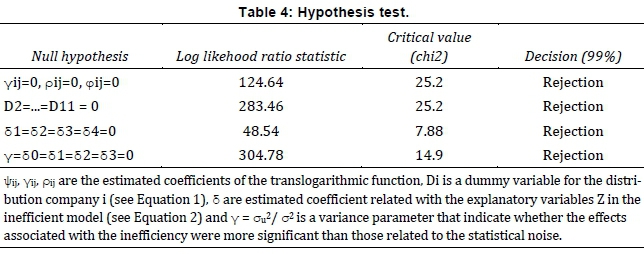
The variables were calculated from deviations in their geometric averages, therefore the first order coefficients (see from second to fifth rows in Table 3) are the estimations of the elasticities in the sample mean. Moreover, the variance parameters, sigma-squared and gamma, were statistically significant at a 5% level and the estimated value of parameter gamma was 0.9987. This showed that the effects associated with the inefficiency were more significant than those related to the statistical noise. Hypotheses tests were applied regarding the restrictions placed on the functional form of the distance function to justify the methodology adopted. The results of these tests are given in Table 4.
All tests were performed with respect to the unrestricted translog model [39, 40]. The first step was to test whether a Cobb-Douglas specification was an adequate representation of the technology and, as Table 4 shows, the null hypothesis was rejected (see first row). Secondly, it was tested whether the utility dummy, which captures the specific effect, was zero. Again, the null hypothesis was rejected (see second row in Table 4).
The remaining tests are concerned with the specification of the effects of inefficiency. Firstly, the hypothesis of the non-existence of technical efficiency in the error term was tested and rejected (see third row in Table 4). Finally, the null hypothesis that the variables included in the inefficiency effect model have no effect on the level of technical inefficiency was tested and rejected (see last row in Table 4). This meant that the explanatory variables included (as a whole) affected utilities' efficiency (even though when taken individually some might not be significant).
The results of the inefficient model imply that the variables explain the level of inefficiency. A negative parameter means that inefficiency decreases when the value of the variable increases. The coefficients associated with density, load factor and country corruption index variables indicated that a higher density, a higher load factor and an improvement in the country corruption index contribute to reduce inefficiency. Moreover, the coefficient linked to time trend showed that electric utilities' efficiency improved during the analysed period. Density in consumption, country corruption index and time trend were statistically significant at usual levels (95%). Meanwhile, load factor was statistically significant at 90%. On the other hand, the transmission losses parameter showed a positive sign but was not significant. In spite of this, these were not removed from the model because of the result of the tests on the joint significance of the determinants of inefficiency (see Table 2). The null hypothesis, that the variables included in the inefficiency model have no effect on technical inefficiency, was rejected. This fact indicates that the included explanatory variables jointly influence utility efficiency even though, when taken individually, some may not be significant (see Table 4).
3.2 The efficiency evolution
The technical efficiency of each utility by period was assessed by means of the distance function parameters. The results obtained from the average levels of efficiency for the sample as a whole showed that, from 1998 to 2009, the analysed utilities operated at 91.91% of efficiency, i.e., they might have increased by 8.09% their outputs with the same amount of inputs. The average technical efficiency score by utility during the period is shown in Figure 2.
The most efficient utilities were, in order, Nam-power, BPC and ZEP (Figure 2). These values confirmed that the results were sensible because these firms were the ones that have the three highest densities and highest control corruption indices (Table 1). The least efficient utilities were TANESCO (least efficient), then EDM, then SNEL, which also had almost the lowest densities and lowest control corruption indices. The load factor control rates in Table 1 were positively correlated with levels of efficiency. This last result and that of customer's density are very common in the literature [36, 37, 33].
Figures 2 and 3, considering together, show that those countries with higher levels of efficiency correlated with those with higher electricity consumption per capita.
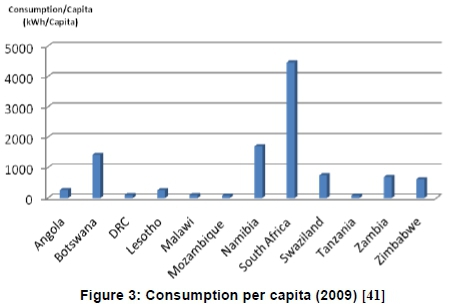
Figure 4 shows the temporal average annual technical efficiency evolution of all utilities analysed. The technical efficiency levels show an ascending evolution, increasing from 86.6% in 1998 to highest level of 94.4% in 2009. Comparison between these results and those from previous studies [10, 11] shows two major differences. First, in the earlier studies, the average technical efficiency is significantly lower. The closest value corresponds to the multi-output model in [10] where a TE under VRS of 88% in 1998 and 87% in 2005 was found.
Other results [11] presented great variability among companies with very low values, as it is the case of EDM, which varied around 0.25 in the SFA model. Secondly, although the analysed periods were not the same, the other two works showed some stagnation in the TE evolution. A significant improvement in the average efficiency of the sample was, however, recorded. This improvement was more pronounced from 2000 to 2002, coinciding with the first SAPP Energy Plan of 2001.
3.3 Policy implications
This paper analyses the factors that determine the TE performance of the SAPP firms in the period 1998-2009. Results could be useful for the design of energy policy by providing new empirical evidence. The vertical structure of the utilities and the definition of the product, taking into account the specific characteristics of this sample, were considered. The homogeneity of sample companies is a key factor to calculate the efficiency when using frontier techniques. The exclusion of Eskom from the sample is critical in this regard.
Although the existence of the SAPP seems to confirm an improvement in the TE of firms, there remain some outstanding issues to be analysed in depth as future fields of analysis. The first relates to which variables could be considered in the model to take into account the congestion of transmission networks. Investments in this phase of the provision of electricity are very important to break bottlenecks, as noted in the introduction above. The second issue requires focusing on institutional aspects, such as controlling corruption, and represents a promising line of study. Finally, it is necessary to dispose of a full and detailed database to perform this type of study about efficiency and productivity in the electricity industry in Africa. As other authors have stated [42]: 'One of the regulator's tasks should be to help obtain relevant information from adequate sources for the performance of these types of studies'. One way to do that is that the obligation to submit such information could be placed with regulated firms. From our point of view, commissions or working groups of SAPP members should be encouraged. These commissions should specialise in obtaining and homogenize information of the different stages: transmission, generation, distribution, commercialization... etc. This information by country should be treated centrally to identify common elements of action to seek the efficiency of the sector as a whole.
4. Conclusions
The contribution of this study is twofold. From the theoretical perspective, it was shown that a bad specification in relation with the output definition and with the sample selection could induce incorrect energy policy implications. From the empirical perspective, the study identified the main variables that contribute to reduced technical inefficiency by focusing on technical, economic and institutional factors. These technical and institutional factors provide a rich basis for future research and development to encourage efficiency of electric utilities.
Acknowledgements
The authors are grateful to two anonymous reviewers for helpful suggestions, comments and discussions.
Author roles
F.J. Ramos-Real: Hatched the theoretical model, checked the results of the case study and reviewed the text. B. Tovar: Did the data collection, ran the simulations, produced results of the case study, and wrote the text.
References
[1] Africa's Power Infrastructure. Investment, integration, efficiency, 2011. World Bank. https://openknowledge.worldbank.org/handle/10986/2290 [accessed April 2018]. [ Links ]
[2] Escribano, A. Guasch, J.L. and Pena, J. 2010. Assessing the impact of infrastructure quality on firm productivity in Africa: cross-country comparisons based on investment climate surveys from 1999 to 2005. World Bank Policy Research Working Paper 5191. [ Links ]
[3] Exclusive interview with Dr Lawrence Musaba, Coordination Centre Manager of the Southern African Power Pool. 2016 (1), ESI-Africa.com. https://www.esi-africa.com/features-analysis/exclusive-interview-with-dr-law-rence-musaba-coordination-centre-manager-of-the-southern-african-power-pool/ [accessed April 2018]. [ Links ]
[4] Sebitosi, A.B. and Okou, R. 2010. Re-thinking the power transmission model for sub-Saharan Africa. Energy Policy, 38, 1448-1454. doi.org/10.1016/j.enpol.2009.11.025. [ Links ]
[5] Regional Power Status in African Power Pools. Report. Infrastructure consortium for Africa, 2011. African Development Bank. BP 323-1002 Tunis Belvédère, TUNISIA. https://www.icafrica.org/fileadmin/docu-ments/Knowledge/Energy/ICA_RegionalPowerPools_Report.pdf. [ Links ]
[6] Karekezi, S. and Kimani, J. 2002. Status of power sector reform in Africa: impact on the poor. Energy Policy, 30, 923-945. doi.org/10.1016/S0301-4215(02)00048-4. [ Links ]
[7] Eberhard, A. and Shkaratan, M. 2012. Powering Africa: Meeting the financing and reform challenges. Energy Policy, 42, 9-18. https://doi.org/10.1016/j.enpol.2011.10.033. [ Links ]
[8] Jamasb, T., Newbery, D., and Pollitt, M. 2004. Core indicators for determinant and performance of electricity sector in developing countries. Cambridge Working Paper in Economics, CWPE 0438. [ Links ]
[9] Leme, R.C., Paiva, A.P., Steele Santos, P.E., Balestrassi, P.P. and Lima Galvão, L. 2014. Design of experiments applied to environmental variables analysis in electricity utilities efficiency: The Brazilian case. Energy Economics, 45, 111-119. doi.org/10.1016/j.eneco.2014.06.017. [ Links ]
[10] Estache, A., Tovar, B. and Trujillo, L. 2008. How efficient are African electricity companies? Evidence from the southern African countries. Energy Policy, 36, 1969-1979. doi.org/10.1016/j.enpol.2008.02.011. [ Links ]
[11] Jaunky, V.C. 2013. Divergence in technical efficiency of electric utilities: Evidence from the SAPP. Energy Policy, 62, 419-430. doi.org/10.1016/j.enpol.2013.07.113. [ Links ]
[12] Jamasb, T., Mota, R., Newbery, D. and Pollitt M. 2005. Electricity sector reform in developing countries: A survey of empirical evidence on determinants and performance, World Bank Policy Research Working Paper 3549, World Bank, March, Washington, DC. http://documents.worldbank.org/curated/en/393231468780575236/Electricity-sector-reform-in-developing-countries-a-survey-of-empirical-evidence-on-determinants-and-performance. [ Links ]
[13] Perez-Reyes Espejo, R. and Tovar, B. 2010. Explaining the inefficiency in electrical distribution companies: the case of Peruvian firms. Energy Economics, 32, 1175-1181. doi.org/10.1016/j.eneco.2010.02.002. [ Links ]
[14] Ramos-Real, F., Tovar, B., Iootty. M., Fagundes de Almeida, E.L. and Queiroz Pinto H. 2009. The evolution and main determinants of productivity in Brazilian electricity distribution 1998-2005: an empirical analysis. Energy Economics, 31, 298-305. doi:10.1016/j.eneco.2008.11.002. [ Links ]
[15] Tovar, B., Ramos-Real, F., Fagundes de Almeida, E.L. 2011. Firm size and productivity. Evidence from the electricity distribution industry in Brazil, Energy Policy, 39, 826-833. doi:10.1016/j.enpol.2010.11.001. [ Links ]
[16] Battese, G.E. and Coelli, T.J., 1995. A model for technical inefficiency effects in a stochastic frontier production for panel data. Empirical Economics, 20, 325-33. [ Links ]
[17] Greene, W. 2005a. Fixed and random effects in stochastic frontier models. Journal of Productivity Analysis, 23, 732. doi.org/10.1007/s11123-004-8545-1. [ Links ]
[18] Greene, W. 2005b. Reconsidering heterogeneity in panel data estimator of the stochastic frontier model, Journal of Econometrics, 126, 269-303. doi.org/10.1016/j.jeconom.2004.05.003. [ Links ]
[19] Tovar, B. and Rendeiro Martin-Cejas, R. 2009. Are outsourcing and non-aeronautical revenue important drivers of Spanish airports efficiency? Journal of air Transport Management, 5, 217-220. doi:10.1016/j.jairtra-man.2008.09.009. [ Links ]
[20] Chang, V. and Tovar, B. 2014. Drivers explaining the inefficiency of Peruvian and Chilean ports terminals, Transportation Research Part E. Logistics and Transportation Reviews, 67, 190-203. dx.doi.org/10.1016/j.tre.2014.04.011. [ Links ]
[21] Tovar, B, Ramos-Real, F.J. and Fagundes de Almeida, E. L. 2015. Efficiency and performance in gas distribution. evidence from Brazil. Applied Economics Incorporating Applied. Financial Economics, 47, 5390-5406. doi.org/10.1080/00036846.2015.1047093. [ Links ]
[22] Banker, R.D. and Natarajan, R. 2008. Evaluating contextual variables affecting productivity using data envelopment analysis. Operations Research, 56, 48-58. doi.org/10.1287/opre.1070.0460. [ Links ]
[23] Kuosmanen, T. 2012. Stochastic semi-nonparametric frontier estimation of electricity distribution networks: Application of the stoned method in the Finnish regulatory model. Energy Economics, 34, 2189-2199. doi:10.1016/j.eneco.2012.03.005. [ Links ]
[24] Rodriguez-Álvarez, A. and Tovar, B. 2012. Have Spanish port sector reforms during the last two decades been successful? A cost frontier approach. Transport Policy, 24, 73-82. dx.doi.org/10.1016/j.tranpol.2012.06.004. [ Links ]
[25] Coelli, T. and Perelman, S. 2000. Technical efficiency of European railways: a distance function approach. Applied Economics, 32, 1967-1976. doi:10.1080/00036840050155896. [ Links ]
[26] Tovar, B. and Rendeiro Martin-Cejas, R. 2010. Technical efficiency and productivity changes for Spanish airport: a parametric distance functions approach Transport Research Part E. Logistics and Transportation Reviews, 46, 249-260. doi:10.1016/j.tre.2009.08.007. [ Links ]
[27] Rodriguez-Alvarez, A., Tovar, B. and Trujillo, L. 2007. Firm and time varying technical and allocative efficiency: An application for port cargo handling firms. International Journal of Production Economics, 109, 149-161. doi:10.1016/j.ijpe.2006.12.048. [ Links ]
[28] Thanassoulis, E., 2002. Comparative performance measurement in regulation: The case of English and Welsh sewerage services. Journal of the Operational Research Society, 53, 292-302. DOI: 10.1057/pal-grave.jors.2601160. [ Links ]
[29] Pombo, C., and Taborda, R. 2006. Performance and efficiency in Colombia's power distribution system: effects of the 1994 reforms. Energy Economics, 28, 339-369. doi.org/10.1016/j.eneco.2005.08.001. [ Links ]
[30] Bogetof, P. and Otto, L. 2011. Benchmarking with DEA, SFA and R. International Series in Operations Research & Management Science. Springer-Verlag. New York. [ Links ]
[31] Jara-Diaz, S. and Ramos-Real F.J. 2011. The effect of output specification on the optimal policy design for electric utilities. Journal of Regulatory Economics, 40, 62-81. DOI: 10.1007/s11149-011-9148-1. [ Links ]
[32] Ramos-Real, F. J. 2005. Costs functions and the electric utility industry. A contribution to the debate on deregulation. Energy Policy, 33, 69-87. doi.org/10.1016/S0301-4215(03)00200-3. [ Links ]
[33] Jara-Diaz, S, Martinez-Budria, E and Ramos-Real F.J. 2004. Economies of integration in the Spanish electricity industry using a multistage cost function. Energy Economics, 26 995-1013. doi.org/10.1016/j.eneco.2004.05.001. [ Links ]
[34] Martinez-Budria, E., Jara-Diaz S. and Ramos-Real F.J. 2003. Adapting productivity theory to the quadratic cost function: an application to the Spanish electric sector. Journal of Productivity Analysis, 20, 203-229. [ Links ]
[35] Gilsdorf, K., 1994. Vertical integration efficiencies and electric utilities: a cost complementarity perspective. Quarterly Review of Economics and Finance, 34, 261- 282. doi.org/10.1016/1062-9769(94)90027-2. [ Links ]
[36] Gilsdorf, K., 1995. Testing for subadditivity of vertically integrated electric utilities. Southern Economic Journal, 62, 126-138. [ Links ]
[37] Kwoka, J.E., 2002. Vertical economies in electric power: evidence on integration and its alternatives. International Journal of Industria! Organization, 20, 653-671. doi: 10.1016/S0167-7187(00)00114-4. [ Links ]
[38] Kaufmann, D. Kraay, A. and Mastruzzi, M. 2010. The worldwide governance indicators: A summary of methodology, data and analytical issues. World Bank Policy Research Working Paper 5430. http://papers.ssrn.com/sol3/papers.cfm?abstract_id=1682130. [ Links ]
[39] Kumbhakar, S. and Knox Lovell, C. A. 2003. Stochastic frontier analysis. Cambridge University Press. USA. [ Links ]
[40] Coelli, T. Prasada Rao, D., O'Donnell, C. and Battese, G. 2005. An introduction to efficiency and productivity analysis. Springer Science & Business Media, USA. [ Links ]
[41] SAPP Utility General Information, 2010 Statistics. http://www.sapp.co.zw. [ Links ]
[42] Tovar, B. Jara-Díaz, S. and Trujillo, L. 2003. Cost and production functions in port sector: a literature review. World Bank Working Paper 3123. World Bank. [ Links ]
* Corresponding author: Tel: 0034615348515. email: beatriz.tovar@ulpgc.es

