


Services on Demand
Article
 English (pdf)
 Article in xml format
 Article references
Indicators

Related links
-
 Cited by Google
 -
 Similars in Google
Share

 Permalink
Journal of Energy in Southern Africa
On-line version ISSN 2413-3051
Print version ISSN 1021-447X
J. energy South. Afr. vol.30 n.4 Cape Town Nov. 2019
http://dx.doi.org/10.17159/2413-3051/2019/v30i4a2486
Recloser based energy exposure assessment of a distribution network
R. ThomasI; S. van ZylII; R.M. NaidooI; R. C. BansalIII, *; N.T. MbunguI; M. BipathIV
IDepartment of Electrical, Electronic and Computer Engineering, University of Pretoria, Pretoria, South Africa. R. Thomas: https://orcid.org/0000-0003-4658-6724; R.M. Naidoo: https://orcid.org/0000-0002-2439-4505; N.T. Mbungu: https://orcid.org/0000-0003-0498-5065;
IIEskom Technology Group, Pretoria, South Africa. V.Z. Stuart: https://orcid.org/0000-0001-9167-063X;
IIIDepartment of Electrical Engineering, University of Sharjah, Sharjah, United Arab Emirates
IVSANEDI: Smart Grids, Johannesburg, South Africa. M.Bipath: https://orcid.org/0000-0003-0408-6924
ABSTRACT
The optimised placement of reclosers on a distribution network is known to improve the reliability of a power system. Furthermore, the protection settings on distribution systems rely heavily on the number and placement of such reclosers. This study examined the effect of using protection settings methodology with the placement of reclosers to ameliorate the damage sustained during faults on a distribution network. The aim of the study was to determine whether this 'damage control factor' should be a future consideration for recloser placement. It has been found that the determination of the number and placement of reclosers, which are the function of the energy exposure of feeder, helped to optimise the operation and reliability of a distribution network. This could benefit both energy users and energy suppliers, who often face different challenges during the fault levels on the network.
Highlights
• Assesses energy exposure to avoid damage to the system during a given fault conditions.
• Develops the effect of using protection settings methodology with the number and replacement placement of reclosers.
• Alleviate damage sustained during faults into an electrical distribution network.
• Assesses an optimal relationship between the number and replacement of reclosers in the network and the energy exposure of the feeder.
Keywords: damage factor, electricity grid, fault condition, protection settings
1. Introduction
From the generation of electricity to the consumer side, protection-setting is a major factor in the design of any electrical network. Thus, the primary concern of selecting a protection device is based on the rating line current, fault detection, isolation and restoration, and short-circuit/overcurrent protection [1-3]. These can be seen in all electrical grids, either standard or smart, as well as in distributed generation [4-9]. The protection of all equipment throughout the power system must be considered and, besides, renewable energy integration should be included [10, 11]. It is, however, the accuracy of selecting the protection devices that will result in sustainability of protection against harm to the electrical network. The art of selecting protection devices is, therefore, a principal task for the electrical designer, based on the complexity of supplying the different types of loads and the mixing of power generations. This is also a function of ensuring reliability, flexibility and electricity quality in the distribution network.
An automatic circuit recloser is a self-controlled device for carrying and automatically interrupting and reclosing an alternating current circuit [3]. It has a predetermined sequence of opening and re-closing, followed by a lockout operation [12]. In this report, the term 'recloser' has been substituted for 'automatic circuit recloser' for simplicity. A recloser has non-directional over-current, earth-fault and sensitive ground-fault protection. Reclosers are frequently used in preference to fuses because fuses blow to isolate transient and permanent faults and need to be replaced manually to restore supply. Re-closers reset the network automatically if the failure is transient and only require manual restoration for permanent faults [13]. In fault diagnosis and control, the recloser plays an important role in ensuring power system reliability [14, 15] to select the quick switch for total power supply [16] and to guarantee the protection performance of a distributed generator system [16, 17]. The developed protection strategy considers using reclosers as an opportunity to improve the system reliability indices and to reduce the network losses [18]. Sun et al. [19] proposed a data-driven strategy that could predict fault events so that a rapid recloser can be performed on the system. The method uses an underlying fault-attribute relationship to guarantee a distributed potential fault event on the transmission line. The developed framework establishes an important measurement structure that can observe all faults caused by the system and the rarely occurring environmental elements. Through the light of the different relative weights, the environmental element impacts are determined by the reliability of the entire system.
The designed approach, therefore, aims to assess and predict the individual effects that can affect the safety of the system. The effectiveness of the proposed model is tested through an empirical study. Slabbert et al. [2 0] described the Joule energy that a conductor is exposed to, i.e., let-through energy exposure, during a fault on the feeder. This approach consists of creating a model that can determine the constraints of the conductor to avoid damage so that high voltage feeders can be protected. Le et al. [21] developed a case study on smart distribution networks that consists of detecting, locating and isolating faults on the electrical system. Through the proposed strategy, service restoration, self-healing and fault indicator are added to increase the reliability and performance of distribution networks. The impact of the number and the position of reclosers on the investment cost, customer interruption costs and the system average interruption duration index (SAIDI) were also discussed [22-31]. An increase in the number of reclos-ers minimises the customer outage costs and improves the network SAIDI [25, 26]. This is achieved by isolating the smallest section of the faulted network, which would then reduce the impact of a fault on the rest of the system. To optimise return on investment, the number of customers, the kVA base and the length of line are important considerations during the planning of a recloser installation [22]. Most of the studies on recloser placement have not considered the effect of increasing numbers of re-closers on network damage during faults. The requirement for devices in series to co-ordinate/discriminate has the result that upstream devices, where fault currents are highest, operate in the longest time. Upstream reclosers are intentionally time-delayed to ensure that the recloser closest to the fault trips first, to minimise the number of customers affected [32]. The damage is assessed as a function of the energy exposure during fault conditions. Larger numbers of protective devices in series can, consequently, give rise to slower fault clearance and, ultimately, greater damage. Fast fault clearance is important to avoid irreversible damage to the conductor and other line hardware, motivating for the impact of the settings approach applied to the feeder to be investigated.
The contribution of this research work can be summarised as follows:
• guarantee an optimal safety operation of the equipment by avoiding system damage deriving from the increase of the energy exposure;
• assess the impact of energy exposure when a fault occurs into the electrical system in the function the number and placement of reclos-ers to describe the minimum setting approach of protecting the equipment; and
• provide experimental setting and simulation results based on the variation of number and placement of reclosers and the effect of the settings methodology that describes the energy exposure of the feeder.
The present study used a simulated radial feeder to explore the effects of the number and position of reclosers on the energy exposure during faults. The effects were examined for two conventional setting approaches being applied to the re-closers and for cases with and without 'highest' protection elements.
2. Method
2.1. Test setup
All assessments of damage were done on a simulated 30 km line constructed of an aluminium conductor steel-reinforced (ACSR) Mink line and supplied from a busbar with a three-phase fault level of 7.33 kA. The Mink conductor has an emergency current rating of 272 A and a 1 s current rating of 7.11 kA. The 1 s current rating is the maximum short-circuit current that the overhead line can withstand for one second. This was derived from the temperature limit of the specific device. Permanent damage occurs wherever the energy exposure level or the let-through energy exceeds the short time withstand rating of the conductor [33]. The energy exposure of an overhead line is defined by Equation 1 [34, 35].

where E is the energy exposure, I the fault current and t is the duration of the fault current. The fault current and the corresponding recloser tripe time (TT) was calculated at every 1 km interval of the feeder shown in Figure 1. Energy exposure was then calculated and analysed for variations of combinations of the following scenarios:

• the number of reclosers on the feeder;
• the position of reclosers;
• the recloser settings methodology; and
• the auto-reclose approach.
From Equation 1, the time that the conductor is exposed to the fault current is the only parameter that can be controlled without making any modifications in primary plant. A fault current limiter could be installed to reduce the fault current, but would require further investment. The time-period line and its components that are exposed to the fault current are dependent on the settings of the protective devices (e.g. reclosers). The settings approach applied to the reclosers has a significant impact on the energy exposure of the feeder.
2.2. Settings approach
2.2.1 Delayed protection settings
The fault level at every kilometre of the line was calculated for the feeder in Figure 1 and suitable time-delayed over-current settings were applied to every recloser according to published guidelines [36], i.e.:
• the pick-up should be set between 100% and 120% of the thermal limit of the thinnest conductor within the over-current reach;
• the pick-up should be sensitive enough to detect 80% of phase-to-phase fault current at the end of the intended reach, allowing for the bypassing of one immediate downstream re-closer; and
• the grading between two devices should be done at the maximum expected current at the point of overlap. A grading margin of 400 millisecond (ms) was used for all scenarios.
In this test-setup, all reclosers were set using the normal inverse characteristic. The TT of the normal inverse curve was determined by Equation 2 [37].
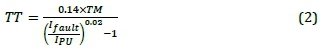
where TM is the time multiplier, Ifauit is the fault current and Ipu is the current pick up setting. It can be inferred that TT of the relay reduces exponentially as the fault current increases. In each scenario, a comparison of the energy exposure of the feeder was shown for the two settings methodologies described below. The two setting methodologies were analysed using the top-down approach and the bottom-up approach, i.e.:
• the top-down approach entails setting the feeder circuit-breaker 400ms faster than the transformer's overcurrent protection at T in Figure 1. The transformer protection is typically set to 1.5 s for a busbar fault. All downstream reclosers are graded with upstream re-closers with a grading margin of 400 ms. Re-closer A is set to trip in 1.1 s and the time multiplier is calculated using Equation 2 for Ia. The trip time of recloser A is calculated for Ib. The time multiplier for recloser B is then calculated by setting the TT 400 ms faster than the calculated TT of recloser A for Ib;
• the bottom-up approach entails setting the re-closers closest to the loads as fast as possible, with a minimum time multiplier. All upstream devices are graded with downstream reclosers. The trip time of the feeder circuit-breaker, therefore, depends on the number of reclosers that need to be graded. The upper limit of the TT for the feeder circuit-breaker is the TT of the transformer minus the 400 ms grading margin. Recloser B in Figure 1 is set to a minimum time multiplier of 0.05 and the corresponding TT for Ib is calculated. Recloser A should then be set to 400 ms slower than recloser B for Ib. The time multiplier of recloser A is calculated using Equation 2.
2.2.2 Instantaneous protection settings
Most overcurrent relays are fitted with a high-set instantaneous element. The application of a highset makes a reduction in TT at high fault levels possible. The instantaneous element or high set on the feeder circuit breaker is set so that it will not operate for the maximum through-fault current seen by the successive recloser [32]. A setting equal to 150% of the fault current level at the downstream recloser position is assumed, to cater for network modelling errors, relay measurement errors and transient over-reach [38].
2.2.3 Auto-reclose approach
An auto-reclose approach of three trips to lock-out is assumed [32]. This implies that the feeder will be exposed to a permanent fault current three times consecutively before the recloser locks out. It is assumed that the conductor will not dissipate heat significantly over the short time-span of the auto-reclose dead times. The energy exposure of a feeder for a permanent fault is, therefore, three times that of a transient fault that is cleared with one auto-re-close cycle. A success rate of 89% is reported by Gomez and Morcos [39] for the first shot, 5% for the second and 1% for the third. Using this as an assumption, the energy exposure for a fault at a specific point on the network is calculated with Equation 3.
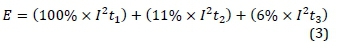
where E is the energy exposure, I is the short-circuit current and tn is the duration of the short-circuit current with n = trip 1, 2 or 3, respectively.
This methodology was simulated in Matlab R2014b for the various situations and cases prescribed in Section 3. This was made in two principal cases: the effect of the setting approach and the variations in the recloser number.
3. Results and discussion
3.1. The effect of the settings methodology used on the energy exposure of the feeder
The impact of the top-down and bottom-up settings methodologies on the energy exposure on the feeder was investigated. For the given positions and protection settings of three reclosers provided in Table 1, the energy exposure for a fault at every 1 km interval of the feeder was plotted as shown in Figure 2. The settings methodology was varied between the top-down and bottom-up approach, with and without auto-reclose. High-set elements were not applied for a better analysis of the effect of the settings strategy.
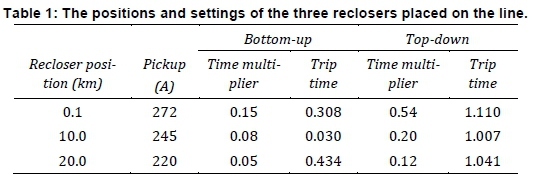
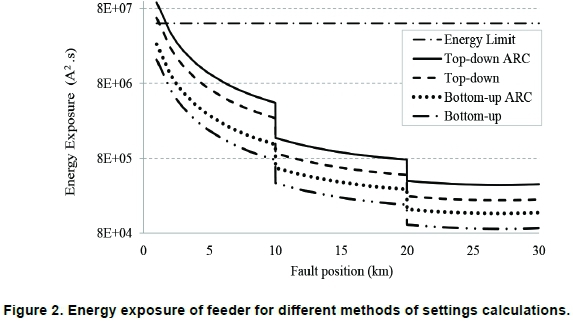
Figure 2 shows that the energy exposure of the feeder where the top-down approach was used was substantially higher than where the bottom-up approach was used. The difference in TT between the two setting methodologies for a close-up fault is shown in Table 1. It can be deduced that the settings methodology and resulting TTs of the reclosers had a significant impact on the energy exposure of the feeder. The energy exposure was most significant in the portion of the feeder closest to the source, where the fault current of the feeder was highest and where the energy limit could possibly be exceeded. The TT had a significant effect on the energy exposure only at high fault levels, near the source. If all protection devices were set to auto-reclose, the energy exposure would increase significantly.
3.2. Variations in the recloser number: bottom-up approach
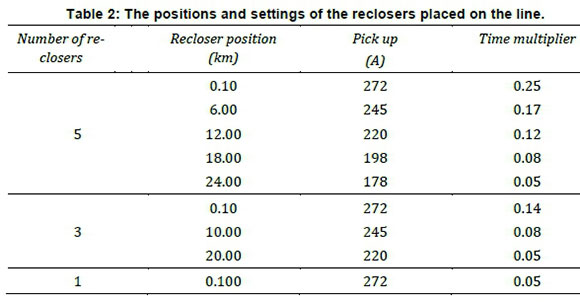
The impact of the number of reclosers in series on the energy exposure on the feeder when the bottom-up approach was used was investigated. For the given number, position and protection settings of reclosers provided in Table 2, the energy exposure for a fault at every 1 km interval of the feeder was plotted as in Figure 3, for a feeder with one, three and five reclosers. High-set and auto-reclose elements were not applied to better describe the accuracy on the bottom-up strategy. Figures 3 and 4 represent the same data, but using different scales for the ordinate axis. Figure 3 represents the data on a logarithmic scale, showing the detail of the step-decrease in energy exposure at every recloser position. Figure 4 represents the data on a linear scale and the perspective of the actual magnitude of the energy exposure.
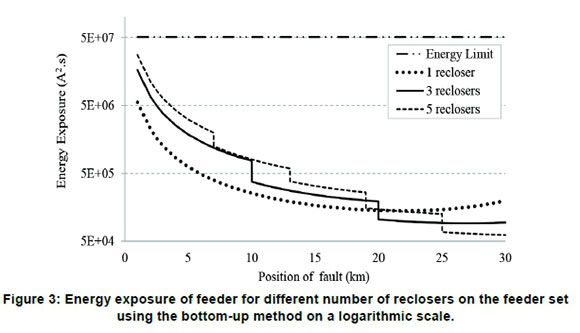
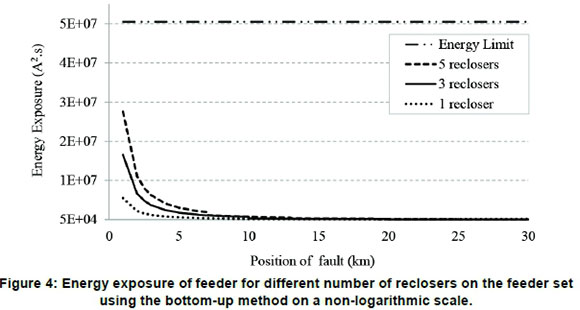
The cumulative energy exposure of the feeder increased with an increasing number of reclosers in the network. A step-decrease in energy exposure occurred at every recloser position in Figure 3, caused by the decrease in TT at each recloser. The gradient of the decrease in energy exposure between each recloser reduced as the fault level reduced along the length of the feeder. At low fault levels, the impact of increasing TT dominated, causing an inverse in the graph at 20 km on Figure 3, where the gradient becomes positive in the case of one recloser. The insignificance of the impact of the increasing gradient at 20 km is evident in Figure 4.
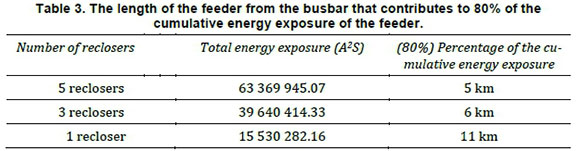
Table 3 shows that with one recloser on the 30 km feeder, 80% of the cumulative energy exposure of the feeder was contributed by the first 11 km of the feeder. This length decreases to 5 km with the addition of four reclosers. The dominance of the energy exposure near the source increased with the number of reclosers because of the impact of the increasing TT of the feeder breaker. Having one re-closer would, consequently, be the best option to minimise thermal damage to conductors; however, this would not be a practical solution since all customers on the line would lose supply for every fault on the line.
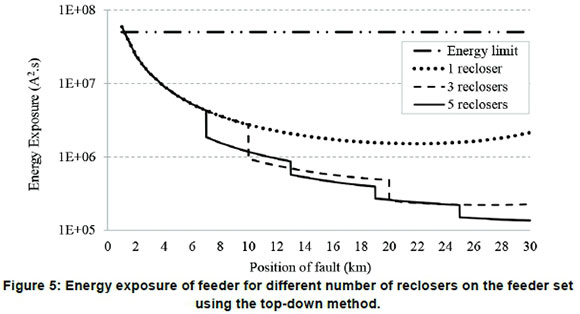
3.3 Variations in the recloser number: top-down approach
The scenario in Section 3.2 was repeated using the top-down approach. The TT of the feeder recloser was set to the maximum possible, i.e., at the TT of the upstream transformer, minus a grading margin of 0.4 s, resulting in a TT of 1.1 s, as shown in Table 4. Since the TT of the feeder circuit-breaker was the same, irrespective of the number of reclosers, the energy exposure of the first portion of the network was identical in all cases. The portion between the feeder breaker and the first recloser was most significant, since it exceeded the energy limit. With every additional recloser, the energy exposure decreased at the position of the recloser. This resulted in the feeder with the most reclosers having the least energy exposure. From Figure 5, it is evident that having one recloser would be the worst option, since energy exposure was maximum.

3.4 Variations in recloser positioning: bottom-up approach and the application of high sets
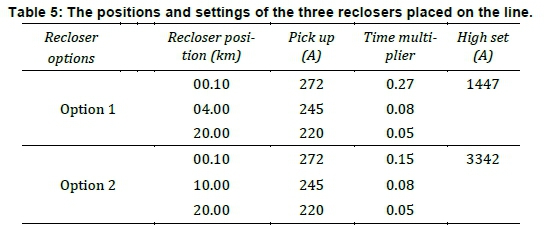
The impact of position of reclosers on energy exposure on the feeder when the bottom-up approach is used was investigated. The number of reclosers was kept constant, while the position of the second re-closer was varied. None of the reclosers were set to auto-reclose. The impact of the application of an instantaneous high-set was also examined. Although the high-set was configured to trip instantaneously, the actual TT was equivalent to the circuit-breaker operating time since the circuit-breaker was not capable of tripping instantaneously. The circuit-breaker operating time is defined as the time elapsed between the trip initiation and when the arc has been extinguished and is assumed to be 80 ms [25]. For the position and protection settings of reclosers provided in Table 5, the energy exposure for a fault at every 1 km interval of the feeder is plotted in Figure 5 with and without a high-set applied on the feeder circuit-breaker.
4. Test results and discussion
An instantaneous high-set was only applied to the feeder breaker and was selected by multiplying the fault level at the second recloser by 1.5. This approach ensured that the high-set will not trip instantaneously for faults beyond the successive re-closer. The lower the current pick-up value of the high set was, the lower was the energy exposure of the feeder. Since the high set was dependent on the fault level at the position of the successive recloser, the high set was in the scenario where the second recloser placed further away from the feeder breaker that was set lower. From Figure 6, the effect of the high-set in option 1 is shown in the transition of energy exposure from section A0-B0 to A2-B2, which represents a 74% reduction in the cumulative energy exposure. The effect of the high-set in option 2 is shown in the transition of energy exposure from section A1-C1 to A2-C2, which represents an 83% reduction in the cumulative energy exposure. The application of a high-set on the first re-closer would reduce the damage between the first and second reclosers, where the energy exposure is most critical.
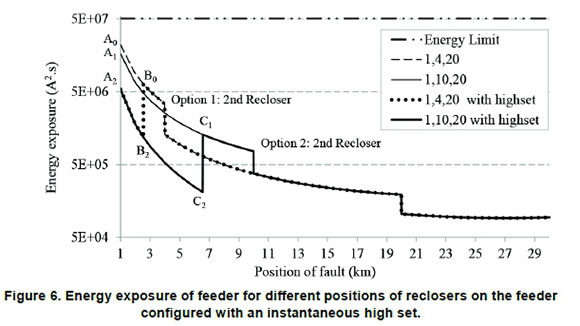
The cumulative energy exposure for option 2 is 30% lower than that of option 1 without the application of high-sets, and with the application of high-sets it is 55% less than that of option 1. The position of reclosers also influences the time-delayed protection settings. Using a grading margin of 0.4 s in both scenarios, the time multipliers for the feeder breaker of option 1 was 0.27 and the time multiplier for option 2 is 0.15. This demonstrates that grading relays at higher currents result in a greater time multiplier and therefore results in slower TTs for close-up faults. Figure 6 illustrates how the change in positioning of reclosers can affect the damage to the network in the case where no high-sets are applied. Between the first and second reclosers, the energy exposure for option 1 was 33% higher than that of option 2, and between the second and third reclosers it was 50% lower than the energy exposure of option 2. Energy exposure is thus higher where it is more critical, and it drops where it is less critical. This difference is attributed to the difference of the TTs between the two options for close-up faults.
Moving the second recloser further away from the source would allow the application of a high-set without compromising on grading; and faster standard inverse curves can be applied to the first and second reclosers. This would curb the energy exposure effectively. Deviations from the high-set approach are made when the possible damage on the network is critical, and an effective high-set cannot be set using the standard theory because of the position of the successive reclosers. There is a possibility that the reclosers would not grade because of the deviation.
The lower the high set is, the lower is the energy exposure of the feeder. The pick-up setting of a high-set on any recloser is dependent on the fault current at the successive reclosers, which depends on the position of the successive reclosers. As the post of the successive recloser is shifted further away from the source, the application of a high-set is possible without compromising grading between reclosers. For applications in which the first re-closer is very close to the feeder circuit breaker, the option to apply a non-graded high-set may be implemented to limit the feeder's energy exposure. In this paper, the number and placement of reclosers on a feeder have been identified as a constraint on the optimal protection settings applied to the feeder to ensure minimal energy exposure. The energy exposure of a feeder should thus be a consideration in determining the optimum number and placement of reclosers.
The impact of distributed generation can adversely affect the number and placement of reclos-ers on the network. Considering recloser placement from an energy exposure perspective changes the approach from a standard time delayed approach to a more adaptive approach.
5. Conclusions
It is critical to keep the let-through energy below the withstand capability of the equipment. The application of the bottom-up standard inverse coordination approach on a distribution network is more efficient in minimising the energy exposure than the top-down approach. The bottom-up approach allows more reclosers to be added without exceeding the energy limit. As the number of reclosers in the network increases, the energy exposure of the feeder increases. Therefore, an optimal approach that can guarantee a safety operation of the equipment by avoiding damage is analysed to minimise the impact of increase in the energy exposure of the feeder. The application of a high-set on the feeder breaker is very efficient in reducing the let-through energy where it is most critical.
Author roles
R. Thomas: Research formulation, data collection, data analysis and write-up
S. van Zyl: Research formulation, data collection, data analysis and write-up
R. M. Naidoo: Project supervision, research formulation, write-up, proof reading and research funding
R. C. Bansal: Project supervision, research formulation, write-up, proof reading and research funding
T. N. Mbungu: Research formulation, analytical implementation, write-up and proof reading.
M. Bipath: Research formulation and research funding
References
[1] Bansal, R. C. 2019. Power system protection in smart grid environment. CRC Press, New York, USA. [ Links ]
[2] Mbungu, N. T., Bansal, R. C., Naidoo, R. M and Bazolana, M. J. P. 2019. Discriminatory protection analysis of three-phase asynchronous motors during power disturbances. Electric Power Components and Systems, 47(4-5): 1-13. [ Links ]
[3] Rodrigues E., Leite H., Silva Nand Miranda I. 2016. Reclosers to self-healing schemes in distribution networks: A techno-economic assessment. Institute of Electrical and Electronics Engineers International in Energy Conference (Energycon): 1-6. [ Links ]
[4] Mbungu, N. T., Naidoo, R., Bansal, R. Cand Bipath, M. 2017. Optimisation of grid connected hybrid photovoltaic-wind-battery system using model predictive control design. Institution of Engineering and Technology Renewable Power Generation, 11(14): 1760-1768. [ Links ]
[5] Naidoo, R., Pillay, P., Visser, J., Bansal, R. Cand Mbungu, N. T. 2018. An adaptive method of symmetrical component estimation. Electric Power Systems Research, 158: 45-55. [ Links ]
[6] Slabbert, M., Van Zyl, S., Naidoo, Rand Bansal, R. C. 2016. Evaluating phase over-current protection philosophies for medium-voltage feeders applying let-through energy and voltage dip minimization. Electric Power Components and Systems, 44(2): 206-218. [ Links ]
[7] Mbungu, N. T., Bansal, R. C., Naidoo, R., Miranda, V., and Bipath, M. 2018. An optimal energy management system for a commercial building with renewable energy generation under real-time electricity prices. Sustainable Cities and Society, (41): 392-404. [ Links ]
[8] Albu M., Sänduleac M., and Stänescu C. 2017. Syncretic use of smart meters for power quality monitoring in emerging networks. IEEE Trans. Smart Grid, 8(1): 485-492. [ Links ]
[9] Mbungu T.N., Naidoo R., Bansal R. C., and Bipath M. 2016, December. Smart SISO-MPC based energy management system for commercial buildings: Technology trends. IEEE in Future Technologies Conference (FTC): 750-753. [ Links ]
[10] Manditereza P., and Bansal R. C. 2016. Renewable distributed generation: The hidden challenges-A review from the protection perspective. Renewable and Sustainable Energy Reviews, (58): 1457-1465. [ Links ]
[11] Mbungu, N. T., Naidoo, R. M., and Bansal, R. C. 2017. Real-time electricity pricing: TOU-MPC based energy management for commercial buildings. Energy Procedia, (105): 3419-3424. [ Links ]
[12] Line S. 2013. IEEE standard requirements for overhead, pad-mounted, dry-vault, and submersible automatic line sectionalizers for alternating current systems up to 38 kV. [ Links ]
[13] Thomas R. 2014. Optimising the number and position of reclosers on a medium voltage distribution line to minimise damage on equipment (Masters dissertation, University of Pretoria). [ Links ]
[14] Wang X., Strachan S., Kirkwood J., and McArthur S. 2014, September. Automatic analysis of pole mounted auto-recloser data for fault prognosis to mitigate customer supply interruptions. IEEE in Power Engineering Conference (UPEC), 49th International Universities (pp. 1-6). [ Links ]
[15] Wright L., and Ayers L. 2017. Mitigation of undesired operation of recloser controls due to distribution line inrush. IEEE Trans. Industry Applications, 53(1): 80-87.1 [ Links ]
[16] Costa M., Josken J and Walder D. 2015, April. Fault hunting using three-phase reclosers. IEEE in Rural Electric Power Conference (REPC), (pp. 17-21). [ Links ]
[17] Manditereza P., and Bansal R. C. 2016. Renewable distributed generation: The hidden challenges-A review from the protection perspective. Renewable and Sustainable Energy Reviews, 58, 1457-1465. [ Links ]
[18] Dan A., Hartmann B., Kiss J., and Vokony I. 2015, June. Recloser application possibilities and the related benefits at a Hungarian MV network. In IEEE PowerTech, Eindhoven (pp. 1-6). [ Links ]
[19] Sun, C., Wang, X., and Zheng, Y. 2019. Data-driven approach for spatiotemporal distribution prediction of fault events in power transmission systems. International Journal of Electrical Power & Energy Systems, (113): 726738. [ Links ]
[20] Slabbert, M. J., Bansal, R. C and Naidoo, R. 2018. Application of let-through energy to back-up over-current protection on high-voltage feeders. IET Generation, Transmission & Distribution, 12(19): 4341-4347. [ Links ]
[21] Le, D., Bui, D., Ngo, C and Le, A. 2018. FLISR approach for smart distribution networks using e-terra software- a case study. Energies, 11(12): 1-33. [ Links ]
[22] Billinton R and Jonnavithula S. 1996. Optimal switching device placement in radial distribution systems. IEEE trans. on power delivery, 11(3): 1646-1651. [ Links ]
[23] Da Silva L., Pereira R., Abbad J., and Mantovani J. 2008. Optimised placement of control and protective devices in electric distribution systems through reactive tabu search algorithm. Electric Power Systems Research, 78(3): 372-381. [ Links ]
[24] Da Silva L., Pereira R., Abbad J., and Mantovani J. 2009. Optimized allocation of control and protective devices in electric distribution systems. Electric Power Components and Systems, 38(1): 1-21. [ Links ]
[25] Sekhar P., Deshpande A., and Sankar V. 2016, December. Evaluation and improvement of reliability indices of electrical power distribution system. IEEE Power Systems Conference (NPSC), 2016 National (pp. 1-6). [ Links ]
[26] Popovic D., Greatbanks J., Begovic M., and Pregelj A. 2005. Placement of distributed generators and reclosers for distribution network security and reliability. International Journal of Electrical Power & Energy Systems, 27(5): 398-408. [ Links ]
[27] Raoofat, Mand Malekpour R. 2011. Optimal allocation of distributed generations and remote controllable switches to improve the network performance considering operation strategy of distributed generations. Electric Power Components and Systems, 39(16): 1809-1827. [ Links ]
[28] James Jand Salhi S. 2000. The location of protection devices on electrical tree networks: a heuristic approach. Journal of the Operational Research Society, 51(8): 959-970. [ Links ]
[29] Soudi Fand Tomsovic K. 1998. Optimized distribution protection using binary programming. IEEE Trans. Power Delivery, 13(1): 218-224. [ Links ]
[30] Teng, Jand Lu C. 2002. Feeder-switch relocation for customer interruption cost minimization. IEEE Trans. Power Delivery, 17(1): 254-259. [ Links ]
[31] Tippachon, W., and Rerkpreedapong D. 2009. Multiobjective optimal placement of switches and protective devices in electric power distribution systems using ant colony optimization. Electric Power Systems Research, 79(7): 1171-1178. [ Links ]
[32] Areva T&D 2002. Overcurrent protection for phase and earth faults in Network Protection & Automation guide. Ch. 9, sec. 3: 123-151. [ Links ]
[33] Michael, M., Stephan, P., & Stefan, J. 2008, April. Elongation of overhead line conductors under combined mechanical and thermal stress. IEEE in Condition Monitoring and Diagnosis, International Conference on: 671-674. [ Links ]
[34] Parise G., and Adduce M. 1998. Conductor protection against short circuit current: available I* 2 t evaluation IEEE in Thirty-Third IAS Annual Meeting Industry Applications Conference (671-674). [ Links ]
[35] Mitolo M., and Tartaglia M. 2012. An analytical evaluation of the factor for protective conductors. IEEE Trans. Industry Applications, 48(1):211-217. [ Links ]
[36] Mason C. 1956. The art and science of protective relaying. John Wiley and Sons New York: GE Publishers. [ Links ]
[37] IEC 60255-155. 2009. Measuring relays and protection equipment -Part 151: Functional requirements for over/under current protection. [ Links ]
[38] Van Zyl S. 2014. Guide for the application and setting of phase instantaneous over current protection. Eskom, Pretoria, Gauteng: 240-77570691. [ Links ]
[39] Gomez J., and Morcos M. 2001. Voltage sag mitigation using overcurrent protection devices. Electric Power Components and Systems, 29(1): 71-81. [ Links ]
* Corresponding author: +971 65050971; email: rcbansal@ieee.org

