


Servicios Personalizados
Articulo
 Inglés (pdf)
 Articulo en XML
 Referencias del artículo
Indicadores

Links relacionados
-
 Citado por Google
 -
 Similares en Google
Compartir

 Permalink
Journal of Energy in Southern Africa
versión On-line ISSN 2413-3051
versión impresa ISSN 1021-447X
J. energy South. Afr. vol.30 no.4 Cape Town nov. 2019
http://dx.doi.org/10.17159/2413-3051/2019/v30i4a5675
Holistic analysis of the effect on electricity cost in South Africa's platinum mines when varying shift schedules according to time-of-use tariffs
William George ShawI, *; Marc MathewsII; Johan MaraisIII
ICentre for Research and Continued Engineering Development, North-West University and consultants to TEMM International (Pty) Ltd, P.O. Box 11207, Silver Lakes, 0054, South Africa, https://orcid.org/0000-0002-8751-1166
IICentre for Research and Continued Engineering Development, North-West University and consultants to TEMM International (Pty) Ltd, P.O. Box 11207, Silver Lakes, 0054, South Africa. https://orcid.org/0000-0003-4439-8797
IIICentre for Research and Continued Engineering Development, North-West University and consultants to TEMM International (Pty) Ltd, P.O. Box 11207, Silver Lakes, 0054, South Africa. https://orcid.org/0000-0003-4302-0637
ABSTRACT
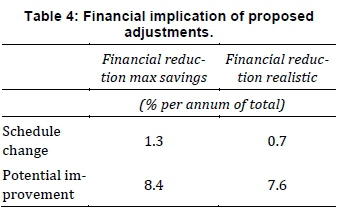
In the past the cost of electricity was not a significant concern and was not common practice for mining companies to consider peak time-of-use (TOU) tariffs for their shift schedules. It has become more prevalent, as TOU tariffs continue increasing, to consider energy saving important. A study was carried out to analyse the mining operation of a South African deep-level platinum mine in respect of integrated load management, shift changes and TOU schedules. This was achieved by thoroughly analysing energy consumers, mine operational schedules and their interconnectedness. A specific mining system was analysed as a case study and a maximum savings scenario was determined, using the methodology formulated. The maximum savings scenario schedule change resulted in a 1.3% cost reduction. System improvements had an additional potential reduction effect of 8.4%, which was primarily the result of a reduction in compressors' power consumption. The implications of the proposed schedule adjustments necessitated a realistic scenario. The realistic scenario had an effective financial reduction of 0.7%. The realistic schedule change, however, opened the door for large system operational improvements, which could increase the reduction potential by 7.6%. The study methods described illustrate the potential implications of integrated load management and operational schedule optimisation on the power demand and cost savings in the mining industry, specifically focusing on deep-level platinum mines.
Highlights
• Integrated load management and schedule adjustment savings potential
• Case study of a deep-level platinum mine
• Significant energy reductions possible considering method discussed
• Includes comprehensive literature review of load management studies and effects
Keywords: schedule adjustment; cost reduction; deep-level mine; integrated load management, platinum mining
1. Introduction
The mining industry is under financial pressure because of factors such as the cost of electricity, which was not a problem from inception until the recent South African energy crisis [1, 2]. It was subsequently not in the spotlight from a mining perspective. A need, therefore, arises to save energy and reduce energy costs. Input costs increased steadily against declining gold and platinum prices, making it more common for certain mining shafts to be mothballed and cleared by contractors [3]. This further led to an increase in tensions as unemployment and poverty levels increased [3]. Energy reduction projects have been ongoing from the late 2000s [4], but with the South African energy crisis of 2008, in which year there was also a substantial increase in electricity tariffs, they started to accelerate [1, 2]. Van der Zee [5] found that, in a typical South African underground platinum mine, electricity costs were approximately 24% of the total expenditure of the mine in 2015. This 24% can further be divided into summer and winter use. The cost of electricity during summertime peak time-of-use (TOU) was found to be approximately 30% of the total daytime energy costs under Eskom's MegaFlex tariff structure [6]. Winter tariffs led to a substantial 50% of the total daytime energy costs spent during peak TOU [6]. However, the peak TOU hours only constitute 20% of the entire day as calculated from the MegaFlex tariff structure [6].
The energy distribution occurs within an extensive network [7, 8], relevant to underground reticulation for deep-level mines [9]. Figure 1 provides a better understanding of the mining system when considering the entire collection of different components needed to operate a mine, and illustrates the specific mining system components [9]. A review of studies by Amadi-Echendu and Bosaletsi [7] and Montso and Pretorius [8] reveals that an energy network consists of multiple incomers from the primary electricity supplier [7, 8]. The incomers then feed the energy to numerous feeders. Through the feeders, the energy is finally distributed to the lowest level and the users. The users consist of various energy consumers which are relevant to specific mining operations. These components can be described by, but are not limited to, the following groups (as illustrated in Figure 1 and elaborated from literature in Table 1):
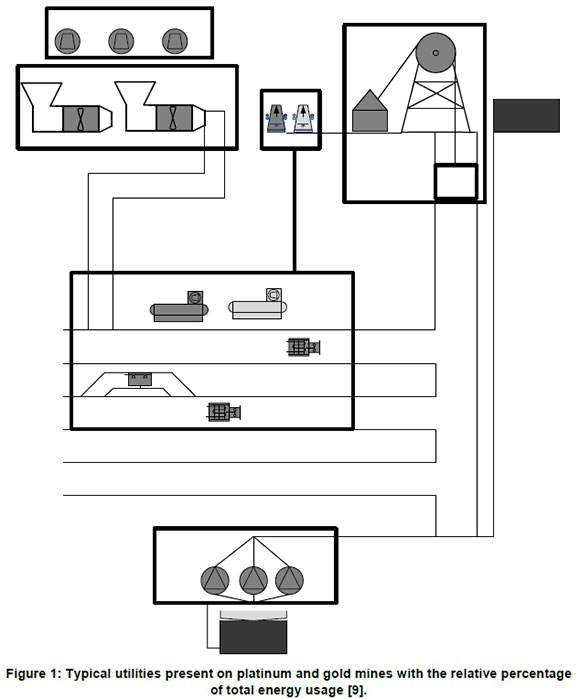
• compressors;
• ventilation fans;
• refrigeration systems;
• pumping systems;
• hoisting systems; and
• conveying systems.
Variation in the energy usage profile occurs throughout a normal operational day as the different systems, shown in Figure 1, are switched on and off and ramped up and down depending on the requirements underground. This is mainly because of the different shifts and schedules used to facilitate underground mining [10].
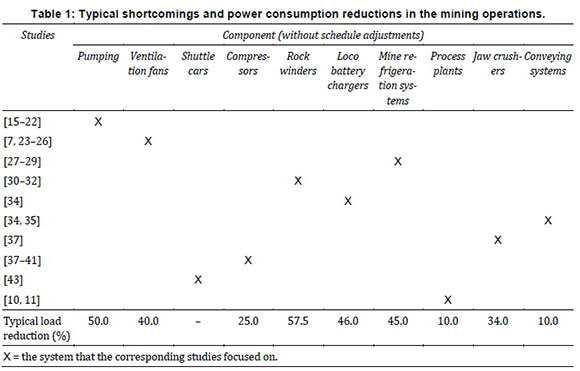
The result is that some energy consumers are utilised more during certain times of the day or certain shifts. During the drilling shift, for instance, compressed air is utilised fully, i.e., compressors run at maximum power demand levels [10]. Ventilation fans are typical equipment utilised throughout the day underground to extract dangerous gases from the mine after the blasting operations [10]. Winders are utilised to transport mining employees up and down the shaft and for removing ore from below ground; consequently, winder utilisation usually occurs maximally before and after drilling, afternoon and night shifts [10]. Compressed air is again utilised to a degree during the night shift when loaders handle ore and waste onto locomotives. Pumping systems automatically run whenever the dams at the bottom of the shaft reach specific levels [10]. Process plants, classified as high energy consumers by Bredenkamp, consuming up to 14% of total mine energy [9], were also found to have a constant demand for utilities such as compressed air [9, 10]. Process plants typically operate for 24 hours consistently, using utilities as needed [10, 11]. The prevalence of these changes in energy usage with changing shifts has provided the opportunity for energy cost-saving projects that take advantage of the TOU tariffs by shifting load to different times, as illustrate by Storm et al. [13] on an irrigation pumping system and Mohamed and Tariq [14] in a review of different load management strategies. Table 1 indicates the current state-of-the-art regarding mine energy reduction projects. The shortcomings illustrated are from the systems that were analysed regarding energy reduction and operational improvement projects. From Table 1 it can be deduced that, although numerous studies were done concerning individual systems, few studies were found considering integrated load management whereas none considered schedule changes. Table 1 also indicates the typical energy consumption reductions found, working around mine schedules, and the use of improved control practices as an energy-saving initiative [15].
A load shift requires the energy and operations of a specific electricity consumer to be reduced during peak TOU tariffs [44]. In addition to load shifts, improved control practices were found, when studying load management and operational improvement in mining, to be a means to reduce energy usage on mines [7, 30, 38, 44]. There is also a consideration of differing shaft schedules on the same system [46]. Misalignment between the schedules of shafts causes difficulty when improving the control system of a specific component, especially when the component supplies to multiple users [11]. Power demand reduction projects were only implemented on isolated systems without adjusting operational schedules [7, 14, 17, 23, 32]. It becomes clear from the reviewed literature, therefore, that studies did not consider changing mine schedules. Mining schedules are normally adhered to and not seen as an aspect of a mining system that can be adjusted. The research on this is abundantly clear as found from the review of sources in Table 1. The table shows that systems are isolated, but the integrated system, with all its underlying components, was not analysed in the literature. The schedules are also adhered to in the literature. There are no studies that integrate load management and mine operational schedules or shifts. Literature in Table 1 shows that different energy consumers are dependent on different shifts in a typical South African mining environment [7, 32, 46]. Chatterjee et al. [10] illustrated the dependency on shifts by analysing the different processes in the mining cycle according to the ventilation airflow necessary as part of their model. Badenhorst et al. [33] illustrated the dependence of winder operation and, therefore, energy consumption on the mine schedule. Peach et al. [47] illustrated the dependency of a mine refrigeration system on the schedule of mining operations. The analysis of the previous studies led to the formulation of the problem and found that these studies did not analyse the full impact of cost optimisation by considering TOU tariffs holistically across an entire mining operation.
The objective of the present study was, consequently, to analyse TOU schedules and the interconnection between utilities, while considering mine operation schedules. The study analysed an entire mining system, defined as all major energy consuming parts of a typical South African mine required for sustainable mining operations. The study was made with regard to integrated load management (with all underlying shafts and decline shafts) to determine the possible effect of holistic load management on the energy usage of a deep-level mine.
2. Methodology
2.1 Overview
An improved analysis strategy for solving the described problem was performed, considering different constraints of a mine. The schedules for the different shafts on a system were then optimised to be able to decrease energy consumption optimally. The energy reduction was applied during specific times when the system allowed for it. Analyses of intensive systems and system constraint were made. The system described is usually defined by the electricity network as well as the compressed air system. The method was formulated to analyse variable utility energy consumption on a mine. It analysed the mine with regard to TOU schedules, based on utility interconnection, whilst also considering mine operation schedules.
2.2 System characterisation
System characterisation consisted of an intensive analysis of the relevant power consumers on a mining system electricity network. The first step of the analysis was to characterise the energy network of a mine using a top-down approach. The approach illustrates the interconnectedness between different parts of the network and how energy was distributed from the incomers down to individual components. The distribution was then analysed from the main supply (by the corresponding electricity producer) to the corresponding lower order components in the system. Characterising the system assists the user in analysing interdependent components throughout the mining system.
2.3 Brief operational analysis
Mining operations are usually related to a fixed schedule to which the mining personnel generally adhere. The schedule describes various shifts that represent actions that must be completed. These actions finally lead to the production of the necessary commodities through coordinated stages that include extraction metallurgy. Generally, the shifts at different mining shafts are mutually dependent. One shift describes a specific mining activity and subsequent shifts describe another action or actions, in steps, to accomplish the final purpose of the underground mining operation: to produce raw ore containing a mineral commodity. The new, improved analysis required an operational analysis. A mining system may or may not consist of various sub-systems (or mining shafts). If the mining system comprises multiple shafts, the analysis describes the investigation of all the relevant shaft operations. Shafts are analysed when they could affect energy consumption, as they may also affect the other sub-systems on the specific system. A shaft (sub-system) may also function as an individual system. During the operational analysis, specific focus was placed on the pressure requirements of each shaft. The shaft pressure requirement was used as an indication of the intensity of the demand for services and, therefore, a proxy for current production. The pressure requirement is applicable where compressed air is primarily utilised as a central service with which to mine [48].
The study by Van Heerden [48] stipulated that further analysis of the pressure requirements is needed. The need to determine the effects of the schedule and energy usage alignment led to the need for further analysis of the pressure requirement. Schmidt and Kissock [49] imply a relationship between the pressure requirement and the power demand and that, if air is compressed to high pressure, it is likely that more work or energy is required [49]. Air at a high flow rate or pressure indicates that the energy content of the air is higher (more kinetic energy), therefore, air at a higher pressure (compressed more) requires more energy input from compressors [49]. On a mine, the power demand can also be linked to the pressure requirement. Active periods in the mine usually require higher pressures as compressed air is one of the primary resources used [48]. The study by Van Heerden also illustrates the similarity between power demand and pressure profiles [48]. Operational analysis describes a vital step where each shaft's operational breakdown is compared to the energy consumption schedule of each user. The execution of the operational analysis gave rise to the study of the dependencies and interdependencies of the energy consumers.
2.4 Dependency analysis
Energy consumers are either dependent on the various system operation schedules or not. This dependency must be analysed to gain an understanding of the multiple unrealised possibilities per the current operational schedule. An energy consumer's degree of use and running status indicates the reliance of a specific consumer on an operational schedule. The dependency of the energy consumer was used during the evaluation phase of the analysis and also to indicate how a specific component's energy consumption changes with regards to the shaft's schedule change on which it depends. A mining system comprises components that are utilised during normal operation throughout the day, such as ventilation fans [10]. The system also includes components that have varying degrees of power demand. Compressors and refrigeration systems are good examples of these, as they are dependent on the mining operation that is currently being executed [27, 37]. The energy consumption of compressor and refrigeration systems has a distinguishable consistency for time of day and weekdays or weekends. There are also components that have more random operational demands, which are not usually related to the mine's operational schedule and do not stay consistent. These components include, but are not limited to, the various types of winders. The winders can also be prone to delays and scheduled inspections weekly and daily [30, 32].
2.5 Optimisation and evaluation
This section outlines the structure followed to determine potential optimisation, which includes the schedule adjustment as well as possible operational improvements; and the evaluation of the optimisation, which may lead to the reformulation of the schedule adjustment.
Operational adjustment
The schedule adjustment proposal considers all factors that are affected, including the financial implications of the adjustment. The proposed schedule adjustment must be able to align the different subsystem operation schedules and also consider the peak TOU tariff times applied to the mine. The schedule adjustment was used to better align mine operations for two reasons: the reduction in energy consumption, and the improved alignment between shaft schedules, which may potentially lead to further reductions. Alignment was the priority, with the lower-order priority being to also decrease the energy consumption during the morning and evening peak TOU periods.
Evaluation
The evaluation result was based on the feasibility of the specific proposal being implemented. Some constraints were analysed to verify the recommendation based on the ground of implementation. The following questions were raised to validate the feasibility of schedule adjustment proposal:
• Is the schedule adjustment of any one shaft too large, considering the production of the shaft (two hours on a shaft with more than 6 000 tonnes production and four hours when the production is less than 6 000 tonnes)?
• Is the schedule adjustment of any one shaft unrealistic regarding the start and end times of a specific shift (such as changes in the middle of the night or an afternoon shift starting at 22:00)?
• Is there a specific shift that does not 'see daylight' at all?
• Do the shifts of different shafts align enough to merit the change?
Addressing these factors could potentially lead to a re-analysis of the schedule of the mining sub-systems, after which an improved schedule adjustment proposal could be made.
Possible improvement simulation
An operational improvement analysis of the system and its lowest order components consisted of a statistical analysis where the energy consumer's daily standard deviation was calculated. The standard deviation was compared with the average power demand of the same consumer. The difference between the power demand outside drilling shift and the average energy consumption minus the reduction percentage of the standard deviation was calculated. If the measured energy consumption was more, then the capability existed to simulate power demand reductions on the component. The reduction potential analysis uses Equations 1 and 2.
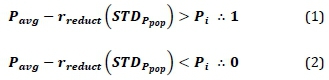
where Pavgis the average power demand on a normal weekday for a month's energy data of the system; rreductis the reduction ratio found through literature; STDp is the standard deviation of the power demand average found from analysing the system's energy data; and Ptis the initial power demand at a specific time interval. In terms of Equations 1 and 2, if the equations equate to a value higher than the initial power demand, a value of 1 was assigned to the specific time interval and the power demand could be reduced using Equation 3 and the logic described by it. If it is not the case, then a value of 0 was assigned to the specific time interval and no energy reduction was simulated.

where Pnewis the new, simulated and reduced power demand of the component and Ptis the initial power demand at a specific time interval. The resulting simulated, improved power demand profile was then analysed to determine the possible financial cost reduction, based on the simulation of the proposed and investigated power demand reductions. The newly improved energy usage was determined for each component, while considering the purpose of the component relative to the system.
3. Results
The results of the study were used to prove the concept and demonstrate the potential of introducing proposed schedule changes. When considering only weekdays, the system had a total yearly energy consumption cost of approximately ZAR160 million. The system was characterised according to the electrical layout, which was used to isolate each energy consumer. The electrical layout was used as a roadmap to apply the top-down method, while the mine layout is illustrated in Figure 2, illustrating all the relevant shafts relative to each other.
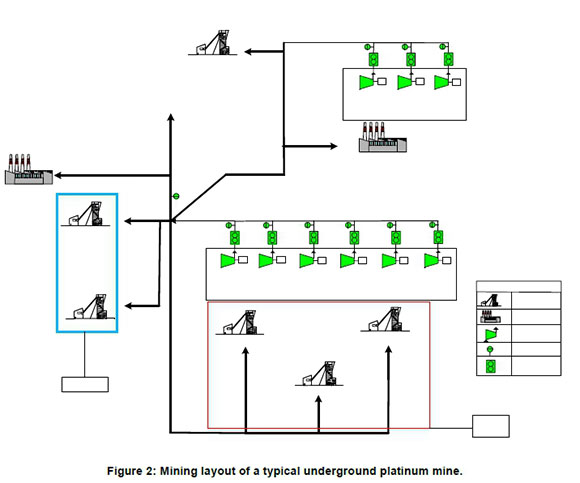
The #2 shaft was not applicable to this study and, therefore, omitted, as it did not produce any ore and only consisted of a concentrator with a constant operational schedule. The #1 and #3 shafts were grouped under one shaft as both shafts had the same operational schedules. The #4 - #6 shafts together had the same operational schedules and worked around the same mining operations. They were, therefore, categorised as #7 shaft for simplification. The #1 shaft is the larger of the two groupings in terms of production and therefore carries a larger weight when operational decisions are made.
3.1 System characterisation and operational analysis
An analysis of the various schedules, as illustrated in Figure 3, was necessary as this was the only way the operational differences could be clearly understood. The different coloured rectangular segments represent the different shifts, also described at the top of Figure 3, with the graph demonstrating the pressure profiles and their differences. The pressure profiles clearly illustrate the different operational schedules. The pressure may be related to the power demand, as a reduction in pressure usually leads to a decrease in energy consumption. A reduction in pressure also indicates less personnel working underground. A comparison of the two operational schedules of #1 shaft and #7 shaft illustrates the different times blasting shift (black block) occurs at the shafts. A lag in the schedule can also be seen during morning hours at #7 shaft.
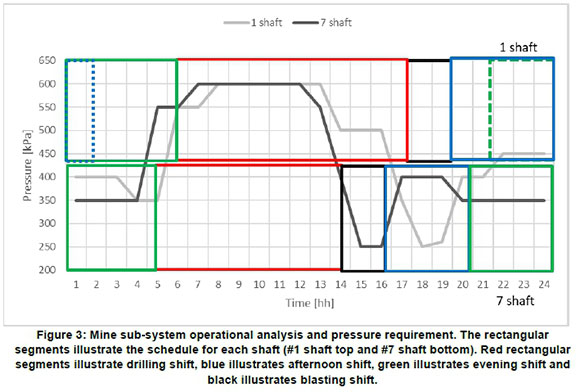
Figure 3 also illustrates the difference in the pressure demanded by each shaft during the afternoon and evening hours (14:00-19:00). The #7 shaft reached a minimum required pressure first at 14:00. This was followed by #1 shaft reaching the minimum pressure requirement at 17:00, one hour after the #7 shaft blasting shift had ended. The difference in pressure requirement was also illustrated during the morning. The #7 shaft drilling shift started at 05:00 whereas #1 shaft drilling shift commenced at 06:00. This time difference implied a decrease in pressure by 200 kPa.
3.2 Operation adjustment
This section describes the schedule adjustments required at the relevant shafts to accomplish an improved schedule. The improved schedule further allows for enhanced operations concerning TOU tariff times. The schedule adjustment was made with two considerations: to achieve maximum financial cost reductions, and to heed a realistic new schedule that, when applied, can potentially lead to further operational improvements and finally to financial savings.
Maximum-potential schedule adjustment
The first scenario that was analysed illustrated an example where, as described in the analysis strategy, the maximum potential financial reduction was simulated. The pressure requirement profiles for both #1 and #7 shafts are shown in Figure 4, where there was an improved alignment between the two pressure profiles. The pressure alignment also implied an improved alignment between the operational schedules at the two shafts. The schedule represented by the pressure requirement still demonstrated a difference, however, the pressure requirement minimum ranges aligned. The minimum ranges were also found during Eskom's peak TOU tariff times.
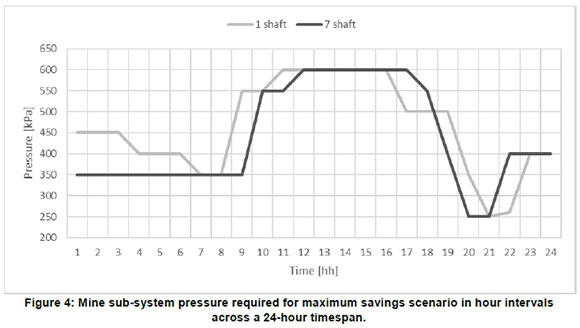
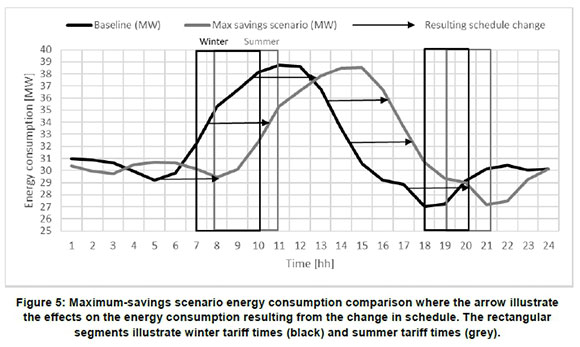
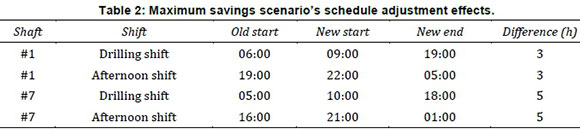
Figure 5 illustrates the schedule adjustment for the energy consumption change regarding the maximum savings scenario, where the arrows represent the effect of schedule changes. The energy consumption reached a minimum during peak TOU tariff times (07:00-11:00 and 18:00-21:00), consequently, the first scenario became representative of the maximum financial reduction. The effects of the proposed schedule are indicated in Table 2, which shows that both the #1 shaft and #7 shaft schedules were adjusted. #7 shaft was adjusted more than #1 shaft (5 hours compared to three hours) with both the drilling and afternoon shift changing in terms of ending time as indicated in Table 2 and illustrated by Figure 5. As previously mentioned, #1 shaft is larger in terms of production, which was incorporated into the simulation of the maximum savings scenario.
Realistic schedule adjustment
The proposed schedule was deemed too large of a change in time and would have been difficult to implement in a mining system with a minimum of 8 000 workers at work during the average working day. The proposed adjustment of three hours at #1 shaft would likely not be feasible. The shaft had at least 1.5 times more working personnel than #7 shaft. It was, therefore, decided to analyse a realistic scenario, which was not necessarily a representation of the best financial reduction but had a much larger probability of being implemented. Figure 6A illustrates the realistic pressure requirements of each shaft and 6B illustrates the resulting energy consumption change. The alignment between the two pressure-requirement profiles of the two shafts was isolated and illustrated by the vertical rectangular segments.
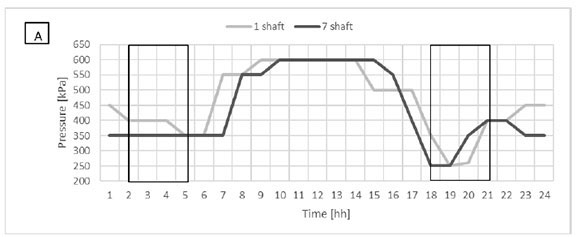
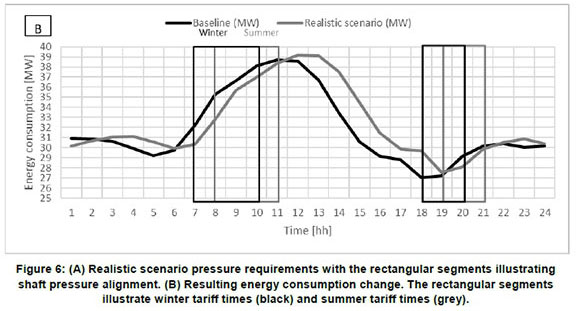
An irregular occurrence could, however, be seen during the morning. The #7 and #1 shaft-drilling shifts started at 07:00 and 05:00, respectively. As previously discussed, #1 shaft was the larger of the two. The only component dependent on both these shafts' schedules were the compressors, but they were adjusted to supply to #1 shaft as the primary user of compressed air. The energy consumption profile in Figure 6B illustrates only a slight change between the baseline graph and the realistic scenario. The energy consumption represents the forward adjustment of #7 shaft by three hours and #1 shaft by one hour. The schedule of #7 shaft closely represented the schedule of #1 shaft. The matching between the shafts was also apparent from the resulting new pressure requirements illustrated in Figure 6A. Table 3 indicates the schedule adjustment effects. A comparison of Tables 2 and 3, as well as of Figures 5 and 6B, shows that the differences in schedule at both shafts are less pronounced. Table 3 indicates only a one-hour schedule difference at #1 shaft when compared to the old schedule and a three-hour difference when comparing the old and new schedules at #7 shaft. Both the drilling and afternoon shifts start earlier, meaning more daylight for drilling-shift workers and getting out of the mine earlier for afternoon-shift workers.
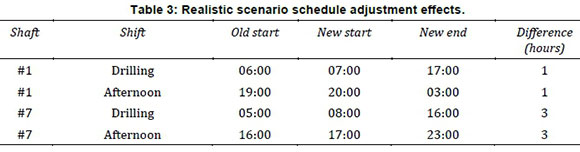
Figure 6A shows that during the morning no substantial adjustment was made regarding morning peak TOU tariff times, whereas the evening energy consumption experienced an adjustment and a decrease during the evening peak TOU tariff times. However, no substantial changes were made on the peak TOU zones and in comparison with the baseline energy consumption. The proposed adjusted schedule at #7 shaft related closely to the schedule of #1 shaft, illustrating that the implementation of the proposed adjustment schedule was possible.
3.3 Possible improvement simulation
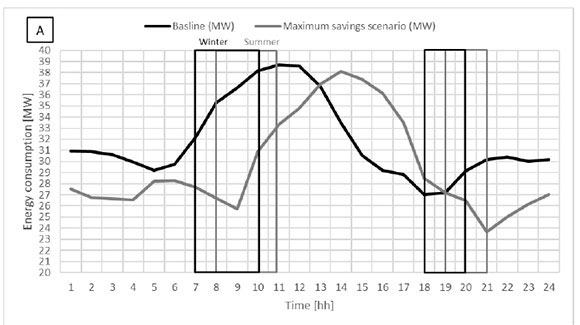
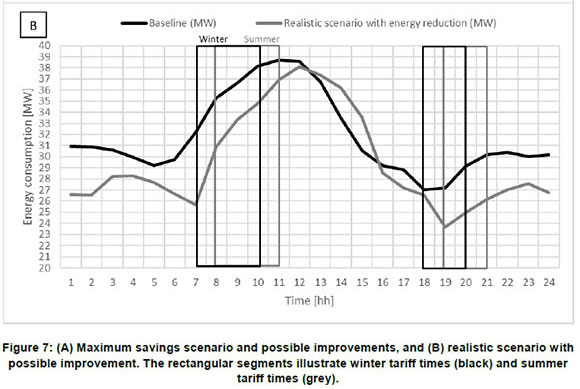
The purpose of the schedule adjustment was ultimately to align the power demand, leading to a potential reduction in energy consumption during low-demand times. This reduction of the energy consumption of a component was simulated using past reductions implemented in numerous studies [10, 16, 21, 29, 41], as indicated in Table 1. The total energy consumption was then again calculated using the reduced energy consumptions. Figure 7A describes the maximum savings scenario in combination with the energy reduction possible, as per the newly proposed schedules. Figure 7A illustrates a reduction mainly during peak morning TOU tariff times and, during the evening. The same reductions were implemented in the realistic scenario. The nature of the schedule alignment was consistent with the requirements for the simulation of potential reductions. Figure 7B illustrates an apparent reduction in energy consumption during the morning and evening peak TOU tariff times. The energy consumption also reduces on average.
3.3 Financial effect
Table 4 shows the financial implication of the proposed schedule adjustments. The initial financial impact of only applying the proposed schedule adjustments was noted. The total system energy consumption cost regarding these two sub-systems was estimated. It was determined to be approximately ZAR160 million per annum, with specific regards to weekdays. The maximum savings scenario experienced a ZAR2.1 million financial cost reduction. The realistic scenario led to a ZAR1.1 million cost reduction. The primary purpose of this study was to analyse a mining system in its entirety with regards to integrated load management. The evaluation concludes with a financial analysis to illustrate the effect of different proposed integrated load management simulations. Possible energy consumption reductions were estimated and led to a ZAR12.2 million cost reduction when applying the realistic scenario. The ZAR13.5 million cost reduction was determined for the maximum savings scenario.
4. Discussion
The present study showed that the potential exists for cost reductions on the mine based purely on the TOU tariffs. Current operations at the mine cause some systems to peak or increase during peak TOU tariff times. This increase in power consumption during peak TOU times could mainly be attributed to the compressors studied at the mine. High demand times were found during both peak TOU tariff time ranges. The schedules of shafts do not always make it possible to decrease the energy consumption during peak TOU times. The differing schedules cause difficulties when implementing improvement projects. Regarding the TOU tariffs, it was found that moving only the shifts of different shafts to a more appropriate time had positive results. The aim was, however, also to align the schedules to the times on the mine, where the demand was the least possible. The low power consumption times also correlate with the air demand. The compressors were also found to be the most important and largest consumers. The compressor power demand was related to the air pressure requirement. The air pressure requirement was in turn connected to the mining operational schedule. When aligning schedules from different subsystems, the effect of the peak TOU tariffs was maximised. The maximum cost reduction was found where the two shafts' blasting shifts were aligned. The blasting shift describes a time when little happens on a mine, as it is dangerous for personnel to be underground. This meant that all the systems experiencing a power consumption minimum during this time would be affected by the schedule change. The same can be said about the end of an evening shift when personnel are exiting the mine. A gap forms between evening shift and the next drilling shift. Initially, the schedules of the two shafts on the ring varied considerably. The #7 shaft had a blasting shift from 13:00 to 15:00, while #1 shaft had a blasting shift from 17:00 to 19:00. The schedule inconsistency indicated a four-hour difference. The realistic scenario illustrated a proposed schedule change, which was more realistic and possible to implement. The consumption reductions that were estimated were not definitive. These reductions are dependent on the implementation of multiple energy efficiency projects. Throughout the study, the compressors were found to be the most significant energy consumers, consuming 55% of the total power demand of the mining system. Compressor demand during non-drilling shift times is mainly dependent on the efficiency with which air is used. During a blasting shift, the air demand is dependent on the ability with which air consumption can be reduced by operation of the shafts. The compressor control can only be adjusted or further improved based on the shafts' demand. Chatterjee et al. illustrated the effect of mine schedules on ventilation demand [10]. Ventilation fan usage was considered in an integrated fashion. Badenhorst et al. [33] illustrated the effect of downtime and changed schedules in rock hoist optimisation, including the scope to integrate with demand side management. Peach et al. and Booysen et al. respectively illustrated the improvement of control philosophies in refrigeration [47] and compressed air systems [39]. The present study took this further by holistically analysing an underground mine regarding its power demand and operation schedule. An integrated load management solution was illustrated, which included all the energy consuming components on a typical underground platinum mine.
5. Conclusions
The primary purpose of this study was to analyse an entire mining system with regard to integrated load management. The study contributed to the analysis of mine utilities by peak time-of-use times, holisti-cally, considering the operation schedules of each shaft on the system and interconnectedness between shafts, systems and the utilities. The study illustrated the possible effects of integrating load management and changing operational schedules with the power demand and cost savings in the deep-level mining industry. Although the study lacked implementation, real-time data was used, and actual operational constraints were considered. This led to the development of a methodology with accompanying results which can be applied pre-implementation on typical deep-level mine energy saving projects. The methodology can, furthermore, be used to analyse operational constraints and illustrate potential changes with possible effects of said changes.
Author roles
William Shaw: Write-up, data collection, research formulation, analytical techniques
Marc Mathews: Write-up and research formulation, research strategy, illustration of problem clearly and concisely
Johan Marais: Technical correctness and applicability to industry, presentation of effect in mining industry
References
[1] Bellos, E. 2018. Sustainable energy development: How can the tension between energy security and energy transition be measured and managed in South Africa. Journal of Cleaner Production: 205: 738-753. DOI: https://doi.org/10.1016/j.jclepro.2018.08.196. [ Links ]
[2] Bohlmann, J. A. and Inglesi-lotz, R. 2018. Analysing the South African residential sector's energy profile. Renewable and Sustainable Energy Reviews 96: 240-252. DOI: https://doi.org/10.1016/j.rser.2018.07.052. [ Links ]
[3] Ntema, J., Marais, L., Cloete, J., and Lenka, M. 2017. Social disruption, mine closure and housing policy: evidence from the Free State Goldfields, South Africa. Natural Resources Forum 41: 30-41. DOI: https://dx.doi.org/10.1111/1477-8947.12117. [ Links ]
[4] De Kock, N. 2006. Researching the long-term impact of load management projects on South African Mines. M.Eng dissertation. North-West University, South Africa. Available at http://hdl.handle.net/10394/1674. [ Links ]
[5] Van Der Zee, L. 2015. Modelling of electricity cost risks and opportunities in the gold mining industry. Ph.D Thesis. North-West University, South Africa. Available at http://hdl.handle.net/10394/12267. [ Links ]
[6] Eskom. Tariffs & Charges 2019/2020, 2019. Available at http://www.eskom.co.za/CustomerCare/TariffsAndCharges/Documents/CompleteTariff2019web1.pdf. [ Links ]
[7] Amadi-echendu, J. and Bosaletsi, O. 2016. An empirical review of equipment replacement challenges in an electricity distribution network. Proceedings of the 2016 international conference on industrial engineering and operations management: 275-284. Available at http://ieomsociety.org/ieom_2016/pdfs/83.pdf. [ Links ]
[8] Montso, T. and Pretorius, J. 2017. Distribution network reliability enhancement through reliability based methodology: A case study in Soweto Eskom distribution. 2017 Australasian Universities Power Engineering Conference: 1-6. DOI: https://doi.org/10.1109/aupec.2017.8282488. [ Links ]
[9] Bredenkamp, J. I. G. 2016. An integrated energy management strategy for the deep-level gold mining industry. Ph.D thesis. North-West University, South Africa. Available at http://hdl.handle.net/10394/21256. [ Links ]
[10] Chatterjee, A., Zhang, L., and Xia, X. 2015. Optimization of mine ventilation fan speeds according to ventilation on demand and time of use tariff. Applied Energy 146: 65-73. DOI: http://dx.doi.org/10.1016/j.apenergy.2015.01.134. [ Links ]
[11] Joubert, H. P. R., Bolt, G., and Van Rensburg, J. F. 2012. Energy savings on mining compressed air networks through dedicated process plant compressors. 2012 Proceedings of the 9th conference on the industrial and commercial use of energy. 99-102. Available at http://www.scopus.com/inward/record.url?eid=2-s2.0-84869433473&partnerID=tZOtx3y1. [ Links ]
[12] Jeswiet, J. and Szekeres, A. 2016. Energy consumption in mining comminution. Procedia GRP. 48: 140-145. DOI: http://dx.doi.org/10.1016/j.procir.2016.03.250. [ Links ]
[13] Storm, M. E., Gouws, R., and Grobler, L. J. 2016. Measurement and verification of irrigation pumping DSM projects: application of novel methodology designs. Journal of Energy in Southern Africa 27(4): 15-24. DOI: https://doi.org/10.17159/2413-3051/2016/v27i4a1647. [ Links ]
[14] Mohamed, A. and Khan, M. T. 2009. A review of electrical energy management techniques: supply and consumer side (industries). Journal of Energy in Southern Africa 20(3): 14-21. DOI: https://doi.org/10.17159/2413-3051/2009/v20i3a3304 [ Links ]
[15] Liebenberg, L., Velleman, D., and Booysen, W. 2012. A simple demand-side management solution for a typical compressed-air system at a South African gold mine. Journal of Energy in Southern Africa. 23(2): 20-29. Available at http://www.scopus.com/inward/record.url?eid=2-s2.0-84903939443&partnerID=tZOtx3y1. [ Links ]
[16] Stols, J., Groenewald, H., and Van Rensburg, J. 2016. Quantifying the effects of system constraint improvements on the electricity cost of dewatering pumps. 2016 International conference on the industrial and commercial use of energy: 123-127. Available at http://ieeexplore.ieee.org/stamp/stamp.jsp?tp=&arnumber=7605626&isnumber=7605604. [ Links ]
[17] Duvenhage, D. F., Kleingeld, M., and Schutte, A. 2016. Integration of DSM interventions into bulk water supply strategies. 2016 International conference on the industrial and commercial use of energy: 2-8. Available at http://ieeexplore.ieee.org/stamp/stamp.jsp?tp=&arnumber=7605608&isnumber=7605604. [ Links ]
[18] Schoeman, W., van Rensburg, J., and Bolt, G. 2011. Cost-effective methods for automisation of a mine pumping systems to realise energy cost savings. 2011 Proceedings of the 8th conference on the industrial and commercial use of energy: 111-115. Available at http://ieeexplore.ieee.org.nwulib.nwu.ac.za/stamp/stamp.jsp?tp=&arnumber=6033093&isnumber=6033066. [ Links ]
[19] Mathews, E. and den Boef, M. 2005. Implementation of DSM strategies at the Kopanang Mine. Journal of Energy in Southern Africa 16(2): 32-37. DOI: http://dx.doi.org/10.17159/2413-3051/2005/v16i2a3185. [ Links ]
[20] Rautenbach, W., Krueger, D., and Mathews, E. 2005. Reducing the electricity cost of a three-pipe water pumping system: A case study using software. Journal of Energy in Southern Africa 16(4): 41-47. DOI https://doi.org/10.17159/2413-3051/2005/v16i4a3080. [ Links ]
[21] Kleingeld, M., Vosloo, J., and Swanepoel, J. 2011. The effect of peak load shift to off-peak periods on pumping systems. 2011 Proceedings of the 8th conference on the industrial and commercial use of energy: 82-87. Available at http://ieeexplore.ieee.org/xpls/abs_all.jsp?arnumber=6033088. [ Links ]
[22] Vosloo, J., Liebenberg, L., and Velleman, D. 2012. Case study: Energy savings for a deep-mine water reticulation system. Applied Energy 92: 328-335. DOI: http://dx.doi.org/10.1016/j.apenergy.2011.10.024. [ Links ]
[23] Roux, D. 2012. Energy recovery from incoming high pressure cold water in deep level mines. 2012 Proceedings of the 9th industrial and commercial use of energy conference: 1-5. Available at http://ieeexplore.ieee.org/stamp/stamp.jsp?tp=&arnumber=6330153&isnumber=6330131. [ Links ]
[24] Babu, V. R., Maity, T., and Burman, S. 2016. Optimization of energy use for mine ventilation fan with variable speed drive. 2016 International conference on intelligent control power and instrumentation 148-151. DOI: http://dx.doi.org/10.1109/ICICPI.2016.7859692. [ Links ]
[25] Millar, D., Levesque, M., and Hardcastle, S. 2017. Leakage and air flow resistance in mine auxiliary ventilation ducts: Effects on system performance and cost. Mining Technology 126(1): 10-22. DOI: http://dx.doi.org/10.1080/14749009.2016.1199182. [ Links ]
[26] De Souza, E. 2015. Improving the energy efficiency of mine fan assemblages. Applied Thermal Engineering 90: 1092-1097. DOI: http://dx.doi.org/10.1016/j.applthermaleng.2015.04.048. [ Links ]
[27] Panigrahi, D. C. and Mishra, D. P. 2014. CFD simulation for the selection of an appropriate blade profile for improving energy effieincy in axial flow mine ventilation fans. Journal of Sustainable Mining 13(1): 15-21. DOI: http://dx.doi.org/10.7424/jsm140104. [ Links ]
[28] Hovgaard, T. G., Larsen, L. F. S., Edlund, K., and Jorgensen, J. B. 2012. Model predictive control technologies for efficient and flexible power consumption in refrigeration systems. Energy 44(1): 105-116. DOI: http://dx.doi.org/10.1016/j.energy.2011.12.007. [ Links ]
[29] Moropa, T. S., Marais, J. H., and Schutte, A. J. 2017. Cost and energy savings on closed and semi-closed loop mine surface cooling systems. 2017 International conference on the industrial and commercial use of energy: 1-6. DOI: http://dx.doi.org/10.23919/ICUE.2017.8068001. [ Links ]
[30] Mare, P., Kriel, C. J. R., and Marais, J. H. 2016. Energy efficiency improvements through the integration of underground mine water reticulation and cooling systems. 2016 International conference on the industrial and commercial use of energy: 112-117. DOI: https://doi.org/10.1109/icue.2014.6904189. [ Links ]
[31] Badenhorst, W., Zhang, J., and Xia, X. 2010. An MPC approach to deep level mine rock winder hoist control. 1st IFAC Conference on control methodologies and technology for energy efficiency: 249-254. DOI: http://dx.doi.org/10.3182/20100329-3-PT-3006.00046. [ Links ]
[32] Mathews, E. H., Kleingeld, M., Bosman, P. H., and Vosloo, J. C. 2007. Control of a rock winder system to optimise electricity costs. Energize (June): 66-69. Available at http://www.ee.co.za/wp-content/uploads/legacy/ATICUE.pdf. [ Links ]
[33] Badenhorst, W., Zhang, J., and Xia, X. 2011. Optimal hoist scheduling of a deep level mine twin rock winder system for demand side management. Electric Power Systems Research. 81(5): 1088-1095. DOI: http://dx.doi.org/10.1016/j.epsr.2010.12.011. [ Links ]
[34] Bosman, A. 2006. Investigating load shift and energy efficiency of new technology loco battery chargers. M.Eng dissertation. North-West University, South Africa. Available at http://hdl.handle.net/10394/1057. [ Links ]
[35] Zhang, S. and Mao, W. 2017. Energy efficiency optimization of coal conveying systems with consideration of crushers. Energy Procedia 105: 3253-3261. DOI: https://doi.org/10.1016/j.egypro.2017.03.729. [ Links ]
[36] Zhang, S. and Xia, X. 2010. Optimal control of operation efficiency of belt conveyor systems. Applied Energy 87(6): 1929-1937. DOI: http://dx.doi.org/10.1016/j.apenergy.2010.01.006. [ Links ]
[37] Numbi, B. P., Zhang, J., and Xia, X. 2014. Optimal energy management for a jaw crushing process in deep mines. Energy 68: 337-348. DOI: http://dx.doi.org/10.1016/j.energy.2014.02.100. [ Links ]
[38] Vittorini, D. and Cipollone, R. 2016. Energy saving potential in existing industrial compressors. Energy 102: 502515. Available at http://dx.doi.org/10.1016/j.energy.2016.02.115. [ Links ]
[39] Booysen, W., Kleingeld, M., and van Rensburg, J. F. 2009. Optimising compressor control strategies for maximum energy savings. Energize 32(120): 65-68. Available at http://www.nlsa.ac.za/NLSA/index.html. [ Links ]
[40] Van Tonder, A. J. M., Marais, J. H., and Bolt, G. D. 2014. Practical considerations in energy efficient compressor set-point control strategies. 2014 International Conference on the eleventh Industrial and Commercial use of energy: 1-4. DOI: https://doi.org/10.1109/icue.2014.6904191. [ Links ]
[41] Pascoe, B., Groenewald, H. J., and Kleingeld, M. 2017. Improving mine compressed air network efficiency through demand and supply control. 2017 International Conference on the Industrial and Commercial Use of Energy: 1-5. DOI: http://dx.doi.org/10.23919/ICUE.2017.8067992. [ Links ]
[42] Van Staden, H. J., Bredenkamp, J. I. G., and Marais, J. H. 2017. Improving sustainability of previously implemented energy savings strategies on mine compressed air systems. 2017 International Conference on the Industrial and Commercial Use of Energy: 1-6. DOI: http://dx.doi.org/10.23919/ICUE.2017.8067994. [ Links ]
[43] Segopolo, P. R. 2015. Optimization of shuttle car utilization at an underground coal mine. Journal of the Southern African Institute of Mining and Metallurgy 115(4): 285-296. DOI: https://doi.org/10.17159/2411-9717/2015/v115n4a4. [ Links ]
[44] Buthelezi, M. A. 2009. Load shift through optimal control of complex underground rock winders. M.Eng dissertation. North-West University, South Africa. Available at http://hdl.handle.net/10394/4702. [ Links ]
[45] Jonker, J., Joubert, H. P. R., and Brand, H. G. 2017. Dynamic control on compressed air supply for sustainable energy savings. Proceedings of the 14th Conference of Industrial and Commercial Use of Energy: 1-6. Available at http://ieeexplore.ieee.org/document/8067984/. [ Links ]
[46] Brand, H. G., Bolt, G. D., and Pelzer, R. 2012. Strategic placement of compressors for future mine developments. 2012 Proceedings of the 9th Industrial and Commercial Use of Energy Conference: 1-5. Available at http://ieeexplore.ieee.org/stamp/stamp.jsp?tp=&arnumber=6330149&isnumber=6330131. [ Links ]
[47] Peach, P., Kleingeld, M., and Bredenkamp, J. 2017. Optimising deep - level mine refrigeration control for sustainable cost savings. 2017 International Conference on the Industrial and Commercial Use of Energy: 1-8. DOI: http://dx.doi.org/10.23919/ICUE.2017.8068000. [ Links ]
[48] Van Heerden, S. W., Pelzer, R., and Marais, J. H. 2014. Developing a dynamic control system for mine compressed air networks. Proceedings of the Conference on the Industrial and Commercial Use of Energy: 1-8. DOI: http://dx.doi.org/10.1109/ICUE.2014.6904190. [ Links ]
[49] Schmidt, C. and Kissock, K. 2005. Modeling and simulation of air compressor energy use. American Council for an Energy-Efficieny Economy: 131-142. 1: Available at http://academic.udayton.edu/kissock/http/publications/airsim_aceee2005.pdf [ Links ]
* Corresponding author: +27 (0)767409410; email: wgshaw.120@gmail.com

