


Services on Demand
Article
 English (pdf)
 Article in xml format
 Article references
Indicators

Related links
-
 Cited by Google
 -
 Similars in Google
Share

 Permalink
Journal of Energy in Southern Africa
On-line version ISSN 2413-3051
Print version ISSN 1021-447X
J. energy South. Afr. vol.30 n.4 Cape Town Nov. 2019
http://dx.doi.org/10.17159/2413-3051/2019/v30i4a5694
A statistical exploration of interval-deficient wind speed data for application to wind power assessments
F. LubbeI, *; T. HarmsI; J. MaritzII
IDepartment of Mechanical and Mechatronic Engineering, Stellenbosch University, Private Bag X1, Matieland 7602, Stellenbosch, South Africa. F. Lubbe: https://orcid.org/0000-0003-2859-8879; T. Harms: https://orcid.org/0000-0001-8023-3194
IIDepartment of Engineering Sciences, University of the Free State, P. O. Box 339, Bloemfontein 9300, South Africa. J. Maritz: https://orcid.org/0000-0003-4054-171X
ABSTRACT
Gathering quality wind speed data can be time-consuming and expensive. The present study established whether interval-deficient wind speed data could be rendered useful for wind power assessments. The effect of interval deficiency on the quality of the wind speed data was investigated by studying the behaviour of the Weibull scale and shape factors as the interval size between wind speed measurements increased. Five wind speed data sets obtained from the Southern African Universities Radiometric Network (Sauran) were analysed, based on a proposed procedure to find the true Weibull parameters from an interval-deficient wind speed data set. It was found that the relative errors in the Weibull parameters were, on average, less than 1%, compared with the Weibull parameters computed from a wind speed data set that complies with the IEC 61400-12-1:2005(E) standard. This finding may contribute to time and cost reduction in wind power assessments. It may also promote the application of statistical methods in the renewable energy sector.
Highlights
• Sauran data is used to test whether interval-deficient wind data is useful for wind power assessments.
• Simulated interval-deficient wind speed datasets provide for better insight into the behaviour of Weibull parameters as interval size is increased.
• A proposed statistical procedure was used to render interval-deficient wind data useful.
Keywords: cost reduction, renewable resource modelling, Sauran, Weibull distribution
1. Introduction
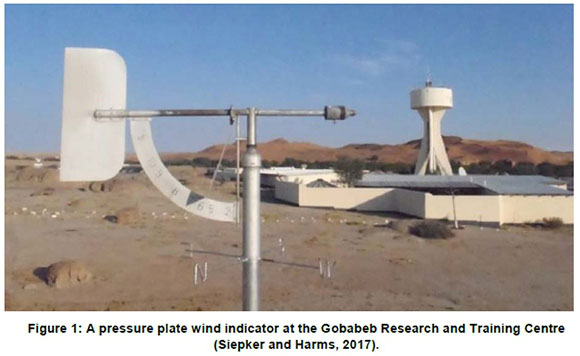
A recent comparative data study by Siepker and Harms (2017) in the Department of Mechanical and Mechatronic Engineering at Stellenbosch University has revealed that interval-deficient wind speed data that has been artificially synthesised can still provide meaningful information for wind power assessments. The IEC 61400-12-1:2005(E) standard of the International Electrotechnical Commission sets the requirements for wind speed measurements intended to be used in the power performance evaluation of wind turbines. It states that wind speed data must be acquired continuously at a sampling rate of 1 Hz and that means, standard deviations, minima and maxima must be averaged and stored by a data acquisition system every ten minutes (Siepker and Harms, 2017). Wind data that does not adhere to this standard is referred to as interval-deficient. Wind data sets that are acquired intermittently or continuously through mechanical anemometers with human interaction, or by using a data acquisition system served by anemometers that are not cup type (or incorrectly mounted), are also considered to be deficient. Empirical evidence by Siepker and Harms has shown that interval-deficient wind data may still be useful in wind energy applications. There is a need, however, to delve deeper into the behaviour of interval-deficient wind data and to find a procedure to estimate the true Weibull parameters from an interval-deficient data set. Wind data sets of poor quality could be rendered useful if the applicability of interval-deficient wind data can be confirmed. As extensive funding goes into the development of a wind farm, it is important to have a reliable understanding of the wind resource at a given site at a given time. Investors seek bankable results from viability studies before committing funds to wind energy projects. By investigating the relationship between the behaviour of the Weibull parameters and the sample size of the wind speed data set, a better understanding of the wind resource could be achieved. In some cases, interval-deficient data sets already exist for the specific location where a wind farm is planned. An example of this is the wind data measurements that have been made at the Gobabeb Research and Training Centre in Gobabeb, Namibia, since the 1940s. These data sets were acquired using mechanical devices such as a pressure plate wind indicator as shown in Figure 1, which is non-compliant to the IEC 61400-12-1:2005(E) standard. It would be useful to have some statistical backing for using this interval-deficient wind data for wind power assessments.
Considering this, the objective of the present study was to present a statistical basis for the assertion that sparse wind data, e.g., from pre-digital, historic, or otherwise deficient collections, may have more value than generally thought. The approach used was, therefore, considered a further step to possibly unlock value from decades of already existing recorded wind data, which may, however, not comply with the latest international wind data measurement standards.
1.1 Southern African Universities Radiometric Network
Proper long-term solar radiation measurements are necessary to fully harness the exceptional solar resource in southern Africa. For many years there has been no coordinated deployment of high-quality ground measurement stations in southern Africa (Brooks et al., 2015 - the source of much information in this paragraph). Such a network is of crucial importance to obtain an integrated solar resource assessment. Satellite models can be used to assess the solar resource, but ground measurement stations provide much higher accuracy (Brooks et al., 2015). The Southern African Universities Radiometric Network (Sauran) was established through the initiative of the Centre for Renewable and Sustainable Energy Studies, Stellenbosch University and the Group for Solar Energy Thermodynamics at the University of KwaZulu-Natal. The aim of this integrated network of weather stations is to provide long-term solar radiation data for the deployment of solar energy technologies. The weather stations in the Sauran network can measure - besides solar radiation - air temperature, relative humidity, barometric pressure, rainfall and wind speed and direction. For quality control purposes, Sauran data includes flags that are triggered whenever the time interval between successive measurements does not equal one minute. These flags are included as a '1' in the data file and are intended to warn the user about anomalies in the data set. The Sauran weather stations have research-grade secondary standard thermopile radiometers and the instrumentation used to measure and record meteorological data, such as wind speed, is also of high quality. Instrumentation is properly maintained and cleaned regularly by staff from partner universities, and all Sauran stations are secured and powered by photovoltaic systems. This ensures continuity of operation. The first phase of Sauran includes weather stations at ten sites situated in a diverse range of climates, from desert to coastal sub-tropical. Further phases in the development of this network expanded its reach to cover more regions across southern Africa. As of 2019 Sauran weather stations are located in South Africa, Namibia and Botswana. Data is provided at one-minute averaged intervals as well as hourly and daily time-averaged intervals. The wind data from the Sauran weather stations can be considered to comply with the IEC 61400-12-1:2005(E) standard. The data obtained through the Sauran weather stations resides on the University of KwaZulu-Natal research server cluster and is freely available to the public at www.sauran.ac.za.
Although the website does not offer real-time data, time lags are usually less than ten hours. Another valuable resource of wind speed data is the Wind Atlas of South Africa (WASA) (Mortensen et al., 2014). WASA already yields high-level power densities and, therefore, the research described in this study made use of wind data from five Sauran weather stations, selected to provide a variety of geographical locations across southern Africa. The weather stations are: University of KwaZulu-Natal Howard College, USAid Namibian University of Science and Technology, GIZ Richtersveld, GIZ University of the Free State, and USAid Venda.
1.2 The Weibull distribution
Weibull (1951) stated that the Weibull distribution may sometimes render good service. After years of experimentation and application, it became clear that the Weibull distribution had indeed a wide range of applications, especially in the aerospace industry (Abernethy, 1983). Justus et al. (1976) found that the Weibull distribution also gives the best description of the distribution of wind speed and their study focused on the wind resources at 135 sites across the United States of America. Although the Weibull distribution is commonly used in the wind energy sector, Drobinski and Coulais (2012) questioned whether it is the most suitable, given that it is based on empirical rather than theoretical justification. This might lead to limitations in its application to wind speed data, where it was shown that, in some locations that have a very high wind potential and wind anisotropy, the Weibull distribution could lead to a systematic underestimation of wind power of up to 12% (Drobinski and Coulais, 2012). Wind anisotropy refers to the phenomenon where the wind speed differs significantly in different directions. This phenomenon comes into play when modelling the wind speed components rather than the wind speed itself. The direction of the wind in the present study was not considered since wind turbine nacelles can rotate to face directly into the wind. With regards to the limits in application of the Weibull distribution:
The objection has been stated that this distribution function has no theoretical basis. But in so far as the author understands, there are - with very few exceptions - the same objections against all other DF (density functions), applied to real populations from natural or biological fields, at least in so far as the theoretical basis has anything to do with the population in question. Furthermore, it is utterly hopeless to expect a theoretical basis for distribution functions of random variables. (Henderson and Cowles, 1970).
Drobinski and Coulais (2012) found that a combination of Rayleigh and Rice distributions gives excellent results for the modelling of wind speed and that the Weibull distribution is a convenient and powerful approach to modelling wind speed data. This study assumed that the Weibull distribution is best for the modelling of wind speed for wind power evaluation. It is, therefore, noted that extreme wind speed will not be considered, which would necessitate a different approach (Seguro and Lambert, 2000).
Weibull (1951) defined the Weibull distribution function as a cumulative distribution function (CDF). The Weibull PDF is obtained by taking the first derivative of the Weibull CDF. If X is the variable describing all the individuals in a population, a distribution function for the individuals can be expressed by Equation 1 (Weibull, 1951).

where χ specifies the value of any individual in a sample and the only necessary conditions the function needs to adhere to are to be positive, non-decreasing and vanishing at the value x0. The simplest function satisfying these conditions is given by Equation 2 (Weibull, 1951).
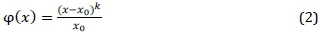
where x0 Φ 0 and k is the Weibull shape parameter. Substituting Equation 2 into Equation 1 gives Equation 3, the Weibull cumulative distribution function.
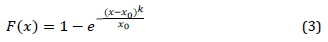
Experimental evidence showed that this mathematical expression fits observations (Weibull, 1951). By differentiating Equation 3 with respect to x, the Weibull probability density function is given by Equation 4 (Siepker and Harms, 2017).
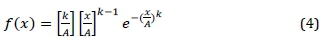
where A is the scale parameter.
Justus et al. (1976) found that more accurate estimates can be achieved by also considering the variance of the wind speed about the mean. Before this, estimates of wind power potential were based only on the mean wind speed at a specific location. The Weibull scale factor is closely related to the mean wind speed and the shape factor is inversely related to the variance of the wind speed (Justus et al., 1976). By studying the behaviour of the scale and shape factors, more accurate estimates for wind power potential can, therefore, be achieved. This behaviour was studied by considering wind speed data acquired through Sauran as well as from Stel-lenbosch University's Sonbesie weather station.
2. Methodology
The behaviour of the parameters A and k of the Weibull PDF was observed while the sample size of wind speed data was decreased. This was done experimentally in Matlab. It was important to consider the autocorrelated nature of the wind data because the derivation of the maximum likelihood method, which was used to compute the estimates of the Weibull parameters, assumes that the data points are independent from each other (Ramirez and Carta, 2005). However, in their study of hourly wind speeds over a six-year period in the Canarian Archipelago, Ramirez and Carta (2005) found that the use of autocorrelated data does not significantly affect the shape of the Weibull probability density function. The data analysis for this study therefore proceeded with the autocorrelated wind speed data, using the fitdist function in Matlab to create a Weibull distribution object from which the Weibull scale and shape parameters were extracted. This Matlab function uses the maximum likelihood method to find the estimates of the Weibull parameters. This method was chosen based on Seguro and Lambert (2000), who compared methods for calculating Weibull parameters and found that the maximum likelihood method gives the most accurate results on time-series data when compared with known Weibull parameters. Furthermore, in contrast to the so-called 'graphical method' of finding the Weibull parameters, the maximum likelihood method is an iterative method, which makes it more suitable for computer-based analysis. It is also more robust than the graphical method since it is less severely affected by external factors such as the bin size of the frequency distribution (Seguro and Lambert, 2000). Finally, according to Scholz (2008), the maximum likelihood method has minimal variance.
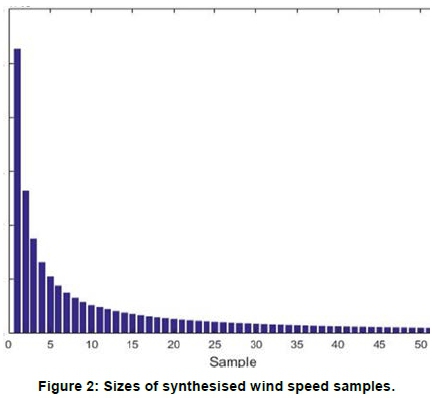
The present study considered wind data for 2016, where the first entry in the data set was at 12:00:00 AM, 01 January and the last entry at 11:59:00 PM, 31 December. The first data set, obtained from the Stellenbosch University Sonbesie weather station, had averaging intervals of one minute. Starting with the wind speed data set at one-minute averaging intervals, entries within the data set were deleted to synthesise new data sets that had larger intervals between successive wind speed measurements. Even though entries within the data set were deleted, the resulting new sets were still spread out over the year to include measurements stretching from January 1 to December 31. Figure 2 shows the decline in sample size (only samples 1 to 54 are indicated, but the trend in decline continued until sample 720).
The Weibull parameters were calculated for each data set and a scatter plot for each parameter, as a function of the interval deficiency of the data set, was drawn. The idea was to determine the point at which the Weibull parameters started to deviate significantly from standard behaviour. This would be the point at which the intervals between successive wind speed measurements became excessively enlarged. To further observe the behaviour of the Weibull parameters, the same analysis was done on five data sets obtained from the Sauran weather stations. Similar to the data from the Sonbesie weather station, the first entry in the data set was at 12:00:00 AM, 01 January 2016 and the last entry at 11:59:00 PM, 31 December 2016. For each weather station, the wind speed data set was used to synthe-sise more data sets with increasing measurement interval. This was done in the same way as for the Stellenbosch University Sonbesie data. The Weibull parameters were calculated for each data set at each measurement station and plotted against interval size.
3. Results and discussion
Observed behaviour of the Weibull parameters
Figures 3 and 4 are the scatter plots of the Weibull parameters, A and k, as a function of interval size.
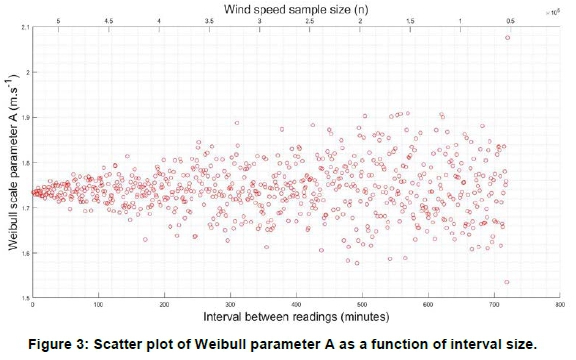
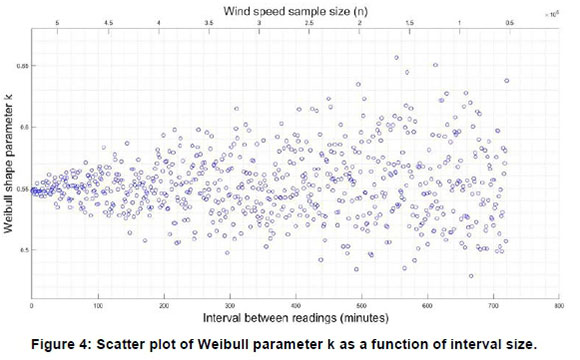
From Figures 3 and 4 both parameters, A and k, spread out evenly below and above the first parameter value as the intervals in the data sets become larger. This suggests that the Weibull parameters could follow a normal distribution. Figures 5 and 6 show that this is indeed the case. Even as the interval size between wind speed measurements is increased, the Weibull parameters are still normally distributed about the population mean.
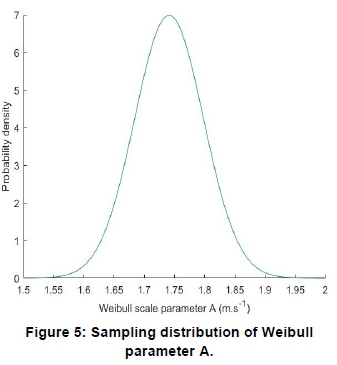
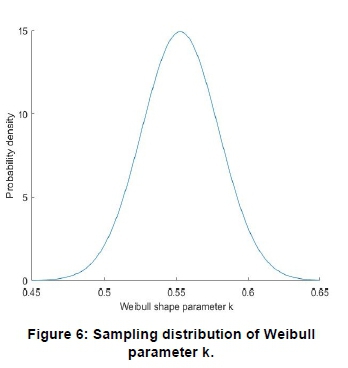
The normal distribution of the Weibull parameters, as shown in Figures 5 and 6 is considered in more detail. For this study:
• the population under consideration is the wind speed at a specific location;
• the mean of the population, μ, has a fixed value (Underhill and Bradfield, 2013);
• a sample would be wind speeds obtained at a specific sampling interval (one minute to 720 minutes) and its corresponding Weibull parameters;
• the sample mean, x, is not random since the wind speeds are autocorrelated; and
• a sampling distribution is a probability distribution of a statistic (Underhill and Bradfield, 2013).
Figures 5 and 6 show that the sampling distributions of the Weibull scale and shape parameters were normal, even though the scale and shape parameters were derived from a Weibull distributed population (wind speed). This can be explained by the central limit theorem, which states that:
If χ is the mean of a random sample of size n taken from a population with mean μ and finite variance σ2, then the limiting form of the distribution of

as n - > oo, is a normal distribution (Walpole et al. 2016).
Therefore, the sample mean has a normal distribution. According to Underhill and Bradfield (2013), the sample mean will have a normal distribution regardless of whether the population from which the sample has been extracted has a normal distribution or not. Underhill and Bradfield (2013) furthermore stated that it can be shown that the sample mean χ of a sample of η observations from a population with mean μ and variance σ2 has a mean of and a variance of  .
.
Since the Weibull scale parameter is closely related to the mean wind speed and the Weibull shape factor is inversely related to the variance of the wind speed (Justus et al., 1976), the Weibull parameters seem to obey the central limit theorem. The biggest problem with this assertion is that the wind speeds are autocorrelated and that the sample mean, x, is therefore not random. It seems, however, that the process of computing the Weibull parameters diminishes the influence of autocorrelation. This is in accordance with the finding by Ramirez and Carta (2005) that the autocorrelated nature of wind data does not significantly influence the shape of the Weibull distribution.
A robust statistic is largely resistant to errors in the result when there is a deviation in the underlying data set. In the present study, distributional robustness was of interest. According to Huber and Ronchetti (2009), distributional robustness manifests when the shape of the true underlying distribution deviates slightly from the assumed model. In the case of the present study, the reduction in the sample size of wind data measurements, by deleting elements within the data set, would lead to deviation in the assumed model. The assumed model in this case is the set of wind speed measurements taken at averaging intervals of one minute. From the empirical analysis of the wind speed data, the question arises: Why is the Weibull distribution so robust with regards to sample size? An attempt was made to answer this question by a theoretical approach.
It was shown that the calculated Weibull parameters follow a normal distribution (Figures 5 and 6) and that they seem to obey the central limit theorem. This is an important result that may open possibilities for better understanding the robustness of the Weibull parameters. By grouping the Weibull scale parameter plotted in Figure 3 into seven samples, and plotting the distribution of the parameter, the parameter remains normally distributed in each sample. This is illustrated in Figure 7. It should be noted that the sample size for each set of wind speed measurements, from which the Weibull parameters are calculated, decreases from left to right in Figure 3 as well as Figure 7. Each sample of Wei-bull scale parameters in Figure 8 therefore represents a median wind speed sample size, decreasing from left to right. The bottom part of Figure 8 gives the normal distributions for each sample of Weibull scale parameter. The location of one standard deviation above and below the mean is also indicated in red on each normal distribution. The normal distributions are rotated to better illustrate their relation to the plot of the Weibull scale parameter at the top of Figure 7. The median wind speed sample size is given as the heading of each normal distribution.
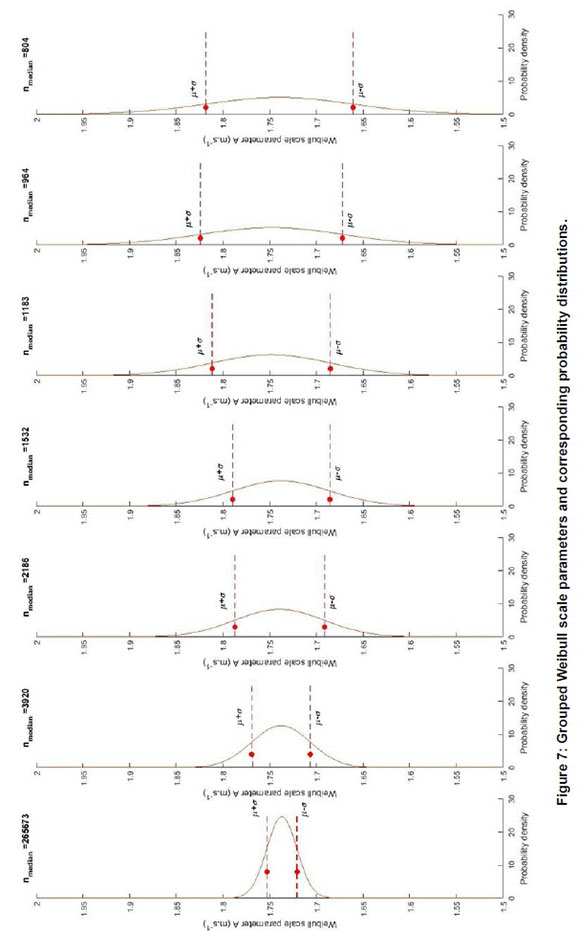
From the normal distributions in Figure 7, the standard deviation moves further away from the sample mean as the wind speed sample size is decreased. Since the sampling distribution of the Weibull parameters is normal, the average of the means of the Weibull parameter samples will be equal to the population mean. The variance in sample mean is given by  and the standard deviation in sample mean is thus given by std =
  . A small sample of wind speeds will therefore give a large variation in Weibull parameter means, while a large sample of wind speed measurements will give a smaller variation in Weibull parameter means. The behaviour of the standard deviation as a function of sample size, n, could, therefore, be a reasonable way to model the reaction of the Weibull parameters to interval deficiencies in the wind speed data.
3.2 Modelling the Weibull parameter behaviour
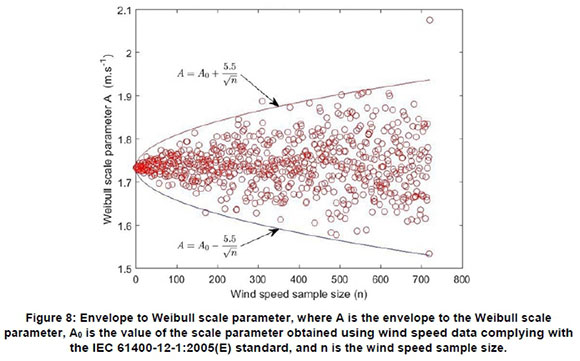
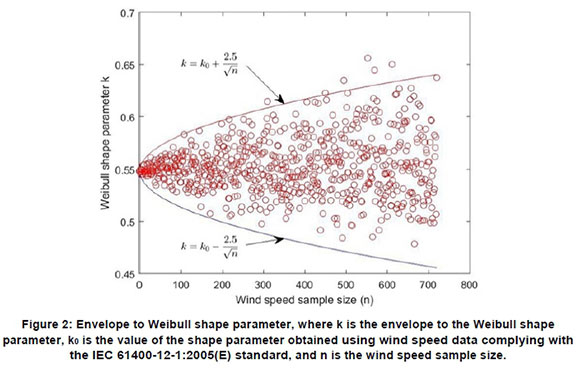
The behaviour of the Weibull parameters as a function of sample size was modelled by proposing equations that provide an envelope efficiently encapsulating all the Weibull parameters.
The behaviour of the Weibull parameters was modelled analogous to the equation for the standard deviation, but by incorporating arbitrary constants C and D in the respective Equations 5 and 6, given that the standard deviation may be an effective mechanism to model the behaviour of the Weibull scale and shape parameters as the wind speed sample size is decreased.
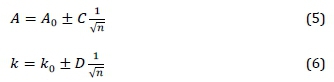
The constants should serve as scaling factors to account for the effect of the autocorrelation, while D also accounts for the effect that the value of parameter A has on the value of parameter k. The A0and k0are the values for the scale and shape parameters obtained using wind speed data complying with the IEC 61400-12-1:2005(E) standard. Figures 8 and 9 show the envelopes to the Weibull parameters created by plotting Equations 5 and 6. These envelopes serve to illustrate the symmetric behaviour of the Weibull parameters.
3.3 Algorithm for obtaining true values of the Weibull parameters
As the wind speed sample size is decreased by increasing the interval size between wind speed measurements, the computed Weibull parameters spread out evenly above and below a central value, i.e., the value of the Weibull parameter computed by using a data set that complies with the IEC 61400-12-1:2005(E) standard.
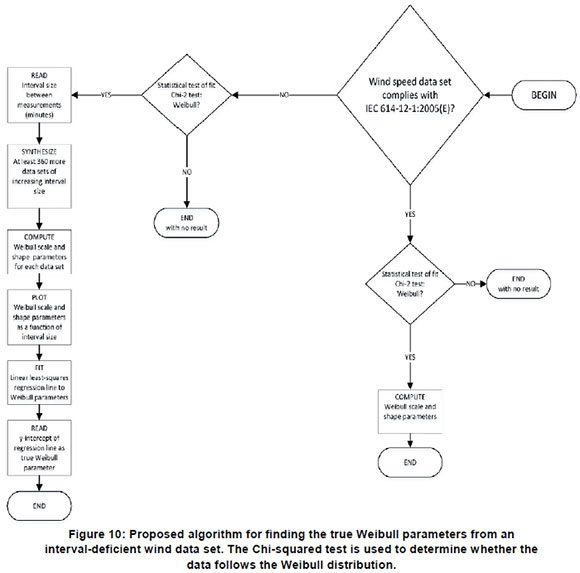
The symmetric behaviour of the Weibull parameters offers a way of determining valid Weibull parameters from an interval-deficient data set, consistent with the main objectives of this study. Figure 10 illustrates the proposed procedure representing an algorithm.
This algorithm was examined by analysing the wind speed data from five Sauran weather stations. The plots for the Weibull parameters from the University of KwaZulu-Natal Howard College (KZH) weather station data is shown in Figures 11 and 12.
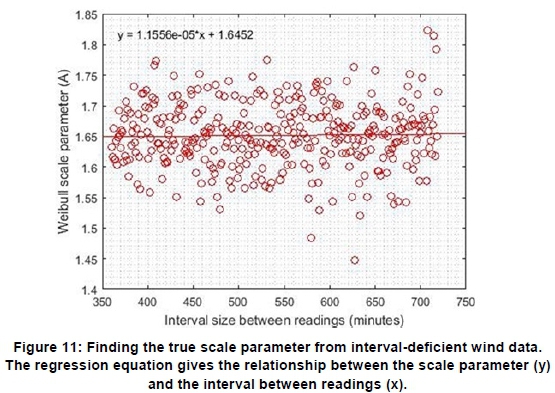
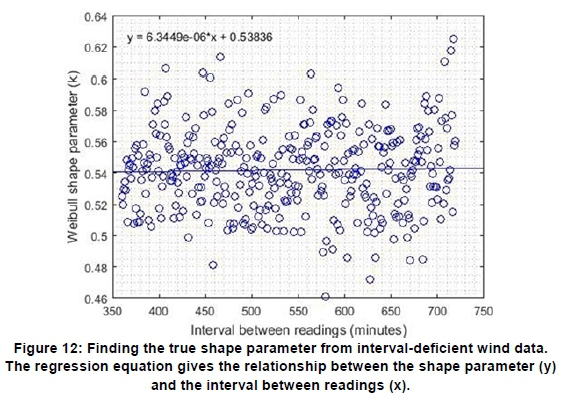
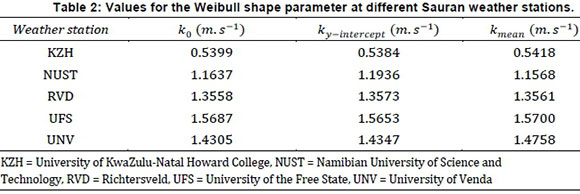
The y-intercepts in Figures 11 and 12 are respectively expressed as Ay_lntercept = 1.6452 m. s-1and ky-intercept = 0.5384 and the means are Amean = 1.5615 τη. s-1and kmean = 0.5418 m. s-1. The values for the estimated true Weibull scale and shape parameters of the wind speed at all of the five Sauran weather stations are summarised in Tables 1 and 2.
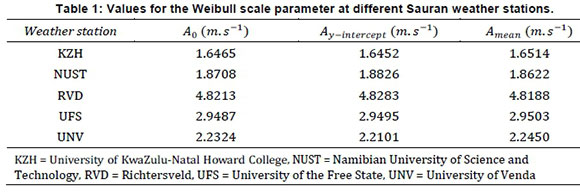
Ao is the value of the scale parameter computed by using a data set that complies with the IEC 61400-12-1:2005(E) standard, Ay-intercept is the scale parameter found from the y-intercept of the regression equation, and Amean is the mean of the scale parameters computed from all interval deficient data sets.
The relative error in the parameter estimates is compared with i40and k0in Table 3.
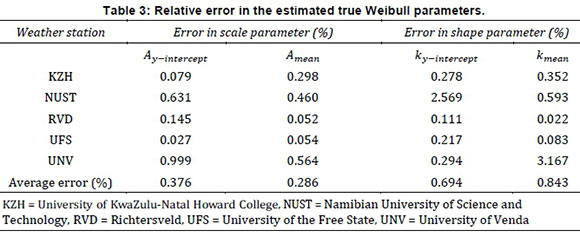
The procedure to determine the true values of the Weibull parameters from an interval-deficient wind speed data set, as presented in Figure 10, delivered encouraging results (Table 3). The procedure was based on the observed phenomenon that the Weibull parameters spread out evenly above and below a central value. It is due to this phenomenon that the y-intercept of a linear regression to the Weibull parameters, as a function of sample size, approximates the true values of the shape and scale parameters. It should be noted that an approximation of the true Weibull parameters was also obtained by taking the mean of the parameter values. From Table 3, the average error in both the scale and shape parameter is less than 1%. For finding the true scale parameter, computing the mean instead of taking the y-intercept resulted in a slightly smaller error in the parameter value. However, for calculating the shape parameter, the y-intercept of the regression line gave a more accurate parameter value. The reason behind the symmetric behaviour of the Weibull parameters has not been investigated in this study.
4. Conclusions
It was found that the sampling distributions of the Weibull parameters are normal and an attempt was made to explain this by using the central limit theo- rem. By analogy to the equations for the standard deviation, equations were proposed to model the extreme values of the Weibull parameters as the wind speed sample size is decreased. It was found that by scaling these equations by choosing appropriate values for their scaling constants, envelopes to the Weibull parameters are produced. These envelopes give some theoretical backing to the experimentally observed symmetric behaviour of the Weibull parameters. Based on this symmetric behaviour, a procedure was proposed to find the true Weibull parameters from an interval-deficient wind speed data set. This procedure was tested on wind speed data from five Sauran weather stations and it was found that the relative errors in the Weibull parameters were corroborated by the values computed from a wind data set that complies with the IEC 61400-12-1:2005(E) standard, were on average less than 1%.
Acknowledgements
The author acknowledges the editorial guidance of Dr Mokone J. Roberts, who made valuable contributions.
Author roles
F. Lubbe: Formulation and execution of research, data analysis and write-up
T. Harms: Research formulation and supervision
J. Maritz: Quality assurance and guidance in write-up
References
Abernethy, R.B. 1983. Weibull Analysis Handbook. Available at https://apps.dtic.mil/dtic/tr/fulltext/u2/a143100.pdf [Accessed November 6th, 2019]. [ Links ]
Brooks, M.J., du Clou, S., van Niekerk, J.L., Gauche, P., Leonard, C., Mouzouris, M.J., Meyer, A.J., van der Westhuizen, N., van Dyk, E. and Vorster, F.J. 2015. SAURAN: A new resource for solar radiometric data in Southern Africa. Journal of Energy in Southern Africa 26(1): 2-10. https://doi.org/10.17159/2413-3051/2015/v26i1a2208 [ Links ]
Drobinski, P. and Coulais, C. 2012. Is the Weibull distribution really suited for wind statistics modelling and wind power evaluation? arXiv e-prints. Available at https://arxiv.org/abs/1211.3853 [Accessed September 6th, 2019]. [ Links ]
Justus, C.G., Hargraves, W.R. and Yalcin, A. 1976. Nationwide assessment of potential output from wind-powered generators. Journal of Applied Meteorology 15(7): 673-678. https://doi.org/10.1175/1520-0450(1976)015<0673:naopof>2.0.co:2 [ Links ]
Mortensen, N., Hansen, J., Kelly, M., Prinsloo, E., Mabille, E. and Szewczuk, S. 2014. Wind atlas for South Africa (WASA). Department of Energy, Republic of South Africa. Available at http://www.wasapro-ject.info/docs/WASABooklet.pdf [Accessed November 6th, 2019]. [ Links ]
Ramirez, P. and Carta, J.A. 2005. Influence of the data sampling interval in the estimation of the parameters of the Weibull wind speed probability density distribution: a case study. Energy Conservation and Management 46: 2420-2438. https://doi.org/10.1016/j.enconman.2004.11.004 [ Links ]
Scholz, F. 2008. Inference for the Weibull distribution. Stat 498B Industrial Statistics. Available at http://www.stat.washington.edu/fritz/DATAFILES498B2008/WeibullBounds.pdf [Accessed September 6th, 2019]. [ Links ]
Seguro, J.V. and Lambert, T.W. 2000. Modern estimation of the parameters of the Weibull wind speed distribution for wind energy analysis. Journal of Wind Engineering and Industrial Aerodynamics 85(1): 7584. [ Links ]
Siepker, E.B.J. and Harms, T.M. 2017. On the potential value of interval deficient wind data. Journal of Wind Engineering and Industrial Aerodynamics 165: 100-114. https://doi.org/10.1016/i.iweia.2017.03.006 [ Links ]
Underhill, L. and Bradfield, D. 2013. Introstat textbook. Department of Statistical Sciences University of Cape Town. Available at https://open.uct.ac.za/bitstream/handle/11427/4150/INTROSTATebook.pdf?sequence=1 [Accessed 6th September 2019]. [ Links ]
Walpole, R.E., Myers, R.H., Myers, S.L. and Ye, K. 2016. Probability and statistics for engineers and scientists. Ninth edition. Boston, USA: Prentice Hall. [ Links ]
Weibull, W. 1951. A statistical distribution function of wide applicability. Journal of Applied Mechanics 18: 293-297. Available at https://pdfs.semanticscholar.org/88c3/7770028e7ed61180a34d6a837a9a4db3b264.pdf [Accessed 6th September 2019]. [ Links ]
* Corresponding author: +27 (0)65 837 3298; email: 16727509@sun.ac.za

