


Services on Demand
Article
 English (pdf)
 Article in xml format
 Article references
Indicators

Related links
-
 Cited by Google
 -
 Similars in Google
Share

 Permalink
Journal of Energy in Southern Africa
On-line version ISSN 2413-3051
Print version ISSN 1021-447X
J. energy South. Afr. vol.30 n.4 Cape Town Nov. 2019
http://dx.doi.org/10.17159/2413-3051/2019/v30i4a6044
Potential for grid efficiency based on a combination of leakage reactances of transformers of a transmission interconnecting line: Application of an exhaustive search algorithm
N. MbuliI, II, *; A. DyantyiII; J.H.C. PretoriusI
IDepartment of Electrical, Electronic and Computer Engineering, University of Johannesburg, Kingsway Road, Auckland Park, 2006, Gauteng, South Africa. J.H.C. Pretorius: https://orcid.org/0000-0002-2023-749X
IIEskom Holdings SoC Limited, Lower Germiston Road, Cleveland, 2022, Gauteng, South Africa. ORCIDs: N Mbuli: https://orcid.org/0000-0002-5901-4971. A. Dyantyi: https://orcid.org/0000-0003-3934-5607
ABSTRACT
Transmission interconnecting lines (called interconnectors in this study) are built to facilitate the exchange of active and reactive power between two areas of a network. Step-up and step-down transformers are required at the ends of the interconnector when interconnectors are at a different voltage, usually higher, than the networks to be connected. A study was carried out to examine the impact on active power losses of a combination of leakage reactances of the transformers at the ends of an interconnector. The study assessed whether combinations can lead to different levels of active power losses and can thus affect the efficiency of the system. It was found that the combinations of reactance have a tangible impact on the power that flows through the inter-connector and, consequently, on the sharing of apparent power between the interconnector and the rest of the network. The total active power losses varied appreciably with the various combinations of reactances, resulting in the life-cycle cost of active power losses also varying with the combinations. The study showed that the combination needs to be carefully made, considering that such a choice can have a significant impact on techno-economic aspects of the power system.
Highlights
• Active power losses in power networks reduce power transfer efficiency.
• Impact of coordinated choice of transformer reactances on active power losses is assessed.
• Combinations of settings affect the power flow values in various lines.
• Further, active power losses and costs vary as combinations of settings change.
• Careful choice of reactances can enhance efficiency and reduce cost of active power losses.
Keywords: active power losses, energy efficiency, leakage reactance, life-cycle cost, net present value
1. Introduction
Electricity generated from fossil fuels remains a large component of the global generation mix. The industry is a significant contributor to emitting greenhouse gases (GHGs) such as carbon dioxide, methane, nitrous oxide and fluorinated gases into the atmosphere, leading to the depletion of the ozone layer (Environmental Protection Agency, 2016). The GHGs are known to drive climate change. Alongside the options for reducing emissions in this sector (Intergovernmental Panel on Climate Change, 2015), such as low-GHG- producing nuclear and renewable energy sources, energy efficiency presents a viable option across generation, transmission and distribution (T&D) and on the consumption side. Reducing consumption of electrical power by energy efficiency, including initiatives aimed at reducing active power losses, means that there is lesser production of GHGs and there is reduced adverse impact of these gases on the environment. There have been relatively few energy efficiency initiatives in the T&D arena, partly because of lack of incentives and enabling frameworks, as projects are often not economically viable without these mechanisms (Forsten, 2010).
To link networks in different locations, transmission interconnecting lines (called interconnect-ors in this study) are built to enable the exchange of active and reactive power. The interconnectors are longer than other lines in the network and carry significantly higher amounts of power. Interconnect-ors operate at a different, normally higher voltage, from the connected lines in the networks, requiring step-up and step-down transformers at sending and receiving ends, respectively. These transformers have primary and secondary windings that experience magneto-motive forces (Dawood et al., 2017; Kundur, 1994) that lead to leakage reactance (referred to as reactance in this study) of the transformer. This in turn is influenced by the geometry of the parts of the transformer, i.e., the core, low-voltage winding and high-voltage winding. The question that arises is whether the pairwise combination of reactances of the interconnector step-up and step-down transformers (referred to as combination in this study) could have an impact on the efficiency of the overall power system, measured by active power losses.
Literature on the impact of series reactance on power flows shows that most publications have focused on the use of series compensation of lines for this purpose. In several sources, the impact of changing the reactance of the transmission line via series compensation to enhance voltage stability, power line utilisation and active power losses is discussed (Hamzaoglu & Makram, 1999; Hridya et al., 2015; Zhang et al., 2018). Comesana et al. (2009) studied the use of a static series synchronous compensator to vary line reactance to optimise the utilisation of lines in a meshed network. Bocovich et al. (2013) presented a techno-economic comparison of using fixed and static series compensation devices to vary reactance in order to control power flows. Only one publication was identified that addressed the impact of the choice of transformer reactance on power flows and related issues (Tori-zuka & Tanaka, 1998). There are authors who studied whether varying the generator transformer reactance could reduce overall system reactance with the objective of increasing power flow and improving voltage stability to accommodate the growing electricity demand. None of the publications consulted dealt with the interconnectors, in general, and the impact of interconnector transformers on power flows and active losses, specifically.
The present study examined the impact of the choice of combinations of interconnector transformer reactances on power flows and the potential for T&D efficiency. Efficiency was based on the amount of active power losses in the system. The potential for this efficiency is the difference between worst and best active power losses that can be obtained from various combinations of reactance of transformers at the end of the intercon-nector. The life-cycle costs of these relative active power losses were also evaluated. The objectives and contributions of this study were as follows:
• To evaluate the impact of combinations of reactances of transformers at the ends of an inter-connector on the level on apparent power flowing in the interconnector.
• To assess the impact of combinations of reactances of transformers at the ends of an inter-connector on the level of active power losses. An optimisation framework is adopted to conduct the evaluation with the use of an exhaustive search algorithm. Software using this algorithm is developed in Python programming language and the code can direct the Power System Simulator for Engineering (PSS/E), a power system analysis software, to perform a variety of tasks. A module was developed in the software to determine the extent of the losses for each combination assessed. The combination of reactances that gives most saving in active power losses, and the associated value of losses, is determined by solving the problem of minimising losses. Similarly, solving the maximisation problem establishes the combination that gives least saving in losses, and associated active power losses. The difference between these values of active power losses represents the maximum potential saving in losses obtainable by choosing a combination of reactances.
• To determine the impact of combinations on the life-cycle cost of active power losses of the system. A module calculating the life-cycle worth of the difference between maximum and minimum values of active power losses was incorporated into the software. This represents the financial worth of the potential saving in active power losses discussed above.
2. Methodology
2.1 Impact of leakage reactances of interconnector transformers on power flows
Figure 1 is a diagrammatic representation of an interconnector between busses p and q of a large system, facilitating the transfer of active and reactive power between areas A and B.

The active power losses can be described using Ohm's law in Equation 1.

where Rint is the resistance of the interconnector, Ploss (int) is active power loss of the interconector, and I is the current flowing in the interconnector.
The current flowing in the corridor is given by Equation 2.
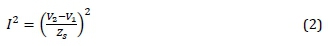
where Zs is the sum of the impedances of the transformers and that of the interconnector, as shown in Equation 3; with Vi and V2 representing the sending and receiving end voltages, respectively.
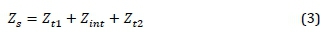
where Zti is the impedance of the sending end transformer, Zint is the impedance of the transmission interconnector, and Zt2 is the impedance of the receiving end transformer.
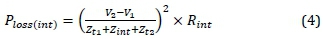
Substituting Equations 2 and 3 in Equation 1 yields Equation 4: the active power losses.
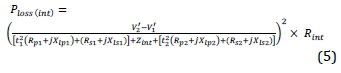
Considering the transformer turn ratios, the secondary side voltage for transformer in Area A is VÏ and for the transformer in Area B the primary voltage is V2'. Referring the impedances of both transformers to the interconnector side of the corridor and incorporating the turn ratios of the two transformers, active power losses can be written as Equation 5.
where:
t1 is the turns ratio of area A transformer 1
Rp1 is the resistance of primary winding of transformer 1
Xp1 is the leakage reactance of primary winding of transformer 1
Rs1 is the resistance of secondary winding of transformer 1
Xs1 is the leakage reactance of secondary winding of transformer 1
t2 is the turns ratio of area B transformer 2
Rp2 is the resistance of primary winding of transformer 2
Xip2 is the leakage reactance of primary winding of transformer 2
Rs2 is the resistance of secondary winding of transformer 2, and
Xis2 is the leakage reactance of secondary winding of transformer 2.
Total leakage reactance of each of the transformers of the interconnector can, therefore, be estimated by Equation 6 [9].

where t is the turns ratio of each of the transformers of the interconnector.
Equation 5 explicitly demonstrates that the reactance of the windings of the transformer of the in-terconnector and, subsequently, the reactances of these transformers, can influence the active power losses of the interconnector. Examining Equation 5
shows that different combinations of these reactances will likely lead to different levels of loss in the interconnector.
2.2 Study of the impact of combinations of reactances of interconnector transformers as an optimisation problem
The combinations of reactances of transformers at the ends of the interconnectors that give the worst (highest) losses and the best (lowest) losses must be determined in order to obtain the sense of potential for efficiency based on combinations of reactance. The difference between these losses allows the determination of the impact of changing the combinations of reactances on active power losses. This difference represents the potential saving in active power losses by choice of combinations of reactances. The life-cycle financial worth of this potential saving in active power losses can also be calculated, to obtain the monetary value of the potential saving in losses. The problem of finding the lowest and highest active power losses with their associated costs can be formulated as two nonlinear programming (NLP) problems to obtain lowest losses and costs (minimisation) and the highest losses and costs (maximisation). Each problem is formulated as follows.
Decision variables:
Xt1 = the equivalent leakage reactance of transformer 1.
Xt12 = the equivalent leakage reactance of transformer 2.
Objective function: Losses:
Maximise (minimise) Pioss: Active power losses for a large, meshed network (Roy et al., 2011) can be represented by Equation 7.

where:
Ploss are the total active power losses,
Gk is the conductance of the kth line connecting the zÏh and jthbusses
Vi, Vj are the voltages of the /th and the jth busses
di, dj are the phase angles of the /th and the jth busses, and
NTL is the total number of transmission lines.
Cost of losses:
Maximise Closes, i.e., life-cycle cost of active power losses: Active power losses represent energy that could have been used to power operations. Their reduction implies that efficiency of the power system is enhanced and operating costs are reduced. The monetary value of savings by reducing losses can be calculated from Equation 8 (Mbuli and Pretorius, 2013).
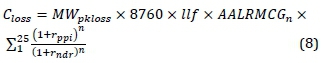
where:
Closs is the net present value (NPV) of losses over 25 years in ZAR,
MWpkloss is the value of losses in megawatts calculated at the time of system peak,
AALRMCGn is the annual average long run marginal cost of generation in ZAR/MWh in year n
llf is the loss load factor,
rppi is the producer price index inflation (PPI) rate in % in year n, and
rndr is the nominal discount rate in %.
Constraints:
Equality constraints
The equality constraints for the balance of active and reactive power in the system can be represented by Equations 9 and 10, respectively.

where:
Pg/ is the active power generation of the ith bus
Pl/ is the active power demand of the /* bus
Qg/ is the reactive power generation of the /th bus
Ql/ is the reactive power demand of the /th bus
θ/j is the admittance angle of transmission line connecting the /th and jthbusses
δ/ is the phase angle of the 7th bus
dj is the phase angle of the jthbus
Y/j is the admittance of line connecting the /th and jthbusses, and
NB is the number of busses
inequal/ty constra/nts: Generator
The technical limitations on the generator operating voltage are repreented by Equation 11, where the upper voltage limit is imposed to avoid inception of insulation-related problems and the lower voltage limit is set to protect the generator from thermal related problems. Equations 12 and 13 represent the ranges of active and reactive power, respectively, that can be produced or absorbed by a generator.
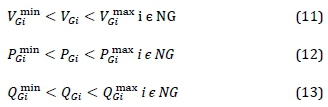
where:
Vgí min, Vgí maxare the minimum and maximum voltage limits of the ithgenerator bus,
Pgí min, Pgí maxare the minimum and maximum active power generation limits of the ithgenerator bus,
Qgí min, Qgí maxare the minimum and maximum reactive power generation limits of the ithgenerator bus, and
NG is the number of generator busses.
Load
Equation 14 calculates the allowable voltage range at which the load can operate without having insulation and thermal problems.

where Vlí min, Vlí maxare the minimum and maximum voltage limits of the /* load bus, and NTL is the number of load busses.
Branch
Equation 15 is a constraint that represents the maximum electrical load that a transmission line can carry while maintaining its electromechanical design properties.

where Slí, Slí maxare the apparent power flow and the maximum apparent power flow limit for the ith branch, and NLT is the number of branches, i.e. transformers and transmission lines.
Sign restrictions:
Equation 16 represents the sign restrictions on the values of tapchanger settings as they can only assume positive, integer numbers.
2.3 Solution of the NLP problem using the exhaustive search algorithm
The aim of a search algorithm in optimisation is to search the solution space for an alternative that optimises the objective function while satisfying the specified criteria. It should be borne in mind that the solution space can be of a limited size, but can grow immensely as the possible number of solutions increase. One potential algorithm that can be used in solving the optimisation here is the exhaustive search algorithm (Nielsen, 2009), with one version of the pseudocode listed in Brute Force Search (2018). The main steps of the algorithm can generally be summarised as follows: (1) enumerate all possible solutions; (2) test them one by one; (3) keep track of all those that satisfy the set criteria; and (4) identify the best solution.
The advantage of this approach is that the optimal solution is guaranteed. There is, however, a potential problem if the solution space ends up being extremely large, rendering excessively long computational calculations. If the number of alternatives are limited, the approach is feasible to implement. In the optimisation problem studied here, the solution space consisted of combinations of pairs of reactances for transformers at the ends of the interconnector. With 13 possible reactance values for each set of transformers, this translated into a solution space comprising 169 possible combinations, among which was a combination that optimised the desired objective function. It was, therefore, feasible to use the exhaustive search algorithm in this case.
2.4 Python program for solution of the NLP problem using exhaustive search
The software for the exhaustive search algorithm is programmed in Python (Python 3.4.9rc1 Documentation, 2018). This is an interpreted, high-level programming language created by Guido van Rosum and first released in 1991 for general-purpose programming (Python Programming Language, 2018). The main code of the algorithm is written in Python, with the required loadflow calculations left to PSS/E (PSS/E, 2007) software that contains a suite of software programs for power system analysis. Python can control PSS/E via the application program interfaces (APIs). In this way, Python can issue various types of instructions to PSS/E, e.g., modifying the network data, performing various power system analyses and extracting data from solved network. The code developed can be described by means of the flowchart shown in Figure 2.

The software code can be described as follows:
• all possible pairs of reactances for the two transformers at the ends of the interconnector are identified and associated network case files are built in PSS/E; and
• for each file representing a combination of reactances:
o a loadflow study is run;
o a check is then made to ensure that the loadflow solves properly, with the swing bus active and reactive power values within the acceptable limits of realistic generator capability, e.g., no absorption of active power;
o the code then checks if voltages and loadings of equipment are within prescribed limits;
o if the loadflow satisfies the two requirements above, the solution is admissible. Otherwise the solution is not feasible, and it is rejected. Then, apparent power (MVA) flow in the interconnector and the active power losses (MW) are recorded. Based on the active power losses, the monetary value (in ZAR) of the losses is calculated;
o the next combination is then assessed if there are still combinations not evaluated; and
once all combinations have been assessed, the combinations that give the best and worst savings are identified, and the difference between their objective function values is calculated and used to indicate the potential for saving in losses by choice of pair of reactances.
2.5 Case studies
Two case studies were conducted to investigate the impact of transformer reactance on the transmission efficiency. In the first, the Institute of Electrical and Electronics Engineers (IEEE) 39 bus system, for which a single line diagram is shown in Figure 3, is used. A 571 km, 765 kV interconnector, with 345/765 kV and 765/345 kV transformers, between busses 6 and 29 is constructed for generation resources near bus 6 to be used to support the area around bus 26.
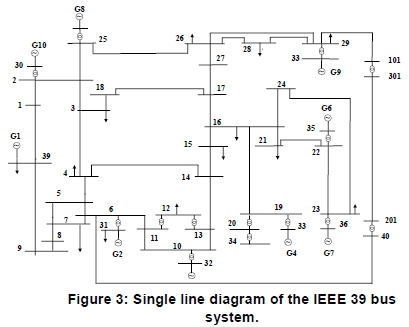
The parameters used for the line and transformers constituting the interconnector are as follows: the line has a total per unit resistance of 0.0063 Ω, reactance of 0.0361 Ω, line-charging capacitance of 12.0138 S, and continuous rating of 1251 MVA. The transformer's reactance is assumed to be in a range of 3-15%. The main consideration in the range of reactance values chosen was the objective of using as wide a range of reactances as is practically possible based on the feasibility of actual transformers for the leakage reactance values. Generally, if smaller values of leakage reactances are considered, the short circuit strength of the transformer will be compromised. On the other hand, if larger reactance values are used, unrealistically large transformers will result. The chosen values are only illustrative for the purposes of the study.
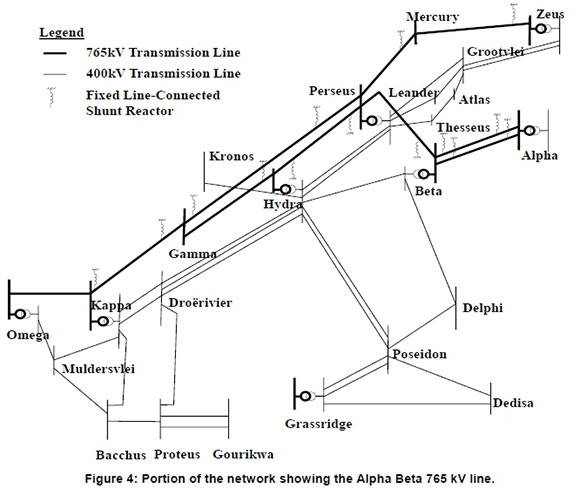
In the second case study, the Eskom system, as shown in Figure 4, was used. A 435 km, 765 kV in-terconnector with 400/765 kV and 765/400 kV transformers between the Alpha and Beta substations provided conditions for this case study. The Alpha-Beta line has a total per unit resistance of 0.0081 Ω, reactance of 0.02101Ω, line charging capacitance of 10.2645 S and continuous rating of 5558 MVA. The transformer's reactance is assumed to be in the range of 3-15%.
The following general assumptions were made (Corporate Finance, 2006) to assess the economic value of active power losses:
• the period of evaluation shall be 25 years;
• nominal amounts are to be used in the justification; the base year will be 2018;
• the nominal discount rate of 12.2% is being assumed;
• the values of inflation in the form of PPI used in the evaluation are assumed to be 6%;
• corporate tax is 28%;
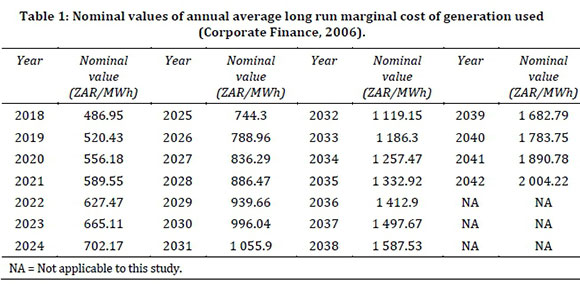
• the AALRMCGn values in Table 1 are used in the calculation of the monetary value of the saving in losses. To obtain indicative values for use in the study, the approach taken was to escalate these values using the PPI values as described above; and
• the loss load factor is assumed to be 0.53.
3. Results and discussion
This section presents the results of the case studies done to further the research. The results for the analysis of active power losses and associated costs were calculated relative to values for assumed initial combination of reactances. Important consideration was given to the ultimate difference between the highest and lowest relative saving in losses, as the difference between the two gives a measure of potential for efficiency of combinations of reactances, while the starting point and base value were not considered important.
3.1 The IEEE 39-Bus system
Load/ng of the /nterconnector
Figure 5 shows the variation in the loading of the interconnectors in MVA for various combinations of reactances. The pattern of loadings varied as the combinations of reactances of transformers changed and the loading of the interconnector varied from a minimum of 651 MVA to a maximum of 658 MVA, representing a change in loading of 7 MVA by merely changing the combinations. These observations are corroborated by Torizuka and Tanaka (1998), where the impact of the choice of generator transformer reactance on power flows in the Japanese network was investigated. It was established that varying that reactance could change powerflow.

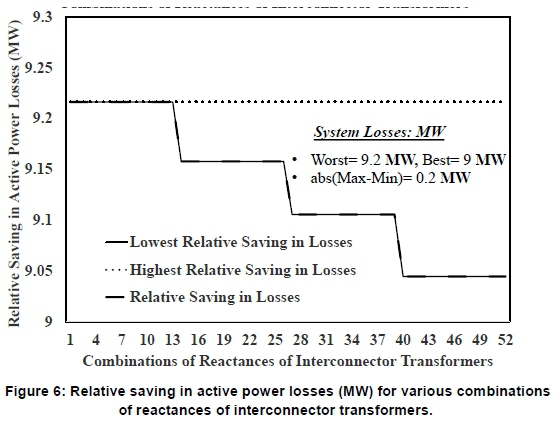
Act/ve power losses
The variation in active power losses with combinations is shown in Figure 6. There was a variation in these losses as combinations changed, with the highest and lowest relative saving in losses reaching 9.2 MW and 9.0 MW respectively. This implied that a reduction of 0.2 MW of active power losses based purely on the choice of an optimal combination was possible.
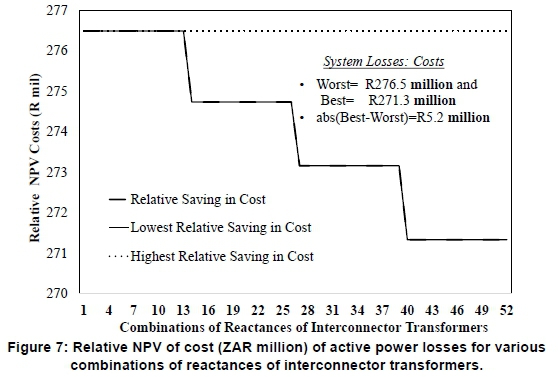
Life-cycle cost of active power losses
In Figure 7, the life-cycle costs associated with various losses in Figure 6, are plotted, with a pattern that resembles the active power losses. The highest and lowest relative reductions in life-cycle cost of losses are ZAR 276.5 million and ZAR 271.3 million respectively. This represents a potential saving in life-cycle cost of active power losses of ZAR 5.2 million by merely choosing an optimal combination of reactances.
3.2 Eskom system
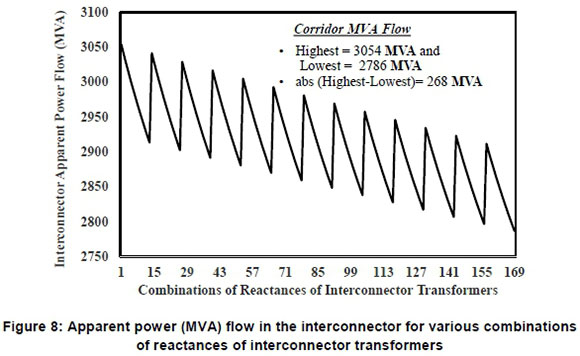
Loading of the interconnector
Figure 8 presents the variation of apparent power flowing in the Alpha-Beta interconnector with combinations. The highest amount of power is 3 054 MVA and the lowest is 2 786 MVA, the difference between the two extremes being 268 MVA. This represents the maximum difference in the utilisation of the interconnector for any pair of combinations. As with results in Section 3.1, these results tally with those of Torizuka and Tanaka (1998), who established that varying the reactances of transformers could change the power flows.
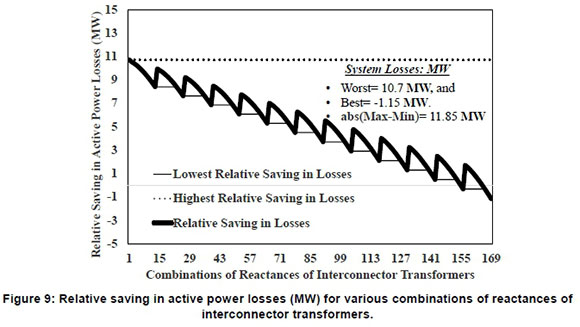
Active power losses
The traces of the highest and lowest active power losses, together with the relative active power losses, for various combinations are plotted in Figure 9. The final highest and lowest relative active power losses were 10.7 MW and -1.15 MW, respect-tively, with a difference of 11.85 MW between the extremes. This was the potential or effi ciency, represented by the careful choice among the combinations of reactances.
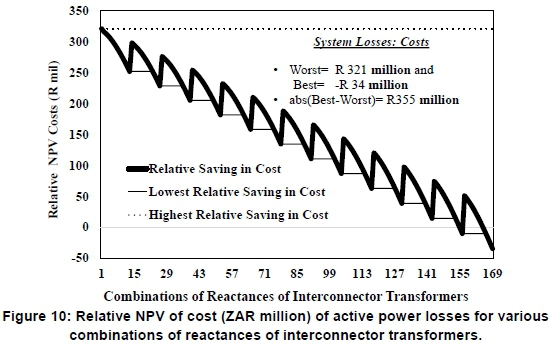
Life-cycle cost of active power losses
Figure 10 shows the relative NPVs of life-cycle costs of relative, highest relative and lowest relative savings in losses as plotted in Figure 8. The NPVs of highest and lowest relative saving in losses were ZAR 321 million and ZAR -34 million respectively, with a difference of ZAR 355 million. This was the financial value of the potential cost saving that could be obtained by careful selection of combinations of reactances.
4. Conclusions
This study examined the impact of the choice of combinations of leakage reactances of transformers of interconnectors on active power losses, and their impact of power flow. It was found that:
• the combinations of reactances of transformer can change the apparent power flow in the in-terconnector, leading to different sharing of power between the interconnector and the system for various combinations of reactances;
• changing the nature of loadflows for various combinations of reactances results in different active power losses for various combinations, with some combinations leading to least active power losses in the system and others leading to worst, showing that active power losses can be optimised by a careful selection of combinations; and
• the potential for life cycle worth of saving in losses indicates that significant monetary value can be obtained by optimising the combinations of reactance.
The study has provided insight into how optimal choice of combination of reactances of transformers can reduce active power losses in the system and deliver financial value to the utility. Furthermore, the reduction of losses means that there is lesser electricity generation requirement, and, by extension, reduced greenhouse gas emissions, given that fossil fuels play a significant role in the current power generation mix. The optimal choice of reactances has, therefore, an added benefit of reducing the adverse impact on the environment. This study contributed to a discourse on energy efficiency in general, and on transmission and distribution efficiency in particular, which is often a neglected area when efficiency is considered, but one with a high potential.
Acknowledgements
Thanks to the University of Johannesburg and Eskom Holdings SoC Limited, South Africa, for technical support for this study.
Author roles
N. Mbuli: Hatched the research idea, developed the Python software program-incorporating control of PSS/E, checked the results of the case study and wrote the text.
A. Dyantyi: adapted the software, ran the simulations and produced results of the case study. J.H.C. Pretorius: reviewed the text and did quality assurance.
References
Bocovich, M., Iyer, K., Terhaar, R. M. and Mohan, N. 2013. Overview of series connected flexible AC transmission systems (FACTS). North American Power Symposium (NAPS, Manhattan, USA: 1-6. https://doi.org/10.1109/naps.2013.6666915 [ Links ]
Brute Force Search. [Online]. 2018. Available: https://en.wikipedia.org/wiki/Brute-forcesearch. Accessed: 14 August 2018. [ Links ]
Comesana, P. F., Gandoy, J. D., Dorado, E. D. and Baeza, D. A. 2009. Evolutive algorithm to optimize the power flow in a network using series compensators. Compatibility and Power Electronics (CPE), 2009, Badajoz, Spain: 43-47. https://doi.org/10.1109/cpe.2009.5156011 [ Links ]
Dawood, K., Alboyaci, B., Cinar, M. A. and Sonmez, O. 2017. A new method for the calculation of leakage reactance in power transformer. Journal of Electrical Engineering and Technology 12(5): 1883-1890. [ Links ]
Environmental Protection Agency (EPA): Greenhouse gas emissions, Overview of greenhouse gases. 2016. [Online]. Available: https://www.epa.gov/ghgemissions/overview-greenhouse-gases. Accessed: 3 November 2018. [ Links ]
Forsten, K. 2010. Transmission efficiency initiative: Contributing to a lower carbon future. Institute of Electrical and Electronic Engineers (IEEE) Power and Energy Society (PES) Transmission and Distribution Conference and Exposition, Sao Paulo, Brazil, 8-10 November 2010: 1-6. https://doi.org/10.1109/tdc.2010.5484333 [ Links ]
Hamzaoglu, F. and Makram, E. B. 1999. Minimization of series reactive power loss for the voltage instability problems. Electric Power System Research 50(3): 175-181. [ Links ]
Hridya, K. R., Mini, V., Visakhan, R. and Kurian, A. A. 2015. Analysis of voltage stability enhancement of a grid and loss reduction using series FACTS controllers. IEEE International Conference on Power, Instrumentation, Control and Computing (PICC), 2015, Thrissur, India: 1-5. https://doi.org/10.1109/picc.2015.7455767 [ Links ]
Intergovernmental Panel on Climate Change (IPCC), Climate Change. 2015. Mitigation of climate change. [Online]. Available: https://www.ipcc.ch/pdf/assessment-report/ar5/wg3/ipccwg3ar5technical-summary.pdf. Accessed: 3 November 2018. https://doi.org/10.1080/01944363.2014.954464 [ Links ]
Kundur, P. 1994. Power system stability and control. McGraw-Hill, California, United States of America: McGraw Hill. [ Links ]
Mbuli, N. and Pretorius, J. H. C. 2013. Consideration of series compensation in the enhancement of techno-economic worth of higher voltage transmission line overlay. International Review of Electrical Engineering 8(4): 1379-1388. [ Links ]
Nielsen, F. 2009. Undergraduate Topics in Computer Science: A Concise and Practical Introduction to Programming Algorithms in Java. London, UK: Springer-Verlag. https://doi.org/10.1007/978-1-84882-339-64 [ Links ]
Power System Simulator for Engineering. 2007. Power System Simulator for Engineering: Online Documentation: Ver. 32, Siemens Energy, Inc. Corporate Finance, Economic Evaluation Parameters, 2006-2010, April 2006. [ Links ]
Python 3.4.9rc1 Documentation. 2018. [Online]. Available: https://docs.python.org/3.4/. Accessed: 1 August 2018. [ Links ]
Python Programming Language. 2018. [Online]. Available: https://en.wikipedia.org/wiki/Python (programming language). Accessed: 20 November 2018. [ Links ]
Roy, P. K., Goshal, S. P. and Thakur, S. S. 2011. Optimal reactive power dispatch considering flexible AC transmission system devices using biogeography-based optimization. Electric Power Components and Systems 39(8): 733-750. https://doi.org/10.1080/15325008.2010.541410 [ Links ]
Torizuka, T. and Tanaka, H. 1998. An outline of power system technologies in Japan. Electric Power Systems Research 44(1): 1-5. https://doi.org/10.1016/s0378-7796(97)01203-0 [ Links ]
United Nations Framework Convention on Climate Change. 2015. The adoption of the Paris agreement. [Online]. Available: https://unfccc.int/resource/docs/2015/cop21/eng/l09.pdf. Accessed: 3 November 2018. [ Links ]
Zhang, X., Tomsovic, K. and Dimitrovski, A. 2018. Optimal allocation of series FACTS devices in large-scale systems. Institute of Engineering and Technology (IET) Generation Transmission & Distribution 12(8): 1889-1896. https://doi.org/10.1049/iet-gtd.2017.1223 [ Links ]
* Corresponding author: +27 (0)11 629 5115; email: mbulin@eskom.co.za

