


Servicios Personalizados
Articulo
 Inglés (pdf)
 Articulo en XML
 Referencias del artículo
Indicadores

Links relacionados
-
 Citado por Google
 -
 Similares en Google
Compartir

 Permalink
Journal of Energy in Southern Africa
versión On-line ISSN 2413-3051
versión impresa ISSN 1021-447X
J. energy South. Afr. vol.30 no.3 Cape Town ago. 2019
http://dx.doi.org/10.17159/2413-3051/2019/v30i3a6356
ARTICLES
Wind power variability during the passage of cold fronts across South Africa
Amaris DaltonI, *; Bernard BekkerII; Andries Coenrad KrugerIII
IDepartment of Electrical and Electronic Engineering, Stellenbosch University, Private Bag X1, Matieland 7602, South Africa; https://orcid.org/0000-0002-2893-1961
IIDepartment of Electrical and Electronic Engineering, Stellenbosch University, Private Bag X1, Matieland 7602, South Africa; https://orcid.org/0000-0002-5574-0482
IIIClimate Services, South African Weather Service, Private Bag X097, Pretoria 001, South Africa; Department of Geography, Geoinformatics and Meteorology, University of Pretoria, Pretoria, South Africa; https://orcid.org/0000-0002-9815-570X
ABSTRACT
Wind is a naturally variable resource that fluctuates across timescales and, by the same token, the electricity generated by wind also fluctuates across timescales. At longer timescales, i.e., hours to days, synoptic-scale weather systems, notably cold fronts during South African winter months, are important instigators of strong wind conditions and variability in the wind resource. The variability of wind power production from aggregates of geographically disperse turbines for the passage of individual cold fronts over South Africa was simulated in this study. When considering wind power variability caused by synoptic-scale weather patterns, specifically cold fronts, the timescale at which analysis is conducted was found to be of great importance, as relatively small mean absolute power ramps at a ten-minute temporal resolution, order of 2-4% of simulated capacity, can result in large variations of total wind power production (at the order of 32-93% of simulated capacity) over a period of three to four days as a cold front passes. It was found that when the aggregate consists of a larger and more geographically dispersed set of turbines, as opposed to a smaller set of turbines specifically located within cold-front dominated high wind areas, variability and the mean absolute ramp rates decrease (or gets 'smoothed') across the timescales considered. It was finally shown that the majority of large simulated wind power ramp events observed during the winter months, especially at longer timescales, are caused by the passage of cold fronts.
Highlights:
• Significant wind power variability is caused by the passage of cold fronts.
• Wind power variability becomes larger as longer timescales are considered.
• The smoothing effect becomes greater as geographically dispersed turbines are added to an aggregated time-series.
Keywords: wind power ramps; weather systems; aggregated smoothing;
1. Introduction
Electricity generated by wind turbines fluctuates with wind speed and wind speed varies at all timescales, from decades down to sub-seconds (Widén et al., 2015). At short timescales (less than one hour), these fluctuations are caused by turbulent eddies in the boundary layer, brought about by the interaction of meso-scale weather systems with the local environment. Short-term variability may be caused by local features such as terrain, surface roughness or micro-climatic phenomena such as sea-breezes. At longer timescales, of hours to several days, the most prominent variations are brought about by synoptic-scale weather systems (Kiviluoma et al., 2016). Amongst the most frequent of synoptic systems that affect South Africa's weather are extra-tropical cyclones, and the cold fronts associated with them. Little literature could be found where the underlying causative meteorological phenomena driving wind ramp events were studied (Couto et al., 2015; Gallego-castillo et al., 2015; Lacerda et al., 2017). Furthermore, attempts to find literature in which wind power ramp events associated with specific weather systems had been studied for South Africa were not successful. In the South African context, cold fronts are deemed highly relevant to the wind energy industry as they are the main strong wind producers along the coast and adjacent interior of South Africa (Kruger et al., 2010). Strong winds from the passage of cold fronts dominate the southern parts of the country, though these winds often reach further north, as shown in Figure 1.
The variability and distributed nature of the wind resource present numerous challenges to the integration of wind energy into future power networks. Such challenges include suboptimal unit allocation of thermal dispatchable units and low capacity credit of variable renewable energy (VRE) generators (Albadi et al., 2010; Ueckerdt et al., 2015). These problems, associated with the incorporation of VRE into the power network, are expected to become more pronounced as the level of VRE penetration increases. Currently, South Africa remains heavily reliant on coal (Mcewan, 2017), but it is, however, anticipated that wind energy will play an important part in the country's future energy mix, as the country is rich in wind resources (Knorr et al., 2016) and has a favourable policy environment for renewable energy development (Department of Energy, 2018).
The present study provided a first iteration analysis that quantifies anticipated induced variability and wind power ramps during the passage of typical South African frontal systems. Understanding this variability and power ramps could assist network operators in unit commitment, load scheduling and short-term maintenance planning. There is a significant body of literature considering the nature and effects of wind power variability (Kiviluoma et al., 2016; Choukri et al., 2017; Kalverla et al., 2017; Monforti et al., 2016; S0rensen et al., 2018; Prasad et al., 2009; Thapar et al., 2011). This literature may be divided into studies that were conducted using real wind power data (Kiviluoma et al., 2016; Choukri et al., 2017) and those using meteorological data. The latter may in turn be divided between studies using actual observational data (Kalverla et al., 2017) and studies using outputs from numerical weather prediction (Monforti et al., 2014; S0rensen, Heunis, et al., 2018) as proxies for generation data. Observed or modelled wind speeds are frequently used to estimate wind power potential through the use of wind resource assessments (Prasad et al., 2009a; Prasad et al., 2009b) and transforming wind speeds to power through turbine power curves (Thapar et al., 2011). There is significant evidence supporting the idea of the 'smoothing effect', i.e., reductions in the gradient of electricity feed-in, brought about by aggregation effects from geographically dispersed wind generators (Widen et al., 2015). The smoothing effect is attributed to wind speed that varies with geographical distance, where the greater the distance the more dissimilar the wind resource. From the literature considered (Albadi et al., 2010), it was, however, found that this smoothing effect is more pronounced over short rather than long time intervals. It may be contended that power ramps and variability at time periods of smaller than ten minutes are of greatest importance from a turbine design perspective, rather than a power system perspective, as it is assumed that fluctuations at these timescales would be effectively smoothed (S0rensen et al., 2008; Widen et al., 2015). However, variability over longer time intervals (greater than or equal to an hour) across relatively large spatial extents is considered to be of greater importance to the security and adequacy of power systems (Kiviluoma et al., 2016). Variability at longer time-scales is also considered to be of greater importance to this study, as it has been found that longer-time-scale, synoptic-scale weather patterns (such as cold fronts) drive variability (Kiviluoma et al., 2016).
It has been noted that it is difficult to make generalisations on resource variability for a specific region based on studies done for other regions (Kiviluoma et al., 2016; Gallego-Castillo et al., 2015). This is especially true for studies considering the prevailing meteorological processes inherent to a specific region, highlighting the importance of conducting region-specific studies. In studies conducted by Knorr et al. (2016) and S0rensen et al. (2018), the variability of the wind energy resource in South Africa was assessed using the Weather Research and Forecasting Model (Skamarock et al., 2008) reanal-ysis data. Both studies found that power ramps will be significantly reduced by aggregated smoothing, as the number of geographically dispersed generators feeding into the grid increases over time. Both Knorr et al. (2016) and S0rensen et al. (2018) focused on wind power variability and ramps at high temporal resolutions of ten and 15 minutes respectively, but not on timescales of hours to days. Aggregated smoothing is most evident at short timescales; however, larger power ramps become evident at longer timescales due to the impact of slower-moving, synoptic-scale weather systems (Widen et al., 2015; Kiviluoma et al., 2016). Indeed, in a study considering various countries (Mararakanye et al., 2019), it was found that variations from 15 minutes to eight hours could be from 10-40% of installed capacity, which highlights the importance of conducting variability studies focused specifically on longer timescales. Therefore, in addition to considering variability in wind power production introduced by synoptic-scale weather systems at short timescales, the present study also analysed such variability and power ramps at hourly and daily timescales.
2. Methodology
Simulations were conducted representing wind power generation during the passage of several cold fronts over South Africa. A cold front may somewhat simply be defined as the baroclinic boundary between a mass of cold air and warm air, where temperature decreases by a minimum of 3 °C (Eumetrain, 2012). There are no strict empirical definitions of a cold front, especially in terms of its significance, therefore, noteworthy historic cold fronts that had made landfall in South Africa were identified from news media reporting or from increases in observed wind speeds from Wind Atlas for South Africa (WASA) observational mast data (Council for Scientific and Industrial Research (CSIR), 2010; ECR Newswatch, 2016).
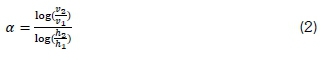
Subsequently, the corresponding synoptic weather charts, publicly downloadable as open access from the South African Weather Service's website, were used for more concise identification of fronts (South African Weather Service, 2018). An example of such a synoptic weather map depicting an approaching extra-tropical cyclone with its associated cold front is shown in Figure 2.
Wind power simulations were conducted for the passage of four cold fronts during August 2012, May 2013, and two consecutive events in July 2016 approximately two days apart. Wind speed and direction time series at four observational heights (20 m, 40 m, 60 m, 62 m), with a ten-minute temporal resolution, were obtained for fifteen WASA observational masts, represented by WM1-15 in Figure 3. The observational data, freely available from WASA (CSIR, 2010), was downloaded for periods corresponding to those of selected cold fronts making landfall in South Africa. The WM1-10 were installed during the WASA 1 project throughout 2010. The WM11-15 were installed during the WASA 2 project throughout 2015; therefore, the 2012 and 2013 simulations comprised data from ten observational masts. With the addition of WASA Phase 2 and the decommissioning of WM04 and WM08, the 2016 simulation consisted of data from 13 observational masts. Wind speeds were extrapolated from 62 m to the selected hub height of 80 m using Hellman's law, defined by Equation 1.
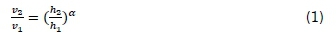
where v2 is the unknown wind speed at height h2, vl is the measured wind speed at hi, and α is Hell-man's component or the wind shear component. As wind speed data is available at two heights, α was calculated through a log linear model, defined by Equation 2.
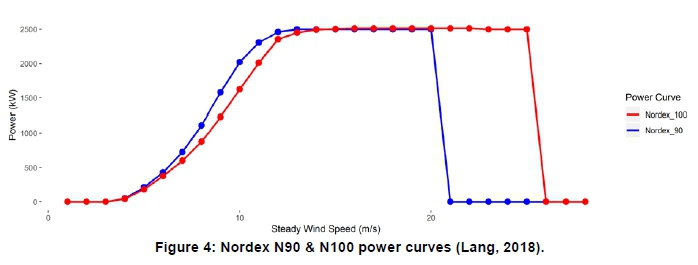
It is unrealistic to assume that the same turbine would be installed across the study area. Historic wind speeds observed at the observational masts (Mortensen et al., 2012) were, therefore, used to determine the likely International Electrotechnical Commission (IEC) class of turbines to be installed in a specific region. Subsequently two turbines from the same manufacturer, Nordex_N90 (IEC II) and Nordex_N100 (IEC III), with the same nameplate capacity of 2.5 MW, were selected. The selection was in part based on the Renewable Energy Independent Power Producer Procurement Programme wind farm projects, including the South African Dorper (31.478S, 26.438E) and Kouga (34.056S, 24.625E) wind farms, where these respective turbine types are installed. Power curves consisting of discrete points were obtained from the manufacturer, through the XML package in R (Lang, 2018), as shown in Figure 4.
Piece-wise functions were defined to emulate the power curves. Accordingly, the power curve was divided into four distinct functions. Three of these were simple horizontal straight-line functions: a function through the rated power, and two functions through the origin. These were for wind speeds of less than the cut-in speed and greater than the cutout and rated wind speeds, respectively (Joubert, 2017). The final function was represented by a higher (tenth) order polynomial for wind speeds between the cut-in and the rated wind speeds. The Im function, which forms part of R base, was used for polynomial regression (R Core Team, 2018). It was found that the derived polynomial functions predicted the power curve nearly perfectly (R2 = 1), except for wind speeds approaching the cut-in and rated wind speeds. To resolve these difficulties, linear regression was applied to obtain a linear function to resolve wind speeds between the cut-in wind speed and the first discrete point on the power curve, i.e., 3 < x < 4 m/s. A similar procedure was performed to be able to predict wind speeds between the final discrete point on the power curve and the rated wind speed. Once the power curves had been defined, wind power simulations were performed for the selected cold fronts. In the simulations, each of the observational masts for which wind speed data was obtained served as a proxy for a potential wind turbine. Unanimous indicators for the time of the cold front making landfall had to be selected for comparison between events. The following range of information sources and indicators were considered:
• a distinct change in wind direction, usually from the north-westerly sector to the south-westerly at WM05 (19.69245°E, 34.61192°S) (however, due to the orientation of some fronts not following the typical textbook examples this would not always be the case);
• the boundary at the surface between the warmer and colder air masses in the south-west of the Western Cape province, i.e., a cold front, indicated by an observable drop in surface temperature;
• stronger wind speeds due to the change in wind direction and associated turbulence in the boundary layer;
• the commencement of rain; and
• interrogation of South African Weather Service daily synoptic charts.
It should be noted that all the above signals do not occur at the same time, but can be hours apart. However, considering the information available, commencement dates of the movement of the cold fronts over the virtual wind turbines were selected, indicated as yellow lines in Figure 5. After the wind power simulation of individual fronts, the simulation was extended for passage of cold fronts throughout the months of interest, i.e., August 2012, May 2013 and July 2016.
Two simple methods of aggregation of simulated wind power time series were used. For the first set of simulated time series, hereafter referred to as the 'uniform aggregation', the ten-minute time-step wind power values generated by each of the proxies were aggregated into a single time series using a simple mean. For the second set of simulation time series, hereafter referred to as the 'cold front dominated aggregation', only the proxy generators located in the cold front dominated geographic regions, as presented in Figure 1, were selected. The 'cold front dominated aggregation' consisted of a mean from the WM04, WM05, WM07, WM08 and WM10 time series, for the 2012 and 2013 simulations. For the 2016 simulation, WM04 and WM08 data were not available, so that data from WM11, WM12 and WM13, which are also located within cold front-dominated high wind areas, were added. The aggregated time series of wind power outputs for each of the simulations was considered as a percentage of the installed capacities considered within the simulation. The wind power simulations were then analysed within the context of the differences in generation between consecutive time intervals, i.e., the power ramps. Accordingly, the mean-simulated wind power time series from each of the distinct observational masts were aggregated at ten-minute, hourly and daily timescales.
3. Results and discussion
When considering the aggregated time series against that of each individual simulation, the smoothing effect becomes clearly evident, as shown in Figure 6, where a less pronounced fluctuation between minima and maxima values is evident.
This is fairly similar to what was observed by Knorr et al. (2016) and it could be inferred that this line would become even smoother at the ten-minute timescale should more generators be added to the aggregate. Despite significant smoothing evident in the aggregated time series, a considerable degree of variability remained evident if considering the simulation in its entirety across four days. Figure 7 represents the two wind power simulations conducted for the cold front making landfall in the Western Cape on 22 August 2012 and should be read in conjunction with Figure 8, showing a synoptic weather map of this cold front. Figure 7 shows that a sharp and immediate ramp up in wind power generation, followed by a more gradual ramp down, was associated with the passage of the front.
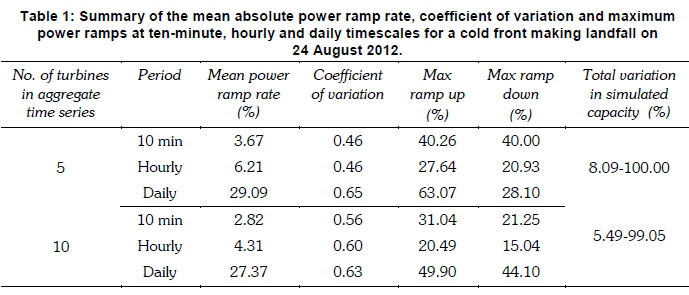
The variability of these simulations, expressed in terms of mean absolute ramp rate, coefficient of variation and maximum power ramps (up and down), is summarised in Table 1 at the ten-minute, hourly and daily timescales. Table 1 shows that wind power variability was greater in the 'cold front-dominated aggregation' than in the 'uniform aggregation', across all measured indices (except from the daily max ramp down). This can likely be attributed to the increase in turbine numbers in the simulation and turbine placements outside of geographic areas where cold fronts were the dominant strong wind-producing mechanism. Table 1 also presents an increasing variability across all measured indices as the measurement period increased.
Figure 9 represents the two wind power simulations conducted for the cold front making landfall in the Western Cape on 26 May 2013. A synoptic weather map of this cold front is shown in Figure 10. The wind power variability in these simulations, expressed in terms of the mean absolute ramp rate, coefficient of variation and maximum ramp ups, is summarised in Table 2 at the ten-minute, hourly and daily timescales. Figure 9 shows a ramp up-ramp down pattern similar to that in Figure 7, although in this instance these ramps are relatively subdued, likely because of the differing intensities and tracks of the respective systems. Table 2 presents a wind power that is more variable in the 'cold front aggregation' than in the 'uniform aggregation' methods, which is also similar to what was observed in the previous simulation. Although the mean power ramps remained the largest at the longest timescale in Table 2, this was different for the coefficient of variation and max ramp ups, which was greater at the 10-minute timescale.
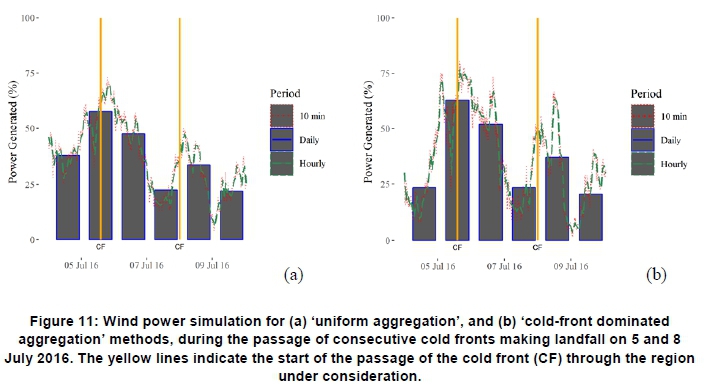
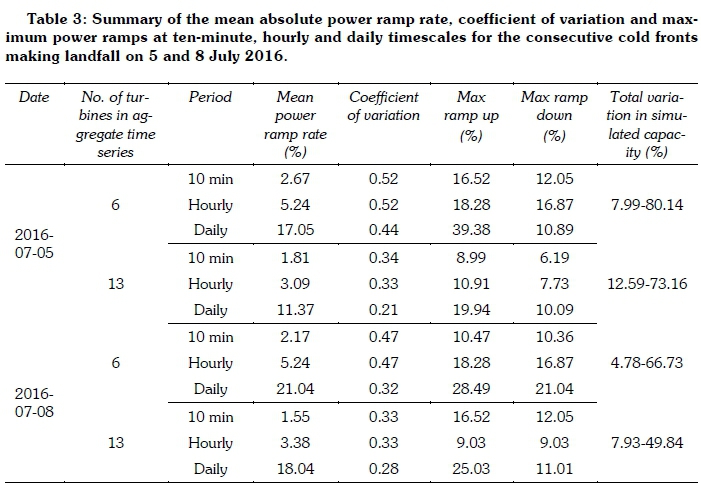
For the July 2016 simulations, two consecutive cold fronts were considered: the first making landfall on 5 July, and the second on 8 July. As with the previous simulations, a steep ramp up in simulated wind power generation was followed by a ramp down. As shown from the synoptic weather maps in Figure 12, the cold front making landfall on 05 July was located further to the north and, consequently, as shown in Figure 11, had a larger impact on the wind power generated than the cold front making landfall on 08 July. The variability of these simulations, expressed in terms of mean absolute ramp rate, coefficient of variation and maximum ramp ups, is summarised in Table 3. Table 3 reveals similar trends to Tables 1 and 2, where variability tended to increase in proportion to the timescale and to decrease in inverse proportion to the number of turbines.
Figures 13-14 show that the mean absolute power ramp rate increased significantly as the temporal resolution decreased from ten minutes to hourly and to daily for all cold fronts considered. This highlights the importance of conducting analysis at longer time scales when studying the impact of synoptic scale systems on wind power variability. Mean absolute power ramps across timescales were larger for the 'cold front-dominated aggregation' than for the 'uniform aggregation'. The mean difference in percentage in mean absolute power ramps between the two aggregation methods were: 30.30% at ten minutes, 36.52% at hourly, and 13.52% at daily. At the ten-minute and hourly time-scales, differences between the aggregation scenarios were larger than at the daily timescale. When comparing differences in the coefficient of variation between the aggregation scenarios, it was similarly found that the cold front dominated aggregate and usually had a higher coefficient of variation than the uniform aggregate across timescales. The differences between aggregation scenarios were: 11.95% at ten minutes, 20.18% at hourly, and 2.19% at daily. Similar to comparisons between mean absolute ramp rates, differences in the coefficient of variations between aggregation scenarios were larger at the ten-minute and hourly timescales than at the daily timescale.
Figures 15-20 illustrate wind power simulations for the two geographic aggregation scenarios considered throughout this study, for the months of August 2012, May 2013 and July 2016, at ten-minute, hourly and daily timescales. Visual inspection shows that most of large spikes in wind power production, especially at the daily timescale, were preceded by a cold front making landfall in the Western Cape.
Spikes in power production that was not accompanied by a cold front could also be identified. An example of this was 27 August 2012, where mostly clear sky conditions were observed and the weather was dominated by a ridging high pressure system extending east from the quasi-stationary Atlantic high pressure system onto the sub-continent. The Atlantic or Indian Ocean high pressure systems ridging onto the subcontinent were also identified by Kruger et al. (2013) as a common source of annual maximum wind gusts. Notwithstanding such less common instances in winter, Figures 15-20 show that the majority of large ramp events during the months considered, especially at longer timescales, were caused by the passage of cold fronts.
4. Conclusions
Based on the simulations of wind power production during the passage of cold fronts as conducted within this study, the following conclusions are made:
• When aggregating a wind power production time series from geographically distributed generators, a reduction in wind power variability was represented both in terms of mean absolute power ramps and the coefficient of variation.
• A sharp ramp up in wind power production followed by a slightly more gradual, but still significant, ramp down, occurred with the passage of individual cold fronts despite the reduction in wind power variability through aggregation effects. The severity of this ramp-up ramp-down is dependent on the severity and location of the cold front in question.
• A substantial increase in mean absolute ramp rate occurred when increasing the period under consideration from timescales of minutes to hours to days. This highlighted the importance of considering longer periods when studying and attempting to quantify the variability of wind power production with the passage of synoptic-scale weather systems. This is also of importance to electricity network operators in terms of load scheduling and planning of short-term maintenance in thermal power plants with the approach and onset of weather systems such as cold fronts.
• The relatively small mean absolute ramp rate at the ten-minute timescale could result in a massive variation of total simulated capacity over the four-day simulation period (e.g. 5.4999.05% for the 25 August 2012 'uniform aggregation' simulation) with the passage of a cold front. This highlighted the importance of analysing wind power variability at longer timescales.
• Most large ramp events during the winter months considered, especially at longer time-scales, are caused by the passage of cold fronts across South Africa.
Acknowledgements
The authors would like to acknowledge the support provided by the Centre for Renewable and Sustainable Energy Studies at Stellenbosch University, South Africa, and the feedback received from the WindAC Conference, 2018.
Author roles
Amaris Dalton: Lead author, corresponding author, performed central experiments and wrote draft article. Bernard Bekker: Co-author; revised draft article prior to submission, gave detailed feedback and provided supervision throughout the project.
Andries Kruger: Co-author; significant contributions to sections of the article dealing specifically with meteorology including identification of the time of passage of cold fronts and the strong wind mechanisms in South Africa.
References
Albadi, M.H. & El-Saadany, E.F. 2010. Overview of wind power intermittency impacts on power systems. Electric Power Systems Research 80(6): 627-632. Available at: http://dx.doi.org/10.1016/j.epsr.2009.10.035. [ Links ]
Choukri, K., Naddami, A. & Hayani, S.M. 2017. Deep analysis of wind variability and smoothing effect in Moroccan wind farms. Wind Engineering 41(4): 272-281. https://doi.org/10.1177/0309524x17709731 [ Links ]
Council for Scientific and Industrial Research [CSIR]. 2010. No title. Available at: http://wasadata.csir.co.za/wasa1/WASAData [Accessed July 10, 2018]. [ Links ]
Couto, A., Costa, P., Rodrigues, L., Lopes, V. V. & Estanqueiro, A. 2015. Impact of weather regimes on the wind power ramp forecast in Portugal. IEEE Transactions on Sustainable Energy 6(3): 934-942. https://doi.org/10.1109/tste.2014.2334062 [ Links ]
Department of Energy. 2018. Draft Integrated Resource Plan. Pretoria. ECR Newswatch. 2016. PICS: Cold weekend brings snow in parts of KZN. Available at: https://www.ecr.co.za/news/news/pics-cold-weekend-brings-snow-kzn/ [Accessed July 10, 2018]. [ Links ]
Eumetrain. 2012. South African Cold Fronts. Available at: http://www.eumetrain.org/satmanu/CMs/SACF/print.htm. [ Links ]
Gallego-Castillo, C., Cuerva-Tejero, A. & Lopez-Garcia, O. 2015. A review on the recent history of wind power ramp forecasting. Renewable and Sustainable Energy Reviews 52: 1148-1157. https://doi.org/10.1016/j.rser.2015.07.154 [ Links ]
Gallego-castillo, C., Garcia-bustamante, E., Cuerva, A. & Navarro, J. 2015. Identifying wind power ramp causes from multivariate datasets: A methodological proposal and its application to reanalysis data. IET Renewable Power Generation 9(8): 867-875 [ Links ]
Google Earth Pro, US Department of State Geographer, DATA SIO, US Navy, NOAA, & Image Landsat/ Copernicus. 2019. South Africa. [ Links ]
Joubert, C.J. 2017. Geographical location optimisation of wind and solar photovoltaic power capacity in South Africa using mean- variance portfolio theory and time series clustering. Master of Engineering dissertation, Stellenbosch University, Stellenbosch South Africa. https://doi.org/10.29252/jafm.12.06.29789 [ Links ]
Kalverla, P.C., Steeneveld, G.J., Ronda, R.J. & Holtslag, A.A.M. 2017. An observational climatology of anomalous wind events at offshore meteomast IJmuiden (North Sea). Journal of Wind Engineering and Industrial Aerodynamics 165 (2017): 86-99. Available at: http://dx.doi.org/10.1016/j.jweia.2017.03.008.; https://doi.org/10.1016/j.jweia.2017.03.008 [ Links ]
Kiviluoma, J., Holttinen, H., Weir, D., Scharff, R., Söder, L., Menemenlis, N., Cutululis, N.A., Lopez, I.D. & Lannoye, E. 2016. Variability in large-scale wind power generation. Wind Energy 19:1649-1665. https://doi.org/10.1002/we.1942 [ Links ]
Knorr, K., Zimmermann, B., Bofinger, S., Gerlach, A.K., Bischof-Niemz, T. & Mushwana, C. 2016. Wind and Solar PV Resource Aggregation Study for South Africa. [ Links ]
Kruger, A.C. 2011. Wind climatology of South Africa relevant to the design of the built environment. PhD dissertation, Stellenbosch Univeristy, Stellenbsoch, South Africa. [ Links ]
Kruger, A.G., Goliger, A.M., Retief, J. V. & Sekele, S. 2010. Strong wind climatic zones in South Africa. Wind and Structures, An International Journal 13(1): 37-55. https://doi.org/10.12989/was.2010.13.1.037 [ Links ]
Lacerda, M. & Estanqueiro, A. 2017. Wind power ramps driven by windstorms. Energies 10 (10): 1475. https://doi.org/10.3390/en10101475 [ Links ]
Lang, D.T. 2018. Package 'XML'. Available at: http://www.omegahat.net/RSXML. [ Links ]
Mararakanye, N. & Bekker, B. 2019. Renewable energy integration impacts within the context of generator type, penetration level and grid characteristics. Renewable and Sustainable Energy Reviews 108(March): 441-451. https://doi.org/10.1016/j.rser.2019.03.045 [ Links ]
Mcewan, C. 2017. Spatial processes and politics of renewable energy transition: Land, zones and frictions in South Africa. Political Geography 56: 1-12. https://doi.org/10.1016/j.polgeo.2016.10.001 [ Links ]
Monforti, F., Huld, T., Bódis, K., Vitali, L., Isidoro, M.D. & Lacal-arántegui, R. 2014. Assessing complementarity of wind and solar resources for energy production in Italy. A Monte Carlo approach. Renewable Energy 63: 576-586. https://doi.org/10.1016/j.rser.2015.12.318 [ Links ]
Monforti, F., Gaetani, M. & Vignati, E. 2016. How synchronous is wind energy production among European countries? Renewable and Sustainable Energy Reviews 59: 1622-1638. Available at: http://dx.doi.org/10.1016/j.rser.2015.12.318. [ Links ]
Mortensen, N.G., Hansen, J.C., Kelly, M.C., Szewczuk, S., Mabille, E. & Prinsloo, E. 2012. Wind Atlas for South Africa (WASA) Observational wind atlas for 10 met. stations in Northern, Western and Eastern Cape provinces. Wind Atlas for South Africa (WASA). [ Links ]
Prasad, R. D., Bansal, R. C. & Sauturaga, M. 2009. Some of the design and methodology considerations in wind resource assessment. IET Renewable Power Generation 3(1): 53-64. https://doi.org/10.1049/iet-rpg:20080030 [ Links ]
Prasad, R.D., Bansal, R.C. & Sauturaga, M. 2009. Wind energy analysis for Vadravadra Site in Fiji Islands: A case study. IEEE Transactions on Energy Conversion 24(3): 750-757. [ Links ]
R Core Team. 2018. R: A language and environment for statistical computing. Available at: https://www.r-project.org/. [ Links ]
Skamarock, W. C., Klemp, J. B., Dudhia, J., Gill, D.O., Barker, D. M., Duda, M.G., Huang, X.-Y., Wang, W. & Powers, J.G. 2008. A Description of the Advanced Research WRF Version 3. NCAR Tech. Note NCAR/TN-475+STR. [ Links ]
S0rensen, P., Cutululis, N.A., Vigueras-Rodríguez, A., Madsen, H., Pinson, P., Jensen, L.E., Hjerrild, J. & Donovan, M. 2008. Modelling of power fluctuations from large offshore wind farms. Wind Energy 11(1): 29-43. https://doi.org/10.1002/we.246 [ Links ]
S0rensen, P., Litong-palima, M., Hahman, A.N., Heunis, S., Ntusi, M., and Hansen, J.C. 2018. Wind power variability and power system reserves in South Africa. Journal of Energy in Southern Africa 29(1): 59-71. https://doi.org/10.17159/2413-3051/2017/v29i1a2067 [ Links ]
South African Weather Service. 2018. No Title. Available at: http://www.weathersa.co.za/climate/publications [Accessed July 10, 2018]. [ Links ]
Thapar, V., Agnihotri, G. & Sethi, V.K. 2011. Critical analysis of methods for mathematical modelling of wind turbines. Renewable Energy 36(11): 3166-3177. https://doi.org/10.1016/j.renene.2011.03.016 [ Links ]
Ueckerdt, F., Brecha, R. & Luderer, G. 2015. Analyzing major challenges of wind and solar variability in power systems. Renewable Energy 81(2015): 1-10. https://doi.org/10.1016/j.renene.2015.03.002 [ Links ]
Widén, J. et al. 2015. Variability assessment and forecasting of renewables: A review for solar, wind, wave and tidal resources. Renewable and Sustainable Energy Reviews 44: 356-375. https://doi.org/10.1016/j.rser.2014.12.019 [ Links ]
* Corresponding author: +27 (0)79 408 2122; email: amaris_dalton@sun.ac.za

