


Services on Demand
Article
 English (pdf)
 Article in xml format
 Article references
Indicators

Related links
-
 Cited by Google
 -
 Similars in Google
Share

 Permalink
Journal of Energy in Southern Africa
On-line version ISSN 2413-3051
Print version ISSN 1021-447X
J. energy South. Afr. vol.30 n.3 Cape Town Aug. 2019
http://dx.doi.org/10.17159/2413-3051/2019/v30i3a6314
ARTICLES
Investigating diffuse irradiance variation under different cloud conditions in Durban, using k-means clustering
Paulene GovenderI, *; Venkataraman SivakumarII
IDiscipline of Physics, School of Chemistry and Physics, University of KwaZulu-Natal, University Road Westville, Private Bag X54001, Durban 4000, South Africa. https://orcid.org/0000-0002-1104-6632
IIDiscipline of Physics, School of Chemistry and Physics, University of KwaZulu-Natal, University Road Westville, Private Bag X54001, Durban 4000, South Africa. https://orcid.org/0000-0003-2462-681X
ABSTRACT
Diffuse irradiance is important for the operation of solar-powered devices such as photovoltaics, so it is important to analyse its behaviour under different sky conditions. The primary cause of short-term irradiance variability is clouds. One approach to analyse the diffuse irradiance variation is to use cluster analysis to group together days experiencing similar cloud patterns. A study was carried out to examine the application of k-means clustering to daily cloud data in Durban, South Africa (29.87 °S; 30.98 °E), which revealed four distinct day-time cloud cover (CC) patterns classified as Class I, II, III and IV, corresponding to cloudy, sunny, or a combination of the two. Diffuse irradiance was then correlated with each of the classes to establish corresponding diurnal irradiance patterns and the associated temporal variation. Class I had highest diffuse irradiance variation, followed by Classes III, IV and II. To further investigate the local cloud dynamics, cloud types were also analysed for Classes I-IV. It was found that stratocumulus (low cloud category); altocumulus translucidus, castellanus and altocumulus (middle cloud category); and cirrus fibrates and spissatus (high cloud category), were the most frequently occurring cloud types within the different classes. This study contributes to the understanding of the diurnal diffuse irradiance patterns under the four most frequently occurring CC conditions in Durban. Overall, knowledge of these CC and associated diffuse irradiance patterns is useful for solar plant operators to manage plant output where, depending on the CC condition, the use of back-up devices may be increased or reduced accordingly.
Highlights:
• Diffuse irradiance variation is caused by cloud cover.
• Clustering applied to cloud cover to find frequently occurring patterns.
• There are benefits to analysing diffuse irradiance associated with cloud cover patterns.
• Diffuse irradiance variation correlated with cloud type.
Keywords: cloud cover patterns; stratocumulus; altocumulus; cirrus
1. Introduction
The Earth at any given time has between 60% and 70% of cloud coverage (Quante, 2004). Clouds affect the Earth's radiation budget, where the incoming radiation undergoes reflection, scattering or absorption (or a combination of these processes) by cloud particles (Heinle et al. 2010). The variable nature of solar irradiance at ground level is attributable to clouds, aerosols and water vapour, with clouds being dominant (Marquez and Coimbra, 2013). Interaction of clouds with solar radiation results in variability of the solar resource, which affects the use of small-and large-scale solar-powered devices. The operation of solar-powered devices such as photo-voltaics (PVs) rely on two irradiance components: direct normal (beam) and diffuse. During clear sky conditions, beam irradiance dominates; however, in the presence of clouds, much of the incoming radiation is in the form of diffuse irradiance because of scattering. The degree of scattering is dependent on a variety of cloud properties such as size, thickness, composition, opacity and spatial extent. Interaction between clouds and diffuse irradiance is therefore complex, and an analysis of cloud cover (CC) patterns may be a step towards understanding this complex relationship.
By 2017, South Africa had more than thirty operational PV power plants, with an additional twelve in planning phase (Kritzinger, 2017). Adequate knowledge of the solar resource potential is therefore important for the successful operation of these systems. Non-concentrating solar-powered devices such as PVs are still able to generate some power in the presence of clouds through absorption of the diffuse radiation, although primarily reliant on beam irradiance. Diffuse horizontal irradiance (Dh) is the component that undergoes scattering before reaching the ground. This scattering is minimal for clear days, while on partly cloudy and overcast days it is significant. Knowledge of the diffuse irradiance levels and its variation under different cloud conditions is therefore important for effectively operating and managing small- and large-scale PV systems. Furthermore, the extent of this Dh variation is often not known to a solar plant operator, which adds to the already complex task of managing plant output. A method for analysing this Dh variation would be to group together days that experience similar cloud coverage. One approach to achieve this would be through clustering of CC measurements.
Cluster analysis (or clustering) is an explorative data analysis technique used for investigating the underlying structure in the data. Most simply, it is described as the grouping of objects, where the objects share similar characteristics. According to Jain (2010), classification is one of the objectives of clustering and is useful, as once an object is classified it shares the general pattern of the class. The present study used clustering for classifying days according to the amount of CC present. This is useful since CC classes containing distinct patterns that usually occur at a given location may be established; and the associated Dhlevels for each of the classes may be analysed, in order to understand the diurnal variation.
Currently, limited works have investigated CC patterns through clustering and the variation in irra-diance, particularly diffuse, associated with these patterns. A study employing the k-means clustering technique for the identification of cloud coverage was conducted by Gomasathit (2013), where the data was partitioned into two clusters. The primary aim was to distinguish between clear and cloudy conditions over the Thailand region, based on the classification of pixels from satellite imagery. A distinct difference between that study and the present one is, however, that Gomasathit did not focus on diurnal patterns in CC, but rather on the degree of cloudiness over the region. Durban, KwaZulu-Natal province (29.87 °S; 30.98 °E), is located on the east coast of South Africa and is classified as 'Cfa', according to the Ko ppen-Geiger climate classification system (Kottek et al., 2006). Locations of this class can be described as having a warm, temperate climate with hot humid summers and mild winters. Although previous studies have described observed trends, patterns or characteristics of climate-related variables such as temperature, rainfall and irradi-ance in Durban (Kruger, 2006; Kruger and Sekele, 2013; Jury, 2013; Jury, 2017; Zawilska and Brooks, 2011), limited work was done to characterise CC patterns or investigate diffuse irradiance variation under frequently occurring CC conditions. Recently, Govender et al. (2018) presented initial results on CC patterns in Durban using clustering, but the primary aim of their study was to use CC as a tool for forecasting irradiance. In addition, the study focused on beam irradiance and, in contrast with the present research, did not present any association between CC conditions and how Dh levels vary under these different conditions. Although patterns of CC through clustering were established in that study, the present research presents the complete clustering analysis, since: (i) the duration of daily CC data used for the clustering analysis has changed, i.e., Goven-der et al. considered hours 9:00-6:00, whereas in the present study this was changed to 8:00 - 16:00; and (ii) only those days that have simultaneous measurements of diffuse irradiance and cloud type observations were included in the present study.
The purpose here is to: (i) to classify and characterise diurnal CC profiles and establish frequently occurring patterns in Durban using a clustering approach; (ii) to analyse the variation of the Dh levels associated with these CC patterns; and (iii) investigate the cloud types corresponding to each of the CC patterns.
2. Data
2.1 Cloud cover
The CC data was in the form of CC forecasts that were obtained from AccuWeather a public weather-service provider (AccuWeather, 2019). Ac-cuWeather uses the Global Forecast System (GFS) Numerical Weather Prediction (NWP) model to produce hourly-resolution forecasts of CC for the day ahead and is operated by the National Oceanic and Atmospheric Administration. The GFS model has a spatial domain of 28 km x 28 km, models 64 layers of the atmosphere, and is run every six hours to produce forecasts up to 180 hours ahead and every 12 hours for forecasts up to 384 hours ahead (Chatur-vedi and Isha, 2016). The CC forecasts for Durban from AccuWeather are available at hourly-resolution for at least six hours ahead, producing a daily CC profile. The present study used a 'CC profile' and referred to CC as a function of time over a day. A set of 220 days during the year 2016, approximately uniformly distributed throughout the year, was used.
The CC profiles from 8:00 to 16:00 South African Standard Time (SAST) were used, since it approximately spans the region of mostly daylight hours across all seasons. The CC forecasts available from AccuWeather are given as a percentage, where the values of CC range from 0% to 100%, indicating no CC (clear skies) and maximum CC (cloudy/overcast skies), respectively. The main reason for the use of CC data from AccuWeather was that it has high temporal resolution and is freely available.
2.2 Diffuse horizontal irradiance
Irradiance data were collected at the University of KwaZulu-Natal, in Durban, South Africa (29.87 °S; 30.98 °E), at a radiometric station that is located 150 m above mean sea level. A Kipp & Zonen CMP11 pyranometer with shading ball assembly and mounted on a Solys2 tracker was used for obtaining measurements of DH. Measurements were taken every two seconds and averaged over one-minute intervals. The data were manually checked for quality and to identify anomalies. Daily profiles of DH were recorded at one-minute intervals from 7:30 to 16:30 over the same days as the CC data. The DH data were, however, averaged to produce hourly-resolution profiles to match the temporal resolution of the CC data and, so that DHwas known on the hour (e.g. 8:00, 9:00...16:00). Similar to CC, a 'Dh profile' refers to diffuse irradiance as a function of time.
2.2 Cloud type observations
Observations of cloud type were also used in this analysis, in addition to the CC data from Ac-cuWeather. The cloud type data used for this study was provided by the South African Weather Service. Data was obtained by a weather observer located at the King Shaka International Airport, Durban (29.61o S; 31.11o E) and daily cloud type observations were recorded at 06:00, 12:00 and 18:00 Coordinated Universal Time (corresponding to 8:00, 14:00 and 20:00 SAST, respectively), for 2016. This study restricted the analysis to daytime readings, since this is the most useful period for operating solar-powered systems and the time during which clouds interact with irradiance. The cloud codes, together with a description of the cloud types in low, middle and high categories are given in Table 1. The reader is referred to the World Meteorological Organisation (WMO) manual on the observation of clouds and other meteors for a detailed description of the cloud observation procedures and specific cloud genera, species and varieties in each cloud level (WMO, 1975; Xuejin et al., 2011; Kostornaya et al., 2017). The use of cloud type data for this study was intended to investigate the frequently occurring cloud types in each of the clusters that will be produced by the clustering algorithm.
3. Method
3.1 The k-means clustering method
An approach to understanding CC patterns is by classifying and characterising CC profiles using clustering. The objective of a clustering algorithm is to identify groups of similar objects, where objects in a cluster are more similar to each other than objects in different clusters (Halkidi et al., 2001). This study applied the well-known and commonly-used k-means clustering technique (MacQueen, 1967; Azimi et al., 2016; Bae et al., 2017). According to Hartigan and Wong (1979), the aim of the k-means algorithm is to divide m objects in n dimensions into k (where k < n) partitions (or clusters), such that the within-cluster sum of squares is minimised. The similarity between a pair of objects is defined by their distance, where the Euclidean distance is often used as a distance measure (Azimi et al., 2016). In the present study, each object is a daily profile of CC. The partition divides the data into k groups such that each group contains at least one object. Given a set objects, the primary aim of k-means clustering is to optimise the objective function in Equation 1.
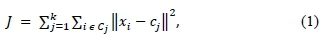
where / is the criterion function, Xiis the ith observation, Cj is the jth cluster centre, Cj is the object set of the jth cluster and k represents the number of clusters. Any norm representing the distance between the data object and the centre of the cluster is denoted by ||*|| (Chu et al., 2012). Classification of daily CC profiles was based on the clusters that were determined by the k-means method.
3.2 Finding the optimal cluster number and cluster validation
The choice of the optimal number of clusters that best represents the data set and the validity of the clusters can be evaluated using the Silhouette Index (SI) (Benmouiza and Cheknane, 2013; Bae et al., 2017). According to Rousseeuw (1987), the SI can be used to quantify the compactness and separation of clusters. Let a(i) be the average distance between object i and all the other members of its own cluster. For another cluster C2, let d(i,C2) be the average distance between object i and the members of C2. Let b(i) be the minimum of d(i,C2) over all the other clusters. Then SI is given by Equation 2.
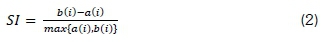
The SI value ranges from -1 to 1 (Rousseeuw, 1987). An SI that approaches 1 indicates an object being 'well-clustered', and an SI approaching -1 indicates that the object is not well suited to the assigned cluster. All SI values are displayed onto a silhouette plot, which is a graphical display of how well an object has been clustered. Computation of the SI is a simple technique that provides a measure of the cluster separation that can be used for the interpretation and validation of clustered data, and that allows for the testing and comparison of various sets of clusters. An SI value of 0.6 or greater is a good clustering result (Benmouiza and Cheknane, 2013; Lleti et al., 2004). The optimal number of clusters was determined by considering the results for various values of k, guided by average silhouette index (SI). The aim was to obtain the highest SI and maximise k, while keeping SI greater than 0.6. The present study, however, recognised the difficulty of this consideration in practice, since there would always be clusters that have members with low individual SI, resulting in a lower SI. Clustering solutions from k = 2 up until k = 10 clusters were, nevertheless, tested. The clustering algorithm was implemented in MATLAB (R2018b) using the Statistics Toolbox (MATLAB, 2018).
4. Results
4.1 Clustering
Clustering was applied to the set of CC profiles and it was found that four clusters ( k = 4) were found to have the highest average SI of 0.72. The SI was, however, considered for two up to ten clusters and where for each k the best of ten runs was taken, all this to verify that this was indeed the best solution for the data. Figure 1 shows how the SI varies for the different clustering solutions. Although, the SI for two clusters (i.e. k = 2) is above 0.75 (and is the highest), this is not considered here as an optimal clustering solution since the aim is to obtain the highest SI and maximise k.
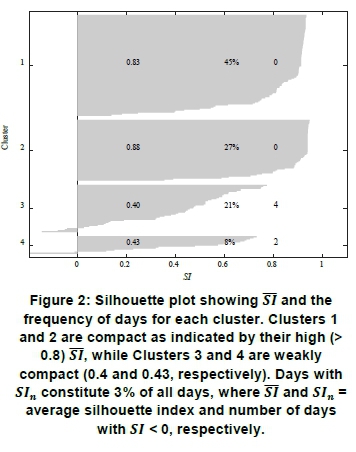
The maximum number of clusters with the next highest SI is, therefore, for k = 4, i.e. four clusters. After k = 4, SI shows a gradual decrease, with increasing k denoting suboptimal clustering solutions for the data. The number of days with SI < 0, denoted as SIn, is shown for each k. Ideally, SIn, would be preferred to be close to zero, but this is often difficult to achieve in practice and therefore SInwas best to be as small as possible. While for k = 5, SIn was the lowest at 4, it did not have the highest SI, rendering k = 4 still the best solution, with SIn= 6. The SI for each day in each cluster is displayed on the silhouette plot in Figure 2 to visually assess the quality of the clusters in terms of their compactness. The respective SI averages for each cluster, together with the frequency (in percentage) and SInin each cluster, are shown on the plot. Clusters 1 and 2 had high SI of 0.83 and 0.88 respectively, indicating that these clusters had a high degree of compactness. The SIn= 0 for both those clusters further indicated that the days were well-suited to their clusters. Cluster 3 and 4 had significantly lower SI of respectively 0.40 and 0.43 because they were less compact than Clusters 1 and 2, with Cluster 3 containing a higher proportion of days. For Clusters 3 and 4, SIndays constituted 3% of the entire data set, suggesting that the clustering solution of k = 4 was indeed a good one, since 97% of days were relatively well-clustered. Furthermore, given that the SI of 0.72, which was well above the 0.6 benchmark, this overall indicated a good clustering solution for the CC data. Cluster 1 contained the largest proportion of days (45%), followed by Cluster 2 (27%). Together, Clusters 3 and 4 contained less than 30% of all days.
4.2 Diurnal CC and associated DH patterns
The clusters produced by the k-means procedure can be represented by the mean profile to provide a physical interpretation of the clusters. From here on, this study refers to Clusters 1 to 4 as Classes I to IV, respectively. For each CC class, containing a set of CC profile members, there were a set of associated Dh profile members. The class mean profiles, i.e., average of all the class members, for CC and the associated DHare shown in Figure 3 and Figure 4. For Class I, the mean CC profile was high throughout the day, denoting cloudy/overcast conditions. The associated DHmean profile was therefore also high, because of cloud scattering. Class II represented sunny conditions given the low mean CC and low DHthroughout the day. The mean CC profile for Class III was relatively high in the morning and ten ded to decrease towards the afternoon. This corresponded to days that started off with some clouds in the morning and became sunny towards the afternoon. The associated DHclass profile remained high throughout the day. Class IV had low CC in the morning and high CC in the afternoon. This indicated that days in this class tended to be sunny in the morning and cloudy in the afternoon; and the associated DHmean profile in this class remained moderately high throughout the day.
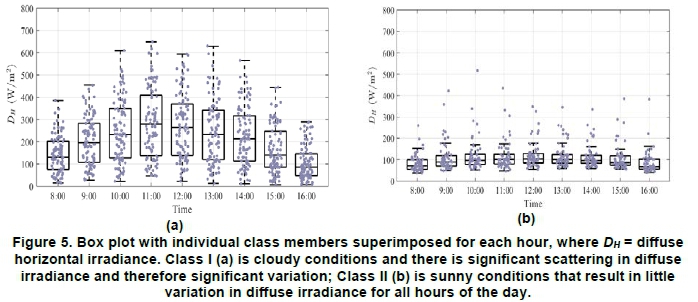
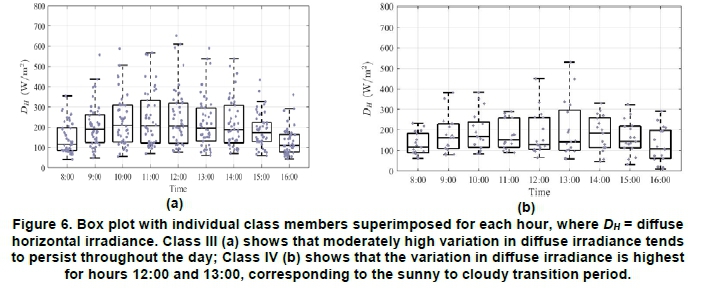
Classes I-IV are the four CC patterns that frequently occurred and, therefore, characterised the cloud conditions in Durban. The following CC characteristics: 'Cloudy', 'Sunny', 'Cloudy AM-Sunny PM' and 'Sunny AM-Cloudy PM' are used as descriptive labels for Classes I to Class IV, respectively. The mean DHpatterns associated with each of the CC classes was what could be expected under these cloud conditions. To establish the extent of the variation of the individual Dh class members from their class mean, box plots are shown in Figures 5 and 6.
Class I displayed significant variation (> 400 W/m2) of individual DHdays. This was expected because of extensive cloud coverage (CC ~ 100%), either in single or multiple layers. Class II, as expected, exhibited significantly lower variation on Dh because of cloud-free skies. For Class III, days tended to have moderately high Dh (100 W/m2 < DH< 300 W/m2) because of higher average CC (20% < CC < 50%), with the morning CC being slightly higher than the afternoon. The associated Dh for this class of days, however, tended to be moderately high throughout the day, including the afternoon when CC was reduced. This pattern suggested that, although the CC cover was reduced, sky conditions were not completely cloud-free. The CC being higher than 10% in the afternoon might have suggested the presence of some clouds, possibly optically thin clouds, resulting in some scattering of Dh.
Class IV days had moderate variation during some hours of the day and high variation during others. The DHvariation was low because of low CC between 8:00 and 11:00. Between 12:00 and 13:00, the variation was significantly higher and was again lower between 14:00 and 16:00. The CC pattern for these days tended to be low in the morning and high in the afternoon. The hours during 12:00 and 13:00 corresponded to the transition between sunny and cloudy conditions. This could be a possible reason for the significant increase in Dh during these hours. Once passed this transition period, CC tended to remain high but stable, resulting in lower Dh variation during the latter hours of the day. Overall for days with mixed cloud conditions, i.e., Classes III and Class IV, significant variation in Dh could be expected even during those hours that experienced low CC. This suggested that days that experienced sunny periods in Classes III and IV behaved differently from days in Class II.
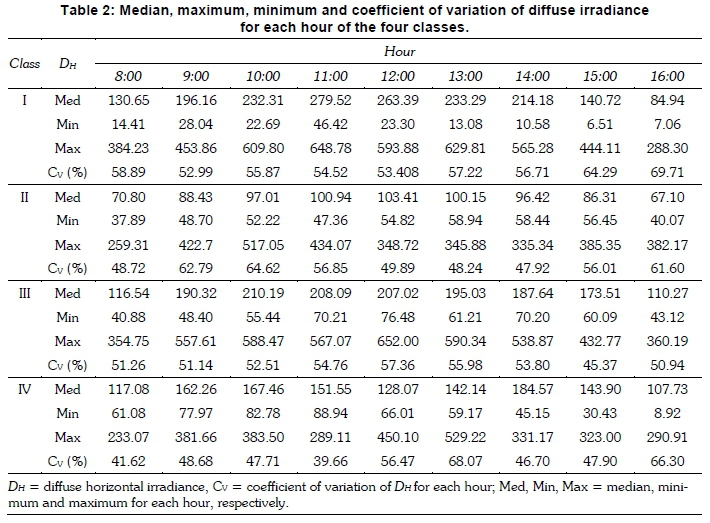
Table 2 shows additional details of the Dh classes, where values of the median, maximum, minimum, and coefficient of variation (Cv) of Dh for each hour are given. The CV is defined as the ratio of the standard deviation to the mean. Class I had high CV, which was expected. There was still a significant variation in DHeven during days consisting of hours with low CC, such as in Classes III and Class IV.
4.3 Comparison with cloud observer data
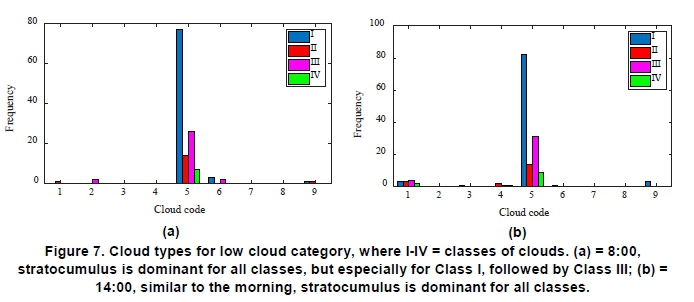
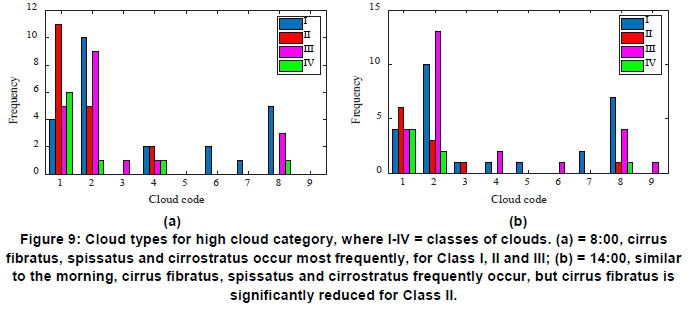
Cloud observer data was correlated with the respective CC classes to investigate the types of clouds that occur in Classes I -IV. The frequency of days and the corresponding cloud type for each class at 8:00 and 14:00 is shown in Figures 7, 8 and 9, for low, middle and high cloud categories, respectively. For cloud types in the low cloud category, stratocumulus clouds dominated for all classes in the morning and afternoon. Class I had the highest frequency, followed by Class III. Classes II and IV had significantly lower frequencies. For cloud types in the middle cloud category, altocumulus translucidus, altocumulus and altocumulus castellanus were the most frequently occurring types. In addition, these clouds occurred mostly for Class I and sometimes for Class III type days. At 8:00, high cloud types frequently consisted of cirrus fibratus and spissatus and cirro-stratus (partial sky coverage). Class II had the highest frequency of occurrence of cirrus fibratus, while Class I and III frequently experienced cirrus spissatus.
Cirrostratus was most common for Classes I and II. For the afternoons, similar high cloud types occurred, but with a significantly lower frequency of cirrus fibratus in Class II. Class IV shows a high frequency of cirrus fibrates in the morning and was reduced in the afternoon. Cirrus uncinus also showed some occurrences for all classes in the mornings. Cir-rostratus (not covering whole sky) frequently occurred in Classes I and III at 8:00 and 14:00.
5. Discussion
The k-means clustering results showed that having four clusters was the optimal clustering solution for the CC data, based on the value of SI. This was also consistent with the clustering in Govender et al. (2018). Classes I and II had high (> 0.8) values of SI, while for Class III and Class IV, the values were significantly lower. Although Classes III and IV were less compact clusters, useful inferences could be made about the diurnal CC and associated Dh patterns. More specifically, partly cloudy days (or days with mixed conditions) can be characterised into more specific patterns consisting of changing cloud conditions, which were identified through the clusters. This is in contrast with the study by Gomasathit (2013), where cloud data was partitioned into only two clusters by the k -means algorithm, however, the aim of this study was to distinguish between clear and cloudy conditions over the Thailand region, hence the reason for only two clusters. However, as demonstrated in the present study, a partition consisting of more than two clusters provided additional information into CC patterns, especially for days consisting of mixed conditions.
The four CC patterns identified through clustering consisted mainly of cloudy (Class I) and sunny (Class II) days, which indicated that the CC patterns in Durban were dominated by these two classes. Days with mixed conditions (Classes III and IV) constituted 29% of the entire data set, implying that these days are less commonly occurring in Durban. The patterns of Classes III and IV offer useful information for solar plant operators where appropriate planning for the use of back-up devices during cloudy periods can be implemented, despite a significantly lower proportion. The Dh patterns associated with each of the CC classes provided valuable information on the how Dh varied under the frequently occurring cloud conditions. As shown in Table 1, Class I had significant variation as indicated by the high values of CV. This was expected since CC for days in this class on average tended to be greater than 80%. There were still high values of CV, indicating increased variation in Dh, even during days consisting of hours with low CC, such as in Class III and Class IV. Class II had lower CV in some hours and higher in others. The high CV in some hours may be attributed to the presence of small clouds during a predominantly clear day, resulting in a significant enhancement in DHthat lasts for a short period. Although these days were classified as 'sunny' by the clustering algorithm, some might have experienced small clouds. These small clouds remain unresolved, so the day is classified as sunny because of the coarse spatial resolution of the NWP model used to produce the CC output. A possible way to overcome this problem would be to use a mesoscale model, if available, to obtain CC measurements, since it would have improved spatial resolution. Nevertheless, these four CC classes (I- IV) with their associated DHpatterns characterised the CC conditions in Durban and provided information of how DHvaried under these different cloud conditions.
To further investigate the variation in Dh by identifying the types of clouds are associated with Classes I- IV, cloud observer data corresponding to each of the four classes were analysed. As shown in Figures 7, 8, 9, a high frequency of occurrence of strato-cumulus clouds in Class I was responsible for the cloudy conditions that usually persist throughout the day. In addition, high frequencies of other cloud types such as altocumulus, cirrus spissatus and cir-rostratus, in the middle and high categories, respectively, is suggestive of Class I days consisting of multiple cloud layers. The variation of Dh was significant as seen in Figure 5(a) because of varying composition, thickness and spatial extent. Middle cloud types are dominated by altocumulus translucidus and castellanus, where these most frequently occur for Class I and sometimes for Class III. Cirrus fibratus is most common type of high cloud on sunny days (Class II), particularly for mornings, and since is translucent, results in less scattering and thus low variation in DH. This is followed by cirrus spissatus, which is generally opaque. The outliers (excursions) in Figure 5(b) for Class II may be caused by the presence of cirrus spissatus, stratocumulus or the altocumulus translucidus and altocumulus cloud types since these are the most frequently occurring types in addition to cirrus fibratus. For Class III, the variation in Dh in the mornings and afternoons may be attributed to the presence of stratocumulus, altocumulus translu-cidus, cirrus spissatus and cirrostratus (not covering whole sky) clouds, because of the high frequency of occurrence. Variation in Dh for Class IV may be attributed to the presence of stratocumulus for the low cloud category, altocumulus translucidus and altocumulus for the middle category and cirrus fibratus for the high cloud category. Although, knowledge of cloud types prevalent in each of the CC classes provide some additional insight in the characteristics of the cloud conditions, these observations are limited to two per day. Automatic cloud observations are required if more frequent observations were to be made. Nevertheless, the cloud observer data was useful in identifying the dominant cloud types occurring for each of the CC classes, and the effect it has on the variation in Dh.
The use of CC forecasts from AccuWeather is useful since it has an hourly temporal resolution, which may be useful in monitoring changes in CC that occur at the hourly time-scale. Although Gov-ender et al. (2018) published initial results on CC patterns in Durban, their analysis was limited to beam irradiance and, thus, did not include diffuse. The results of the present study are therefore useful, since it presents information on Dh, which is equally important for the operation of PVs. In addition, and more useful for a solar plant operator, the CC forecast may be used to forecast Dh for the day ahead, as was done for beam irradiance in Govender et al.
Application of cluster analysis to publicly available CC data revealed patterns that characterised the cloud conditions in Durban. Under these different conditions, it was found that Dh can vary significantly, depending on a various cloud types and their associated properties. Knowledge of these CC and the associated Dhpatterns provides useful information that could possibly assist solar plant operators to better manage plant output by either limiting or increasing the use of back-up devices during sunny and cloudy conditions, respectively.
6. Conclusions
The purpose of this study was to investigate the variation of diffuse irradiance under different cloud conditions. Results showed that, for Durban, there were four dominant cloud cover (CC) patterns: Class I, Class II, Class III and Class IV, which corresponded respectively to cloudy all day, sunny all day, cloudy morning -sunny afternoon, and sunny morning-cloudy afternoon sky conditions. Days in Classes I and II were found to occur more frequently than days in Classes III and IV. The diffuse irradiance patterns associated with each of the classes showed that Class I had the highest variation followed by Class III and Class IV. Days in Class II corresponded to sunny conditions and, thus, had the lowest variation. Analyses of cloud type data showed that stratocumulus (low cloud category), altocumulus translucidus, castellanus and altocumulus (middle category) and cirrus fibrates and spissatus (high cloud category), were the most frequently occurring cloud types responsible for the diffuse irradiance variation within the different classes. Overall, knowledge of these CC and associated diffuse irradiance patterns is useful for solar plant operators, to manage plant output by either limiting or increasing the use of back-up devices, depending on the cloud condition. The results of this study will contribute to the understanding of the diurnal diffuse irradiance patterns under the four most frequently occurring CC conditions in Durban. Furthermore, the combination of clustering CC and correlating the patterns with cloud types is a novel aspect of this investigation. Lastly, the cluster analysis approach used here may be applied to other locations where CC, cloud type and radiometric data are accessible.
Acknowledgements
Acknowledgements to the National Atmospheric and Space Science Programme, University of KwaZulu-Natal, South Africa, for financial support under the postdoctoral research position.
Author roles
Paulene Govender: Conceptualisation of the research, data collection and analysis, writing of the manuscript. Venkataraman Sivakumar: Editing of the manuscript, scientific and technical advice.
References
Accuweather, 2019. https://www.accuweather.com/en/za/durban/305605/hourly-weather-forecas^305605?hour=81. Accessed on 14 August 2019. [ Links ]
Azimi, R. Ghayekhloo, M. and Ghofrani, M. 2016. A hybrid method based on a new clustering technique and multi-layer perceptron neural networks for hourly solar radiation forecasting. Energy Conversion and Management 118: 331-344. http://dx.doi.org/10.1016/j.enconman.2016.04.009. [ Links ]
Bae, K.Y., Jang, H.S. and Sung, D.K. 2017. Hourly solar irradiance prediction based on support vector machine and its error analysis. IEEE Transactions on Power Systems 32(2): 935-945. http://dx.doi.org/10.1109/TPWRS.2016.2569608. [ Links ]
Benmouiza, K. and Cheknane, A. 2013. Forecasting hourly solar radiation using hybrid k-means and non-linear autoregressive neural network models. Energy Conversion and Management 75: 561-569. http://dx.doi.org/10.1016/j.enconman.2013.07.003. [ Links ]
Chaturvedi, D.K. and Isha, I. 2016. Solar power forecasting: a review. International Journal of Computer Applications 145(6): 28-50. https://doi.org/10.5120/ijca2016910728. [ Links ]
Chu, H.J., Liau, C.J., Lin, C.H. and Su, B.S. 2012. Integration of fuzzy cluster analysis and kernel density estimation for tracking typhoon trajectories in the Taiwan region. Expert Systems with Applications 39: 9451-9457. https://doi.org/10.1016/j.eswa.2012.02.114. [ Links ]
Gomasathit, T. 2013. Cloud coverage identification using satellite and k-mean clustering algorithm. Journal of Global Research in Computer Science 4(7): 33-37. [ Links ]
Govender, P., Brooks, M.J. and Matthews, A.P. 2018. Cluster analysis for classification and forecasting of solar irradiance in Durban, South Africa. Journal of Energy Southern Africa 29(1): 59-71. https://dx.doi.org/10.17159/2413-3051/2017/v29i2a4338. [ Links ]
Halkidi, M., Batistakis, Y. and Vazirgiannis, M. 2001. On clustering validation techniques. Journal of Intelligent Information Systems 17:107-145. https://doi.org/10.1023/A:1012801612483. [ Links ]
Hartigan, J.A., Wong, M.A. 1979. Algorithm AS 136: A k-means clustering algorithm. Applied Statistics 28: 100-108. https://dx.doi.org/10.2307/2346830. [ Links ]
Heinle, A., Macke, A., Srivastav, A. 2010. Automatic cloud classification of whole sky images. Atmospheric Measurement Techniques 3: 557-567. https://dx.doi.org/10.5194/amt-3-557-2010. [ Links ]
Jain, A.K. 2010. Data clustering: 50 years beyond k-means. Pattern Recognition Letters 31: 651-666. https://doi.org/10.1016/j.patrec.2009.09.011. [ Links ]
Jury, M.R. 2013. Climate trends in southern Africa. South African Journal of Science 109 (1/2): 1-11. https://dx.doi.org/10.1590/sajs.2013/980. [ Links ]
Jury, M.R. 2017. Climate trends across South Africa since 1980. Water SA 43(4): 297-307. https://dx.doi.org/10.4314/wsa.v44i2.15. [ Links ]
Kottek, M., Grieser, J., Beck, C., Rudolf, B. and Rubel, F. 2006. World Map of the Koppen-Gieger climate classification updated. Meteorologische Zeitschrift 15: 259-263. https://dx.doi.org/10.1127/0941-2948/2006/0130. [ Links ]
Kostornaya, A.A., Saprykin, E.I., Zakhvatov, M.G. and Tokareva, Y.V. 2017. A method of cloud detection from satellite data. Russian Meteorology and Hydrology 42(12): 753-758. https://doi.org/10.3103/S1068373917120020. [ Links ]
Kruger, A.C. 2006. Observed trends in daily precipitation indices in South Africa: 1910-2004. International Journal of Climatology 26: 2275-2285. https://dx.doi.org/10.1002/joc.1368. [ Links ]
Kruger, A.C. and Sekele, S.S. 2013. Trends in extreme temperature indices in South Africa: 1962-2009. International Journal of Climatology 33: 661-676. https://dx.doi.org/10.1002/joc.3455. [ Links ]
Kritzinger K. Policy brief: Solar Photovoltaic Technologies. Available from: https://www.crses.sun.ac.za/files/research/publications/popular-media-and-policy-brief/PV%20Policy%20Brief%20Dec%202017.pdf. Accessed on 17 April 2019. [ Links ]
Lleti, R., Ortiz, M., Sarabia, L. and Sanchez, M. 2004. Selecting variables for k-means cluster analysis by using a genetic algorithm that optimises the silhouettes. Analytica Chimica Acta 515: 87-100. https://doi.org/10.1016/j.aca.2003.12.020. [ Links ]
MacQueen, J.B. Some methods for classification and analysis of multivariate observations. Proceedings of 5th Berkeley Symposium on Mathematical Statistics and Probability; University of California, 1967, 281-297. [ Links ]
Marquez, R. and Coimbra, C.F.M. 2013. Intra-hour DNI forecasting methodology based on cloud tracking image analysis. Solar Energy 91: 327-36. https://doi.org/10.1016Zj.solener.2012.09.018. [ Links ]
MATLAB and Statistics Toolbox Release 2018b. The MathWorks Inc., Natick, Massachusetts, United States. https://www.mathworks.com/help/stats/k-means-clustering.html. Accessed on 13 August 2019. [ Links ]
Quante, M. 2004. The role of clouds in the climate system. Journal de Physique IV France 121: 61-86. https://dx.doi.org/10.1051/jp4:2004121003. [ Links ]
Rousseeuw, P. 1987. Silhouettes: A graphical aid to the interpretation and validation of cluster analysis. Computational and Applied Mathematics 20: 53-65. https://doi.org/10.1016/0377-0427(87)90125-7. [ Links ]
World Meteorological Organization (WMO) 1975. International Cloud Atlas: Manual on the observation of clouds and other meteors (WMO-No. 407). http://www.wmo.int/pages/governance/policy/tech_regu_en.html. Accessed on 20 July 2017. [ Links ]
Xuejin, S., Lei, L. and Shijun, Z. 2011. Whole sky infrared remote sensing of cloud. Procedia Earth and Planetary Science 2: 278-283. https://dx.doi.org/10.1016/j.proeps.2011.09.044 [ Links ]
Zawilska, E. and Brooks M.J. 2011. An assessment of the solar resource for Durban, South Africa. Renewable Energy 36: 3433-3438. https://dx.doi.org/10.1016/j.renene.2011.05.023. [ Links ]
* Corresponding author: +27 (0)31 260 7661; email: GovenderP5@ukzn.ac.za

