


Servicios Personalizados
Articulo
 Inglés (pdf)
 Articulo en XML
 Referencias del artículo
Indicadores

Links relacionados
-
 Citado por Google
 -
 Similares en Google
Compartir

 Permalink
Journal of Energy in Southern Africa
versión On-line ISSN 2413-3051
versión impresa ISSN 1021-447X
J. energy South. Afr. vol.30 no.3 Cape Town ago. 2019
http://dx.doi.org/10.17159/2413-3051/2019/v30i3a5669
ARTICLES
Improving accuracy of wind resource assessment through feedback loops of operational performance data: A case study in South Africa
Pullinger D.I, *; Ali A.II; Hill N.III; Zhang M.IV; Crutchley T.V
ILloyd's Register Group Limited, 27 Gay Street, Bath BA1 2PD, UK. https://orcid.org/0000-0001-9297-239X
IILloyd's Register Group Limited, 27 Gay Street, Bath BA1 2PD, UK. https://orcid.org/0000-0002-2982-8819
IIILloyd's Register Group Limited, 27 Gay Street, Bath BA1 2PD, UK. https://orcid.org/0000-0002-9419-7881
IVLloyd's Register Group Limited, 27 Gay Street, Bath BA1 2PD, UK. https://orcid.org/0000-0003-2997-6739
VLloyd's Register Group Limited, 27 Gay Street, Bath BA1 2PD, UK. https://orcid.org/0000-0003-2577-0880
ABSTRACT
This study addresses two key objectives using operational performance data from most of the Round 1 wind farms connected to the grid in South Africa: benchmarking of wind farm performance and validation of the pre-construction energy yield assessments. These wind farms were found to perform in line with internationally reported levels of wind farm availability, with a mean energy-based availability of 97.8% during the first two years of operation. The pre-construction yield assessments used for financing in 2012 were found to over-predict project yield (P50) by 4.9%. This was consistent with other validation studies for Europe and North America. It was also noted that all projects exceed the pre-construction P90 estimate. The reasons for this discrepancy were identified, with the largest cause of error being wind flow and wake-modelling errors. Following a reassessment using up to date methodologies from 2018, the mean bias in pre-construction predictions was 1.4%.
Highlights:
• Operational wind farms in South Africa compared to preconstruction predictions.
• Energy yield assessments in 2012 averaged 4.9% over-prediction.
• Largest causes of bias wake modelling and long-term windspeed adjustment.
• Modern techniques significantly improve prediction accuracy.
Keywords: operational yield, wind farms, validation, benchmarking, renewable energy.
1. Introduction
Modern wind resource assessment methodologies and approaches have primarily been developed based on experience and assumptions from wind farms in north-west European countries which were the early adopters of wind energy. These models have been modified and adjusted over time to better account for the increasing global spread of wind energy and challenges represented in different climates and geographies. The process of predicting the wind resource and energy yield of a wind farm is continually evolving, with no encompassing standard global approach [1, 2], recognising that an international standard IEC 61400-15 is currently under development. Each practitioner will follow subtly different approaches as the industry refines these estimates over time. While no two wind resource analyses will ever be identical, because of different approaches taken, there are some international standards [3, 4] and many agreed best practices. The effect is that results typically converge, despite differences in methodology.
The South African wind industry is relatively young when compared with the home of the wind resource models in Europe, as large-scale deployment of wind energy only became part of government policy in 2010. This wave of deployments began with South Africa's Integrated Resource Plan [1] and the establishment of the Renewable Energy Independent Power Producers Procurement Programme, which set out the mechanism for connection of wind power to the grid. Since then, 25 wind farms have been founded, with a combined capacity of over 2.4 GW connected to the grid [2].
1.1 Wind resource assessment
To assess the value of a proposed wind farm, a detailed understanding of the site's wind resource is needed. The financial model of the project, which will determine project profitability and viability, is heavily dependent on the revenue generated. Revenue is directly proportional to the amount of energy that can be produced and sold. Energy produced by a wind turbine comes from the wind; hence the need for a wind resource assessment. This assessment is typically broken down into the following steps:
• on-site measured data analysis;
• long-term wind resource assessment;
• wind flow modelling;
• loss assessment; and
• uncertainty assessment.
1.2 Validation studies
Wind resource assessment is a field of engineering that has been evolving rapidly over the last three decades. There have been several previous validations of the accuracy of individual sections and complete wind resource assessments, which then feed into industry best practice. Some validations have been undertaken by individual companies, others through collaborative comparison exercises across the industry. A summary of these studies is given in Table 1.
Of particular interest is the first of these studies [1], which demonstrated that approaches a decade ago resulted in significant over-predictions in yield. Following this study several conclusions were reached, which led to a significant improvement in the accuracy of the industry as a whole. These included:
• more careful assessment of representative long-term reference sources (avoiding inclusion of outlier years);
• a more critical assessment of achievable availability levels;
• better mounting of wind measurement masts including avoidance of 'stub-mounting'; and
• investigation of power performance in complex terrain.
The validation studies performed to date have a very strong bias towards European and North American conditions. It is noted within these studies that, across these two regions, there are significant differences in model accuracy because of the differing climates and also the weighting of the different steps within an energy yield assessment. It is therefore reasonable to consider that predictions in South Africa may also differ in accuracy to the validation studies presented.
All the projects connected to the grid to-date have been assessed in some form or another on the north-western European assumption and wind resource models, most notably the flow model WAsP This study is intended to address one of the key limitations of these models: the lack of validation in South Africa. It will be the first to focus specifically on wind farms in South Africa, and the lessons learned will be compared with findings from the other studies where appropriate.
1.3 Operational yield assessment
It is necessary to have data from operational wind farms to perform a validation of pre-construction energy yield assessments. The present study gained access to data from six of eight of the first wind farms in South Africa (from Round 1). Analysis of the operational data itself is not a simple task and typically includes the following steps:
• data processing;
• data tagging and cleaning;
• generation of idealised performance power-curves;
• long-term wind resource assessment;
• loss assessment; and
• uncertainty assessment.
These are required to generate a robust understanding of the true performance of a project. Each operational yield assessment is only as accurate as the raw data provided and as such there are differences in the accuracy of the results depending on the quantity, resolution and accuracy of the data that has been provided. Operational yield assessments are still subject to some levels of uncertainty, although this level should be significantly reduced when compared with pre-construction estimates as many of the pre-construction assumptions are no longer applicable, e.g., wind-flow modelling uncertainty or wind turbine performance.
1.4 The need for these studies
To date no validation of wind resource assessment approaches has been undertaken in South Africa; the methodology and assumptions made are therefore unproven in this market. By performing a
detailed study of the first wind farms built in the country it will be possible to evaluate, refine and improve confidence in future energy yield assessments:
• owners of wind farms can benchmark their project performance;
• investors in wind farms in South Africa will have increased confidence in the energy yield predictions; and
• wind resource consultants and academia can improve on wind resource assessment approaches to better refine their models and calculations.
The results of this study, while directly applicable to wind farms in South Africa, will also be of high relevance to those in other similar markets. The climate in some regions of the United States and Australia is very similar, and many of the lessons learned with respect to assumptions in new markets will be applicable to other regions of Africa as these increase their deployments of wind energy.
1.5 Summary of objectives
The following objectives for this study have been set to meet the aims:
• benchmarking of each wind farm by key operational parameters; and
• validation of the pre-construction Forecast Energy Sales Reports for each project including identification of causes of errors in predictions. This will include assessment of:
- wind farm availability assumptions;
- long-term wind resource;
- turbine performance; and
- wind flow modelling.
2. Methodology
2.1 Input data
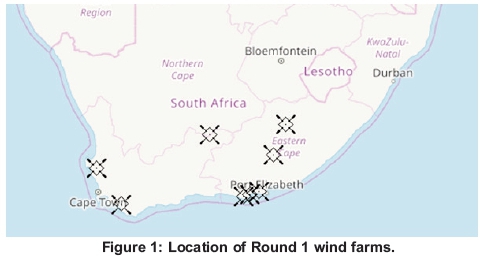
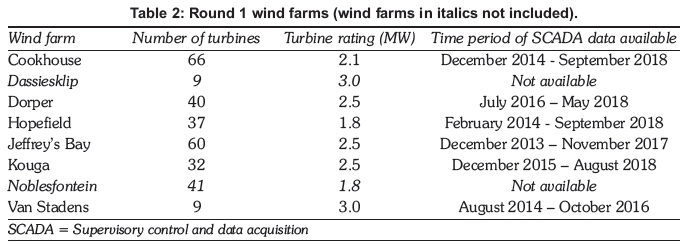
Operational performance data and pre-construction energy yield assessments were available for six wind farms in South Africa, including a total count of 244 wind turbines being analysed. The location and data available from each wind farm is shown in Table 2 and Figure 1.
For each site the following information was provided:
• re-construction energy yield assessment; and
• Supervisory control and data acquisition (SCADA) data including:
- power production;
- wind speed;
- pitch angles;
- rotor RPM; and
- generator RPM.
In addition, for some sites, monthly operator reports and metered data from the on-site substation were provided.
The pre-construction energy yield reports were undertaken by four different consultancies, all of which provide international bankable standard assessments. Within the bid process each of these assessments was reviewed by an independent third party.
Throughout this assessment, all commercially sensitive data was anonymised. Each wind farm was assigned a number for a specific test. All other plots contain subsets of data for illustrative purposes to avoid identification of a specific project, e.g., plots contain eight turbines and could, therefore, be from any of the projects.
2.2 Operational yield assessment
2.2.1 SCADA data processing
The raw ten-minute SCADA data provided came in a variety of formats, particular to the different wind turbine manufacturers. All data was provided in either Microsoft Excel (.csv) or Microsoft Access (.mdb) files, although the file structure of each site differed. These files were manipulated into a standard format before being imported into the specialist SCADA assessment software (SIFT) [2].
It was considered that, following a review of the data, all the sites were of good quality, with overall data recovery above 93.5%.
2.2.2 Production normalisation
Thorough checks were carried out to remove any invalid data and isolate data points where the wind turbines are considered unavailable and/or undergoing performance issues such as power de-rating. The resulting cleaned dataset was considered representative of normal operation. The ten-minute data is categorised using the groupings in Table 3.
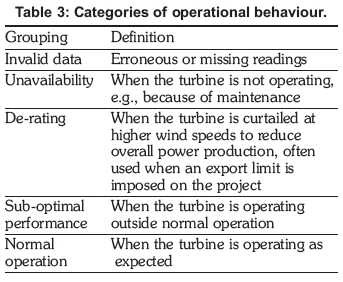
The energy production observed by the SCADA data was then normalised to 100% data recovery monthly - assuming that the production during the period of missing data is proportional to that of the periods when the data is available within the month. This was followed by normalisation to 100% energy-based availability that accounted for periods of unavailability, power de-rating and other operational issues. The normalised production was what could be expected should the wind turbine be operating without any faults or shutdowns and allowed the evaluation of the time- and energy-based availability.
2.2.3 Long-term energy yield assessment
Following the analysis of the short-term data, a long-term correction was carried out via a measure-correlate-predict (MCP) methodology [3]. A series of reference datasets was obtained and analysed, including data from ground meteorological stations and various mesoscale and reanalysis sources. The most suitable dataset selected using a variety of metrics [17, 18, 19], for use in a long-term correlation, was chosen from the following datasets for each farm:
• MERRA2 [13];
• ERA5 [14];
• ERA-Interim [15]; and
• nearby ground stations.
Monthly productions were converted to daily averaged productions of each month before correlation to account for the varying number of days in a month. All MCPs were carried out using a linear regression fit on a seasonally balanced concurrent period and a historic reference period from April 2005 to April 2018. In all cases the strength of the correlation (R2) was above 0.8. This process produced a long-term idealised per-turbine production.
2.3 Validation of pre-construction energy yield assessment
The operational yield assessment allows for a direct comparison of gross-production with that from the pre-construction wind resource assessment (sometimes given as gross yield after wakes). Comparison of these two figures highlights any bias related to modelling approaches undertaken pre-construction (including wind speed bias, flow modelling, wakes and turbine performance).
2.3.1 Wind farm availability
Wind farm availability during the operational period is categorised and quantified in Section 3.2.2. A direct comparison with the assumed figure within the pre-construction yield assessment is therefore possible. It should be noted that the observed estimate is not necessarily representative of the long-term value (as availability over time is considered likely to decrease as the wind turbines degrade) and therefore this is taken into consideration within the comparison.
2.3.2 Electrical loss assumptions
A comparison of the readings from the on-site meter at the grid connection point and the value recorded by each wind turbine allows for derivation of the electrical loss (from turbine to substation). This was obtained through a plot of SCADA against metered yield per-month, with the slope of the trendline giving the electrical loss. This figure is found to be very stable, with a very high correlation coefficient, which is in-line with experience. Months in which data recovery was below 80% for either SCADA or export meter were excluded in order to avoid spurious comparisons between substantially non-overlapping time periods.
2.3.3 Wind turbine performance
Wind turbine performance is currently the subject of much industry investigation as it is known to vary significantly, subject to local conditions. Accounting for turbine performance was not typically done within pre-construction assessments in 2012, but has since become a common practice [23, 24]. This accounts for the difference between the conditions under which the power curve was derived (benign wind flow with standard wind shear and turbulence) and conditions on individual wind farms. Power curve performance tests have been undertaken for several of the turbines within the sites and these have been provided to give an understanding of the true performance. It is considered likely that the turbines in general may underperform the pre-con-struction power curves because of the relatively low turbulence (and hence lower energy in the wind) of the Round 1 wind farms. However, unless this has been specifically measured, it has not been attributed within this category. It has also been possible to identify sub-optimal performance based on the SCADA data as detailed in Section 3.2.2. These have been considered within the assessment.
2.3.4 Long-term wind resource
One feature of early pre-construction assessments in South Africa was that they did not include long-term adjustment of the on-site measured data, as the long-term data available was severely limited. Many Round 1 wind farms had no nearby reference station, or stations that were of insufficient quality. The long-term pre-construction assessment was therefore based purely on a short-term measured wind speed from on-site measurements. This is one source of bias within the assessment. To quantify the bias, it is possible to use the same long-term approach as outlined in Section 2.2.3, simply applied to the period of on-site measurements. This has been done on a per-site basis, based on the information provided within each respective pre-construction assessment. To maintain consistency, the same long-term reference source as selected in Section 2.2.3 was used.
2.3.5 Wind flow modelling errors
The accuracy of the wind flow model was calculated by comparing predicted and observed per-tur-bine yields. A simple correlation was performed to gain a broad idea of how well the model was performing. More detailed evaluation and quantification is carried out by assessing the pattern of production across the wind farm. In many cases, a turbine is situated at the same location as a pre-con-struction mast, and in these situations it is possible to normalise all site production against this turbine location. This relies on a fair assumption that there is no flow modelling error at a turbine, at the mast location, which would hold true if there were little wake effect on this location. Correlating these normalised productions can be used to identify a bias in the wind flow model, e.g., whether the flow model under- or over-predicts change in yield. The errors in the wind flow model have also been plotted against various other variables to check their dependence. These include:
• distance to the flow model initiation mast;
• change in elevation from the mast;
• change in wind speed from the mast;
• deltaRIX - a measure of terrain complexity;
• wake loss; and
• a map of the errors at each turbine location, to ensure that any other spatial variations are considered.
Wake model errors were isolated, where possible, by considering rows of turbines and normalising production against a wake-free turbine location. The error in the production was analysed with reference to the number of rows in the upwind direction: a pattern of increasing error with depth into the array was interpreted as indication of wake modelling error.
2.3.6 Improvements to the flow model
The comparison and any bias within the pre-con-struction assessments was, so far within the analysis, based on the methodology at the time of writing the assessment (typically 2011 or 2012). Wind flow modelling approaches since this time have evolved through ongoing research and development efforts. Original pre-construction estimates were re-run using the latest assumptions and approaches to understand the accuracy of current modelling approaches. Changes included:
• investigation of the impact of the latest wind flow models (now WAsP version 12);
• investigation into the impact of diurnal wind shear;
• investigation of the impact of the latest wake modelling techniques which include an account for varying wake decay constants; and
• application of up to date loss assumptions for South Africa.
These results allow for identifying which areas of bias were already fixed and whether additional work was required to bring the pre-construction assessments in-line with observed performance. The impact of changes in the vertical extrapolation (wind shear) approach could be evaluated because of the characteristics of the sites investigated. The vertical extrapolation for all sites but one was 10 m or less, so any errors were likely to be undetectable. This is unlikely to be the case for newer projects as wind turbine hub heights have increased significantly in recent years, with many sites having extrapolation heights of up to 40 m.
2.3.7 Other errors
This category was included as it may be possible to identify other errors or differences within the assessments. However, attributing these to the categories above was not possible because of the information and confidence within the assessments. This remainder may be the result of a specific other issue, e.g., observed wind turbine degradation. Alternatively, it may be a result of one of the other categories, but one that was not possible to specifically isolate within this assessment.
3. Results
3.1 Yield
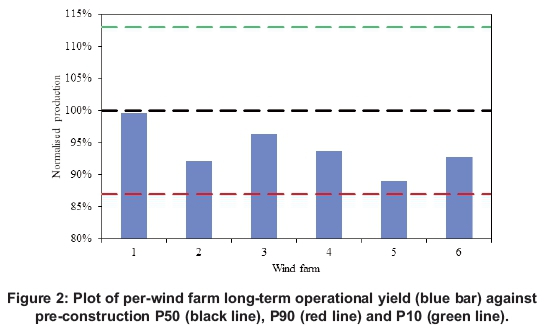
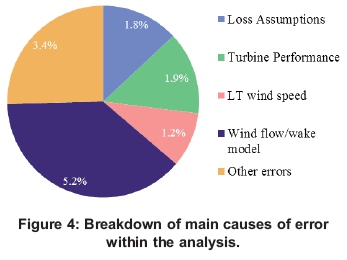
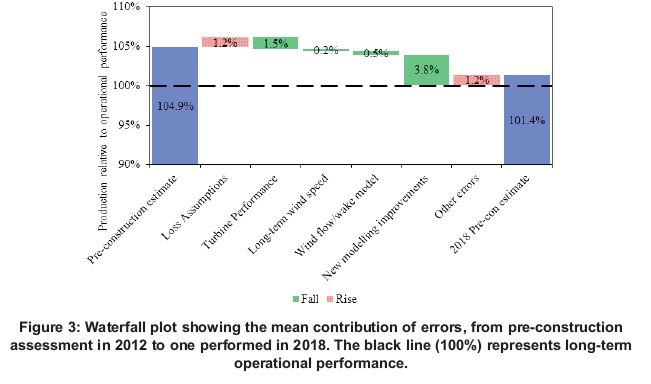
The pre-construction predictions from 2012 in general over-predicted energy yield by 4.9%. A per-site (anonymised) breakdown of the operational energy yield (P50) was compared with each project's pre-construction P50 and P90 in Figure 2. These results were all normalised so that 100% represented the pre-construction estimate and the P90 value was again normalised for direct comparison on a persite basis. All pre-construction assessments over-predicted yield, with all sites exceeding their pre-construction P90 estimate. From the analysis performed, it was possible to identify the causes of discrepancies between the pre-construction assessments and the operational yield. A breakdown of the contribution of each cause (mean) of errors is shown in Figure 3. The mean absolute error is given in Figure 4. These are discussed further in Sections 3.2 to 3.7.
3.2 Loss assumptions
The pre-construction loss assumptions from 2012 resulted in an average under-prediction of the net yield by 1.2%. When the impact of this conservatism was removed, the overall model bias was increased for 2012 assessments. It should be noted that this bias was not consistent across all sites and the magnitude varied significantly (from 0.0% to 5.3%). A breakdown of the mean assumption per loss category is given in Table 4. Also included are the observed value and 2018 typical values.
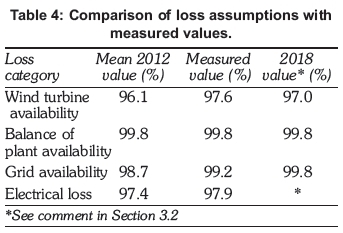
The 2018 values represent long-term assumptions as commonly used in the industry. The measured values for grid are also heavily biased by one project - this should be assessed on a site by site basis. Electrical loss varies widely between sites based on parameters such as total project size and density; the loss should therefore be based on a site-specific assessment and no value is assumed suitable for general use.
3.3 Wind turbine performance
Comparison of the measured power curve with that assumed within the pre-construction assessment demonstrated a consistent over-prediction of yields pre-construction, which was expected as detailed in Section 3.3.3. The range of results was from 0.7% to 3.9%, although this was considered to have potential to increase if additional analysis into site-specific turbine performance loss is undertaken. The mean of the pre-construction estimates was 99.8%, compared to 98.5% from the measured data. One wind farm reported very high levels of turbine under-performance (>3%), which was not possible to investigate in additional detail within this study, while for most sites the wind turbine performance was within normal bounds.
3.4 Long-term wind resource
Following a long-term correction, the average wind speed across the fleet of wind farms during the operational period to date was 99.2% of the long-term average. Wind speeds in the future are therefore anticipated to be 0.8% higher. The variations across the sites were relatively low (future predictions ranging from -0.2% to +2.2% of the recorded period). All the pre-construction predictions from 2012 considered that a long-term adjustment using off-site data would not increase the confidence within the long-term resource assessment. Using the latest methodology, the results demonstrated that this led to significant bias within the assessments. The range of long-term bias introduced was between a 3.9% over-prediction to a 3.8% under-prediction of wind speed, which would have resulted in significant errors introduced within the models. The mean absolute error was 1.9% across the sites. Figure 3 does not show this as a significant factor overall as the wind speed adjustment errors across the fleet cancelled each other out, with some sites experiencing above-average wind speeds and others below-average.
3.5 Wind flow modelling errors
This is identified as the biggest cause of discrepancy with the pre-construction predictions, with a mean absolute error of 5.2%. It was found to be the most consistent across the different sites (ranging from 3.5% to 7.3%). This was investigated on a site-by-site basis. To protect the anonymity of the sites only limited details can be presented here. Two examples of the investigations are given in Figures 5 and 6. These results are a subset of the wind farms (there are no wind farms with only eight turbines) so the results could be from any project. Figure 5 shows the variation of yield through the wind farm. All turbines were normalised against the wind turbine considered to be closest to freestream. This showed that the pattern was similar, although the magnitude of the variation was underestimated within the flow model, resulting in an overall over-estimation of project yields.
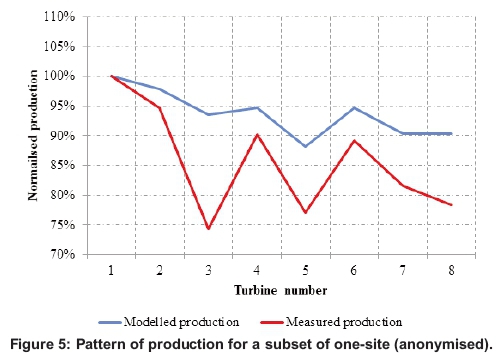
Figure 6 shows the variation of performance where each turbine is associated with the most representative mast (undertaken within the pre-con-struction assessment). Within each cluster the yield was normalised against a turbine at the approximate mast location. A fit with a slope equal to one would indicate a site where the model predicts the magnitude of change well. Within the example site, Figure 6 illustrates that the wind flow model is performing well with the slope between operational performance and predicted performance of 0.9929. Coastal sites appear to experience significantly higher wind flow modelling errors than those inland, which can be attributed to three main factors:
• wake modelling: these sites' wake model results are significantly poorer than those inland;
• wind flow model: from site specific investigations, the wind climate varies significantly across the site because of the step change in external conditions; and
• wind turbine performance: the flow conditions coastally are poorly understood, and it is therefore anticipated that there may be higher levels of turbine performance loss than would be typically calculated. The power performance test results provided support this conclusion of high impact and variability.
3.6 Improvements to the flow model
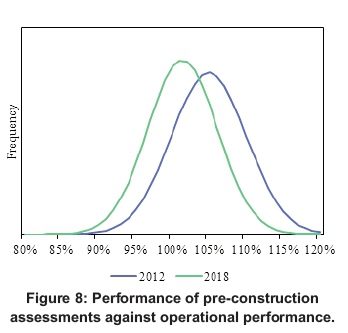
It was found that, following the recalculation of pre-construction assessment with newer methods, there was a significant improvement in the yield predictions. Figure 7 shows the change in yield caused by the different adjustments of methodology.
This allowed for comparison of 2018 pre-con-struction yield predictions with the operational yield. The 2018 pre-construction assessments resulted in an overall over-prediction of 1.4%, a significant improvement on the result presented in Section 4.1 for 2012 (4.9%). The value is also in line with international validation studies from 2017 as detailed in Table 1. Figure 8 shows that the spread of results from 2018 assessments was also lower. While this study did not focus on the overall uncertainty, results suggested that the improved accuracy in 2018 was also more repeatable.
3.7 Other errors
After the errors above were attributed to specific causes there was a remainder on many sites. This was likely caused by one of the reasons discussed in Sections 3.2-3.6, but it was not possible to categorise or isolate the cause. All the analysis is subject to limitations and uncertainty and therefore this remainder also represents the confidence in the analysis.
4. Conclusions
When comparing the overall bias in the pre-con-struction predictions from 2012 (over-prediction of 4.9%) to other validation studies (Table 1) it can be seen that these results are in line with what would be expected at that time. Assessments made in 2018 are a significant improvement on those from 2012 (Figure 8). There remains a small bias within the sample studied (over-prediction of 1.4%) although with a reduced spread, suggesting that the improved accuracy is also more repeatable.
The primary causes of bias, and an estimate of the magnitude of error from this cause, are:
• loss assumptions (0.1 to 5.0%) detailed further in Table 4;
• turbine performance losses (1 to 4%);
• long-term wind speed adjustment (0.2 to 3.9%);
• wind flow modelling error (0.9%);
• wake modelling error (0.6 to 5.7%); and
• coastal site modelling: coastal sites performed significantly worse than those inland (details cannot be provided to protect anonymity). The impact of coastal effects is considered to be a large contributor to the 'other' category of discrepancies (potentially in the order of 5%).
Acknowledgements
The authors would like to thank the wind farm owners who provided their data to the study: Kouga Wind Farm; Dorper Wind Farm RF (Pty) Ltd; Globeleq South Africa Management Services (Pty) Ltd; Africoast Energy (Pty) Ltd; Umoya Energy (Pty) Ltd; and Cookhouse Wind (Pty) Ltd. Thanks also to Staffan Lindahl, founder of Lindahl Ltd. and producer of the SIFT operational SCADA analysis software (https://www.lindahl.ltd/sift), for the invaluable software and also great customer service.
All MERRA-2, ERA-Interim and ground station datasets were downloaded using WindPRO software v3.1.617 developed by EMD International A/S: http://www.emd.dk or http://www.WindPRO.com. The ERA5 data has been generated using Copernicus Climate Change Service Information 2018. The authors acknowledge the Global Modelling and Assimilation Office (GMAO) and the GES DISC (Goddard Earth Sciences Data and Information Services Center), as well as the European Center for Medium-Range Weather Forecasts for the dissemination of MERRA and ERA-Interim.
Author roles
D. Pullinger: Research formulation, data collection, data analysis and write-up
A. Ali: Data analysis
N. Hill: Analysis of long-term wind data, proof reading
M. Zhang: Data collection, analysis and quality assurance
T. Crutchley: Analysis, quality assurance, supervision and write-up.
References
[1] Prasad, D. & Bansal, R.C. 2011. Technologies and methods used in wind resource assessment. Handbook of Renewable Energy Technology, Singapore, World Scientific. 69-98. [ Links ]
[2] Prasad, D. , Bansal, R.C. & Sauturaga, M. 2009. Some of the design and methodology considerations in wind resource assessment. IET-Renewable Power Generation 3(1): 53-64 [ Links ]
[3] International Electrotechnical Commission. 2005. IEC 61400-12-1 (2005) Power performance measurements of electricity proucing wind turbines. [ Links ]
[4] MEASNET. 2016. Evaluation of site-specific wind conditions (version 2). [ Links ]
[5] Department of Energy, South Africa. 6 May 2011. Integrated resource plan for electricity 2010-2030. [ Links ]
[6] SAWEA. Facts and Figures. [Online]. Available: https://sawea.org.za/stats-and-facts-sawea/. [Accessed 19 September 2018]. [ Links ]
[7] Tindal A. , Harman, K. , Johnson, C. , Schwarz A. & Garrad, A. , 2007. Validation of GH energy and uncertainty predictions by comparison to actual production. AWEA Wind Resource and Project Energy Assessment Workshop, Portland USA. [ Links ]
[8] Spengemann, P , & Borget, V 2017. Review and analysis of wind farm operational data: Validation of the predicted energy yield of wind farms based on real energy production data. DEWI Group. [ Links ]
[9] Cox, S. 2015. Validation of 25 offshore pre-con-struction energy forecasts against real operational wind farm data. EERA. [ Links ]
[10] Mortensen, N. G. , Nielsen, M. , & Ejsing Jorgesnsen, H. 2015. Comparison of resource and energy yield assessment procedures 2011-2015: What have we learned and what needs to be done? EWEA. [ Links ]
[11] Stoelinga, M. , & Hendrickson, M. 2015. A validation study of Vaisala's wind energy assessment methods. Vaisala. [ Links ]
[12] Natural Power. 2015. Energy yield assessments and validaton studies. Natural Power, Stirling UK. [ Links ]
[13] Kruger, F , Horodyvskyy, S. , & K. Monnich, K. 2016. Comparison of pre-construction energy yield assessments and operating wind farm's energy yields. WindEurope Summit 2016 - DEWI. [ Links ]
[14] DNV-GL. 2017. Wind power project performance white paper: 2017 update [Online]. Available: https://www.dnvgl.com/publications/wind-power-project-performance-july-2017-98374. [ Links ]
[15] Lindahl Ltd, 2019. SIFT Operational performance software. Lindahl Ltd, [Online]. Available: https://www.lindahl.ltd/sift. [ Links ]
* Corresponding author: * Tel: +44 (0)330 414 1020; email: david.pullinger@lr.org

