


Services on Demand
Article
 English (pdf)
 Article in xml format
 Article references
Indicators

Related links
-
 Cited by Google
 -
 Similars in Google
Share

 Permalink
Journal of Energy in Southern Africa
On-line version ISSN 2413-3051
Print version ISSN 1021-447X
J. energy South. Afr. vol.30 n.2 Cape Town May. 2019
http://dx.doi.org/10.17159/2413-3051/2019/v30i2a6293
WINDAC 2018 CONFERENCE PAPER - NOT PEER-REVIEWED
doi: https://dx.doi.org/10.17159/2413-3051/2019/v30i2a6293
Assessing the value of improved variable renewable energy forecasting accuracy in the South African power system
J. WrightI, *; G. LandwehrI; E. ChartanII
ICouncil for Scientific and Industrial Research Energy Centre, Meiring Naudé Road, Brummeria, Pretoria, South Africa. https://orcid.org/0000-0002-5412-2682; https://orcid.org/0000-0001-6979-6578
IINational Renewable Energy Laboratory, 15013 Denver WPkwy, Golden, CO 80401, USA https://orcid.org/0000-0001-6007-1917
ABSTRACT
The value associated with an improved variable renewable energy (VRE) forecast has been quantified in this research. The value of improved VRE forecasts can increase with increasing VRE penetration levels as well as the range of this value becoming wider. This value also saturates with high levels of improved VRE forecasts as there is relatively lower impact of improving VRE forecasts further. This paper discusses how the improvement of VRE forecasting could impact the South African power system and representative United States power system jurisdictions.
Keywords: forecast, weather systems, uncertainty, production-cost model, day-ahead, real-time
1. Introduction
Historically, South Africa has been heavily reliant on coal-fired electricity generation, primarily as a result of advantageous technology economics and significant domestic resource availability. As a result of international commitments and local policy directives, the use of coal is likely to be limited in the future (Department of Environmental Affairs (DEA), 2011, 2017; United Nations Framework Convention on Climate Change (UNFCCC), 2016). Furthermore, this decline is in line with the newly released draft integrated resource plan (IRP) for 2018 showing the least-cost solution replacing coal with wind and solar. Combining this with the planned decommissioning of existing coal generation capacity, an expected increase in future electricity demand and the considerable wind (and solar) resource availability (as well as technology cost reductions already realised and expected in future); South Africa is likely to deploy a considerable amount of variable renewable energy (VRE) in the form of solar PV and wind in the future.
Long-term expansion plans in South Africa also indicate that VRE contributions of 20-30% of energy demand by 2030 and 30-70% by 2050 are being planned for (Department of Energy (DoE), 2016; Wright, Bischof-Niemz, et al., 2017; Wright, Bishof-Niemz, et al., 2017). As VRE penetration levels increase, the accuracy and confidence in forecasting of VRE becomes more important. As a result, one of the most challenging issues for a system operator (SO), is maintaining grid stability and security of supply as the energy mix diversifies. In the past, VRE was considered an unpredictable energy source fully dependent on the varying weather conditions and has thus not contributed to system reliability (adequacy or security). Nowadays, due to increasing penetration of VRE on many power systems globally (International Energy Agency (IEA), 2017), VRE forecasting is becoming critically important as SOs better understand VRE resources contribution to system reliability whilst better scheduling supply-side resources to meet residual demand and ancillary services requirements (reserves).
A pre-defined set of weather systems affect a large proportion of the already installed VRE facilities in South Africa including 1) the coastal low pressure cell that present on the South East coast and results from the clockwise motion of frequently approaching cold fronts; 2) the 'Berg wind', which is effectively an entrenched high pressure cell that present on the east coast and brings in warm air in an anti-clockwise motion; and 3) cloud build-up on the west coast, including mention of the anomalous low-level jet (LLJ) resulting in strong diurnal cycles in wind speed. The current VRE forecast uncertainty associated with these localised weather systems at a range of pre-defined time scales (real-time and day-ahead) is quantified using a meteorological approach. From this, expected resource profiles are applied to determine annual energy productions for various forecast uncertainty levels.
Generally speaking, the economic value of VRE forecasts in all weather systems can become considerable but does saturate after a certain relative level of improvement. This paper combines the expected accuracy of VRE forecasts for a range of South African weather systems with a production-cost model of the South African power system to determine the economic value of VRE forecasts at a national scale for a range of VRE penetration levels. It then attempts to compare this to a similar utility in the USA.
2. Background
2.1 South African power system overview
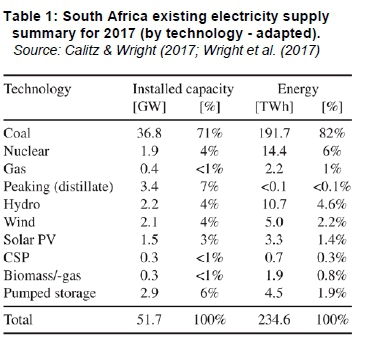
South Africa's installed capacity and electrical energy mix is summarised by resource type in Table 1 (for 2017). The South African electricity mix is currently dominated by coal-fired generation capacity complemented by minor nuclear as well as domestic and imported hydro generation capacity (and pumped storage). A small amount of peaking capacity in the form of open-cycle gas turbines also exists, predominantly run on distillate (diesel fuel), whilst renewables thus far play a very small role in the energy mix.
Although the role of VRE resources has historically been quite small in South Africa, they have ramped up considerably in recent years from a very low base as shown in Figures 1-3. By the end of 2017, South Africa had 3.5 GW of solar PV and wind, generating a total of 8.3 TWh of electricity combined, contributing 3.5% to electrical energy demand. An additional 4.0 GW of VRE is expected by 2021 which would then contribute 17-19 TWh (6-7% of energy demand).
2.2 Error metrics to be used
Error metrics are commonly used to express differences between two time series, namely the predicted and measured value (i) as shown in Equation 1.
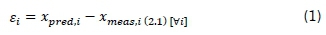
There are a number of such common metrics, a few of which will be presented in the sub-sections which follow (Lange & Focken, 2005).
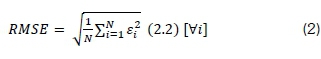
2.2.1 Root mean square error (RMSE)
Although an initial and rudimentary indicator, RMSE can be used to understand different error sources. It can be described as shown in Equation 2 (Willmott, 2005).
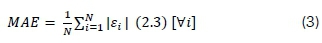
2.2.2 Mean absolute error (MAE)
Mean absolute error (MAE) is the unaltered magnitude, i.e. absolute value, of each difference in a time series. It is described as shown in Equation 3 (Willmott, 2005). MAE can be considered the most natural and unambiguous measure of average error magnitude. For this reason, and for the purposes of this study, MAE is considered as in Equation 3.
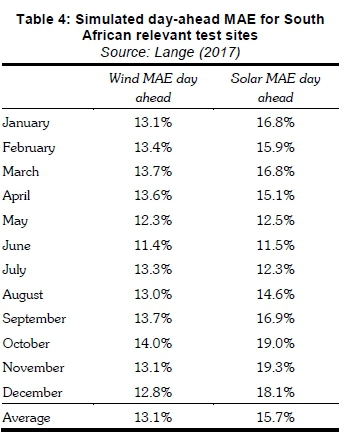
2.3 Impact of weather systems on forecasting errors in South Africa
The expected uncertainty associated with VRE forecasts in South Africa is highly dependent on localised weather systems. Based on this, and keeping in line with MAE values generated from the CSIR semi-operational VRE forecasting model, Table 4's MAE values per resource have been used in the PLEXOS modelling framework (guided by Energy and Meteo Systems intra-day and day-ahead high level forecasts for existing wind and solar PV generators).
Similarly, the values given in Table 5 are relevant for the indicative United States power systems considered.
3. Modelling approach
3.1 System level valuation of improved VRE
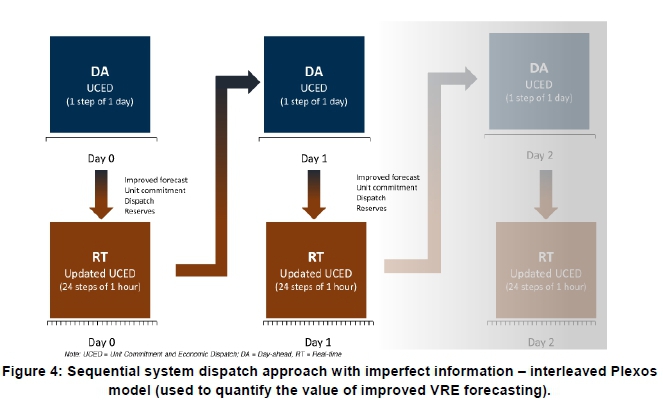
In the context of this paper, production-cost modelling is utilised to quantify the value of VRE forecasts. This is an optimisation exercise which minimises total system costs by incorporating all relevant technical and financial operational characteristics of the supply and demand-side resources present in the power system. The approach taken is similar to that in (Hodge et al., 2018; Wang et al., 2016). The production-cost model applies a two-step sequential approach to quantify the value of the VRE forecast initially. Historically, SOs made decisions with imperfect information on the demand forecast too but for the purposes of these investigations, no demand uncertainty is considered (it is expected that the greatest variability from day-ahead prices to real-time prices is the VRE energy).
The production-cost model co-optimises energy and reserves on a day-ahead basis (hourly-resolution) while solving the unit-commitment and economic dispatch problem - i.e. which units should be online and at what levels they should be dispatched once online. Following this, it solves the real-time (also hourly-resolution) unit-commitment and economic dispatch problem using the day-ahead outcomes in which certain generating units are considered committed (typically inflexible plants with large minimum up/down times). The real-time run is solved by allowing unit-commitment and redispatch of flexible supply resources considering the 'actual' VRE supply on-the-day. This is shown in the overview in Figure 4.
One can now establish the total system production costs considering 'actual' VRE supply. This allows one to establish a cost difference too between day-ahead and real-time total system costs which establishes a cost-adder. As renewable energy increases, it makes up the largest portion of uncertainty.
Although the above establishes the total production costs that could be expected as a result of certain VRE penetration levels, it does not necessarily establish the value of an improved VRE forecast. An improved VRE forecast would entail a comparison of the total production cost of the real-time outcomes for a particular VRE penetration and VRE forecast assumption relative to one in which the VRE forecast is improved. The tool used to implement the approach to quantify this value of the VRE forecast in this paper is PLEXOS (Energy Exemplar, 2017).
3.2 Scenarios
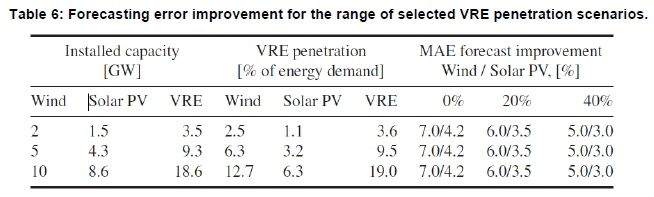
Selected representative scenarios were chosen to represent the expected short-term to medium-term penetration levels of VRE in South Africa. These are summarised for VRE resources in Table 6. Relative to the expected forecast uncertainty, a 20% and 40% forecast improvement over the 0% state of the art forecast for both solar PV and wind is considered.
4. Input assumptions
A representative South African power system is considered and has been summarised in Table 1. The value of improved VRE forecasts is highly dependent on the complementary energy mix and is thus dependent on the jurisdiction within which the analysis is undertaken. Therefore, a valuable contribution of this work is characterising the value of VRE forecast improvements for the South African power system (which has not yet been seen in the literature). The intention is to mimic the South African power system using estimated generator technical characteristics and provide an indication of the system value that could be realised as VRE penetration levels increase.
4.1 South African demand profile
The demand profile considered is based on a typical South African demand profile and is shown graphically in Figure 5.
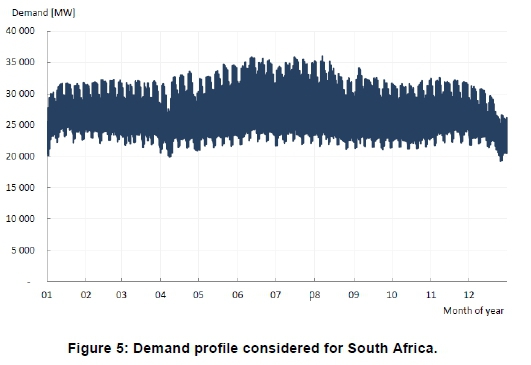
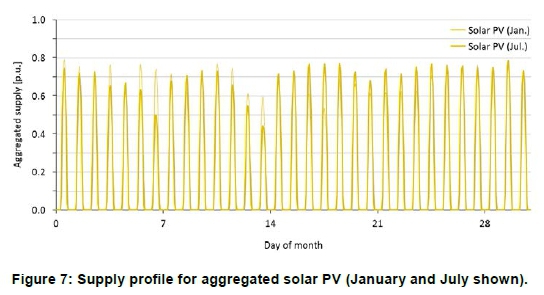
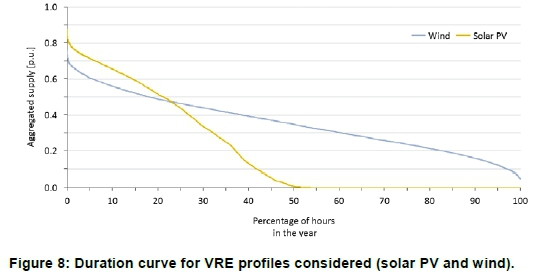
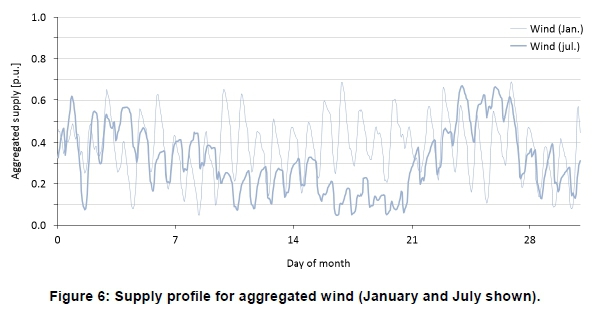
The South African power system is relatively stable throughout the year but with a distinct winter peak (June-August). The peak demand for the profile considered is 36.0 GW with a minimum demand of 19.2 GW and annual energy of 243 TWh. Profiles for wind and solar PV are based on the national level profiles established in (CSIR; SANEDI; Fraunhofer IWES; Eskom, 2016), based on 27 supply areas in South Africa. These are summarised in Figures 6 and 7 as temporal profiles (showing two representative months - minimal seasonality) and in Figure 8 as duration curves. The associated VRE forecast uncertainty is derived from actual recent experience as summarised in Table 4. These are utilised in the production-cost modelling approach previously described as the basis for VRE forecast uncertainty.
4.2 VRE data sources
As required for the Plexos modelling framework inputs, a Wind Atlas of South Africa (WASA) mast-measured three-year-averaged wind timeseries was used. The WASA mast position was selected to provide a wind profile that is representative of the best wind resource in South Africa. A simple Vestas V112 power curve was used to determine the theoretical power production at this position. From a solar perspective, a two year averaged measured solar PV power production timeseries was used for the CSIR-installed PV plant at the CSIR campus in Pretoria. In each case, forecast values were simulated based on the values displayed in Table 2.
For representative United States ISOs, wind forecasts were taken from the WIND toolkit, which is statistically created. State-of-the-art forecast accuracy was mimicked by reforecasting the years 2007-2013 using industry-standard techniques. A wind power forecasting system based on numerical weather prediction was developed for Xcel Energy to optimise grid integration. This system is solely a forecasting system and focuses on Xcel Energy's specific requirements. It is not publicly available.
5. Findings
5.1 South Africa
The production cost savings as a result of forecasting improvements of 20% and 40% are summarised in Figure 9. These are primarily as a result of an improved forecasting of variable solar and wind resources which assists in not having to unexpectedly activate reserves and run more expensive units relative to what was expected by the system operator.
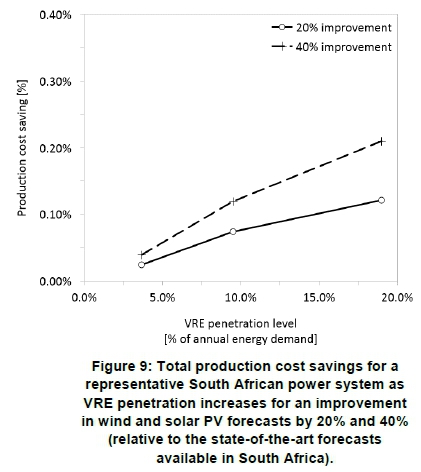
The value of VRE forecasts can become considerable but does begin to saturate after a certain relative level of improvement. Only the expected penetration level of VRE in South Africa in the short-to-medium term has been considered, so this saturation point has not yet been determined, but from Figure 9 this is starting to become evident already (only up to 20% VRE penetration has been tested). Further work into evaluating the value of improved VRE forecasts for higher penetration VRE scenarios will be pursued in future.
As can be seen Figure 9, the value of a 20% improved forecast relative to the state-of-the-art South African VRE forecast as is 0.02-0.12% of total production costs as VRE penetration increases from 3.6-19.0%. Similarly, the value of a 40% improved VRE forecast is 0.04-0.21% as VRE penetration increases from 3.6-19.0%. At the existing level of VRE penetration in South Africa (3.6%), the absolute production cost savings are USD 1.4 million per year for a 20% improvement and USD 2.3 million per year for a 40% improvement.
5.2 Comparison of results from South Africa and USA
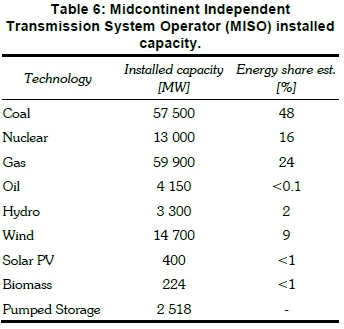
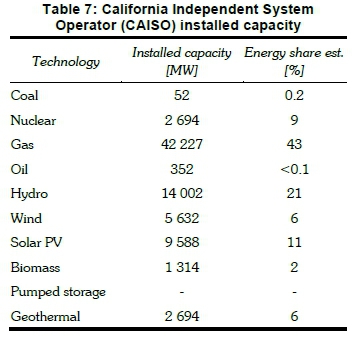
Following a brief review of the investigations undertaken in (Wang et al., 2016), the outcomes seen for the South African power system in this paper are compared to representative power systems in the USA - the California Independent System Operator (CAISO) and the Midcontinent System Operator (MISO). The installed capacity and estimated energy mixes of these two power systems are shown in Tables 6 and 7. Using these as a basis, wind and solar capacity was added with varying penetration ranges of 12-56% whilst considering improvements in the forecast of 0%, 20% and 40%.
For the relevant range considered (10-20% VRE penetration) and a 20% forecast improvement, the representative CAISO power system demonstrates total operating cost savings of =0.2% whilst that of MISO shows savings of =0.1-0.2%. For a 40% improvement in the forecast, the CAISO system shows total operating cost savings of 0.25-0.40%, whilst that of MISO shows savings of 0.3-0.4%.
These outcomes show slightly higher relative production cost savings when compared to the South African power system analysed in this paper.
More specifically, with regard to MISO, as that energy mix is closer to that of South Africa (coal-dominated), whilst the CAISO energy mix has more flexible gas-fired capacity
6. Relevant South African weather systems and their impact on energy forecast MAE
There are a number of under-researched weather systems affecting a large proportion of the already installed VRE generation facilities in South Africa. With further investigation and better understanding, this will result in improved VRE forecasting. As an introduction to these anomalous weather systems, it is necessary to discuss the variable resource energy potential. It is clear that the variable resource potential in South Africa is extremely high. These potentials significantly exceed the current and the expectable future demand. Wind turbines could be operated with extraordinarily high capacity factors above 30% in locations all over the country, while some areas even offer capacity factors around 40%. In other words, more than 80% of South Africa's land mass has enough wind resources for low-cost wind energy (CSIR; SANEDI; Fraunhofer IWES; Eskom, 2016).
Since South Africa is below 15 degrees south of the equator, it does not experience cyclostrophic winds where the Coriolis force tends towards zero, but rather experiences gradient winds resulting from the balance between the pressure gradient force and the Coriolis force. In areas where the pressure gradient force exceeds a certain amount, there is ageo-strophic flow across isobars. At low levels, wind has a cross isobaric component causing convergence into a low pressure and divergence from a high pressure cell (Villers, 2011). This typically occurs in a clockwise direction in the southern hemisphere for the low-pressure 'trough' and in an anti-clockwise direction for the high-pressure ridge. This movement of wind results in a sinusoidal movement across South Africa which can move up and down in an ad-hoc manner at different times of the year.
6.1 High pressure cells
There are three major high pressure cells that are well developed over South Africa, namely the South Atlantic anti-cyclone, the Kalahari high pressure cell, and the South Indian anti-cyclone. During summer, the two anti-cyclones tend to move southwards with the heat equator and effectively block mid-latitude cyclones (MLCs) from penetrating the interior whilst the Kalahari high pressure cell remains generally fixed over Northern South Africa with a well-developed low existing over the Western part of South Africa (Hahman, 2017) In winter however, the subtropical high pressure cells migrate northwards due to friction between the cooler polar easterlies and warmer sub-tropical westerly's. This effectively allows the MLCs to penetrate the interior (Hahman, 2017).
6.2 The coastal low pressure cell
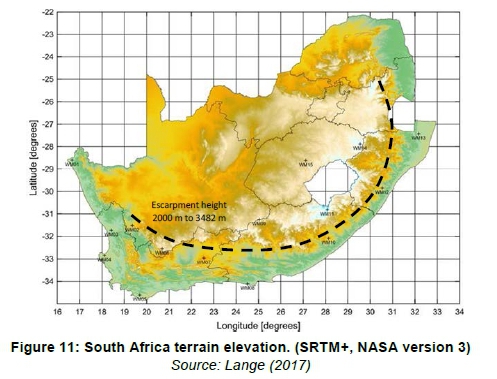
Off the east coast of South Africa, a low pressure cell is frequently experienced and its depth is dictated by the a subsidence inversion at the escarpment (as indicated in Figure 11) and separates warm offshore air from cooler surface maritime air (Lange, 2017). The impact of the escarpment and common travelling depressions around South Africa pose complex weather and resulting variable resource forecasting challenges.
In general, there are two major travelling low-pressure depressions that affect South Africa's climate, resulting from the primary global circulations due to the movement of energy between areas of a heat surplus to areas of a heat deficit:
• Mid latitude cyclones are characterised by families of low pressure systems that move along the westerly wind belt and last about six days. These depressions have four stages. namely initial, mature, occluded and dissipating. They occur throughout the year but only really affect South Africa in the winter when the sub-tropical highs move north, and the 'cold snap' associated with them can result in significant increases in power usage for heating Lange (2017). Although relatively well known, there are numerous permutations in which the MLC can proceed and wind speeds and their directions fluctuate depending on whether the cold front or warm front is moving past a particular point. As a result this poses an energy forecasting challenge and these permutations need to be clearly outlined in any VRE forecasting model.
• Tropical cyclones are characterised by ocean temperatures above 27°C, high humidity, unstable air and very steep low-pressure gradients, strong upper air divergence, and Coriolis force between 5° and 25° N/S of the equator. Typically such cyclones form over tropical oceans moving in the tropical easterlies and have erratic pathways, thus increasing the difficulty in energy forecasting. Only those moving into the Mozambique Channel and influenced by the warm Mozambique current have an impact on South Africa's weather, with destructive winds occurring over Limpopo, Mpumalanga and KwaZulu-Natal provinces. Characteristically, however such cyclones do break up over land and thus there is a lesser impact on these can occur in late summer and early autumn between November and April in South Africa (Lange, 2017).
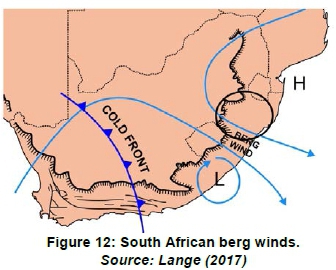
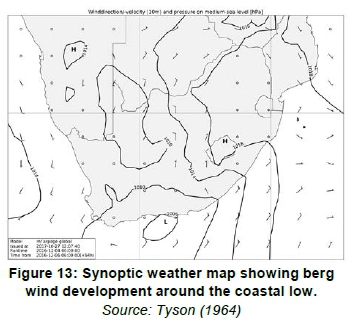
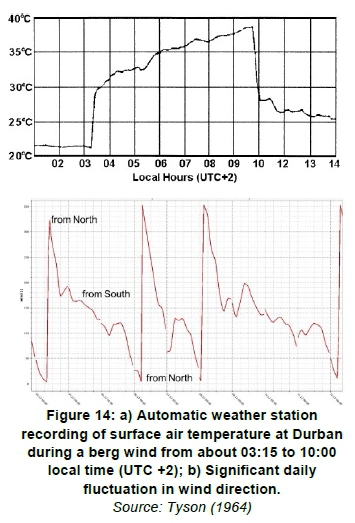
6.3 The berg winds
The coastal climate of South Africa experiences an annual anomaly in which the highest temperatures of the year occur in the winter season and are accompanied by the so-called berg (mountain) winds, which result from the impact of the mid-latitude cyclone (Tyson, 1964). A berg wind is the local name for the East coast localised offshore Föhn-type wind (Lange, 2017), in which moist air resulting from the established coastal low and strong Kalahari high pressure is lifted over the escarpment and loses its moisture in the high altitudes, becoming warm and dry as it moves towards the coast. These are dry, hot winds which blow out of the interior and occur mainly between April and September, most frequently along the east coast (Tyson, 1964). See Figures 12 to 14.
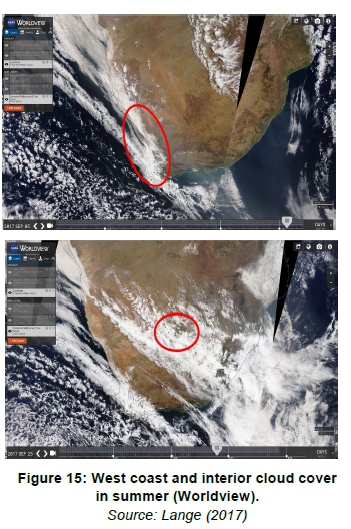
6.3Cloud build-up on the west coast and interior
During the summer months when the South Atlantic and South Indian anti-cyclones tend to move southwards with the heat equator and block mid-latitude cyclones (MLC's) from penetrating the interior, the Kalahari high pressure cell is weaker but remains generally fixed over central northern South Africa with a well-developed low pressure system over the western part of South Africa, moving south and north during this time (Lange, 2017). The cold Ben-guela current, higher summer temperatures and the presence of this low pressure result in increased cloud cover over the west coast and interior due to the interaction of cold ocean air with the warmer continent, as shown in Figure 15. This leads to large uncertainty in forecast since numerical weather models have different opinions and accuracies when predicting cloud formation and movement in these areas (Lange, 2017).
6.4Low-level jet
The Wind Atlas of South Africa has a wind met-mast situated on the west coast (WM01). Based on longterm data measurement from this mast, it has been documented that there is a very strong diurnal cycle in wind speed. Typically this results in a nocturnal low-level jet (LLJ), simply defined as a narrow current of fast-moving air. This LLJ is usually caused by an inertial oscillation or an imbalance between the stress-divergence, pressure gradient force and Cori-olis force as night falls. This normal explanation of a boundary layer LLJ does not seem to hold for the one identified on the west coast of South Africa, since it is present mostly during the daytime hours and not nocturnally. It is thus speculated that there is a 'quasi-permanent' LLJ above these areas, which gets mixed down near to the surface during the day. Furthermore, on certain days, the jet is unusually not present (Hahman, 2017). LLJs can significantly increase the energy generation from wind energy generators and thus, if misunderstood, can have a considerable influence on how well energy is predicted from influenced facilities. Once understood, this anomaly can then be applied to similar occurrences globally and in turn improve short-term (day-ahead and intraday) energy forecasting from such sites.
7. Conclusions
The value associated with an improved variable renewable energy (VRE) forecast in a representative South African power system at a national scale has been quantified in this research. The value of improved a VRE forecast in South Africa increases with increasing VRE penetration levels. When comparing to representative US power systems, the outcomes show good correlation and alignment with the coal-dominated Midcontinent System Operator (MISO) region than that of the gas-dominated California Independent System Operator (CAISO) region. Future research is necessary for higher variable renewable energy penetration levels for a full comparison to be undertaken and this is intended to inform future research in this area.
It is clear that there a number of weather scenarios that with better understanding can facilitate the presented improvements to VRE forecasts.
Acknowledgements
The lead author of this work is the Council for Scientific and Industrial Research. This work was also authored in part by the National Renewable Energy Laboratory, operated by Alliance for Sustainable Energy, LLC, for the US Department of Energy under Contract No. DE-AC36-08GO28308. Funding was provided by the US DOE Of-fice of Energy Efficiency and Renewable Energy Wind Energy Technologies Office and Water Energy Technologies Office. The views expressed in the article do not necessarily represent the views of the DOE or the US Government. The US government retains and the publisher, by accepting the article for publication, acknowledges that the US government retains a nonexclusive, paid-up, irrevocable, worldwide license to publish or reproduce the published form of this work, or allow others to do so, for US government purposes.
Author roles
J.G. Wright: RSA power system. Methods, data and analysis. Overall write-up, structure, copyediting. G. Landwehr: Forecasting. Methods, data, South Africa status-quo.
E. Chartan: US perspective. Methods, data and analysis.
References
Calitz, J., & Wright, J. (2017). Statistics of utility-scale solar PV, wind and CSP in South Africa in 2017. Retrieved from https://www.csir.co.za/sites/default/files/Documents/StatisticsofREinSAin2017-CSIR- FINAL.pdf [ Links ]
CSIR; SANEDI; Fraunhofer IWES; Eskom. (2016). Wind and solar PV resource aggregation study for South Africa (RfP No. 542-23-02-2015). [ Links ]
Department of Energy (DoE). (2016). Integrated Resource Plan Update: Assumptions, Base Case Results and Observations (Revision 1). In Government Gazette (Vol. 583). Retrieved from http://www.energy.gov.za/IRP/2016/Draft-IRP-2016-Assumptions-Base-Case-and-Observations-Revision1.pdf [ Links ]
Department of Environmental Affairs (DEA). (2011). National Climate Change Response White paper. Retrieved from http://www.gov.za/sites/www.gov.za/files/national_climatechange_response_whitepaper_0.pdf [ Links ]
Department of Environmental Affairs (DEA). (2017). South Africa signs Paris Agreement on Climate Change in New York. Retrieved July 20 2003, from www.environment.gov.za/mediarelease/southafricasignsparisagreementonclimate [ Links ]
Energy Exemplar. (2017). PLEXOS Integrated Energy Model. Retrieved April 1, 2015, from www.energyexemplar.com [ Links ]
Hahman, A. (2017). Expert explanation (DTU). [ Links ]
Hodge, B., Martinez-anido, C. B., Wang, Q., Chartan, E., Florita, A., & Kiviluoma, J. (2018). The combined value of wind and solar power forecasting improvements and electricity storage. Applied Energy, 214, 1-15. https://doi.org/10.1016/j.apenergy.2017.12.120 [ Links ]
International Energy Agency (IEA). (2017). Getting wind and sun onto the grid: A manual for policymakers. Retrieved from https://www.iea.org/publications/insights/insightpublications/Getting_Wind_and_Sun.pdf [ Links ]
Lange, M. (2017). Evaluation of the forecasts, meteorological characteristics in South Africa and lessons learned. IPP Forecasting Workshop. Eskom. [ Links ]
Lange, M., & Focken, U. (2005). Physical Approach to Short-Term Wind Power Prediction. Springer. [ Links ]
Tyson, P. (1964). Berg winds of South Africa. Weather, 19(1). [ Links ]
United Nations Framework Convention on Climate Change (UNFCCC). (2016). The Paris Agreement. Retrieved from http://unfccc.int/paris%5C_agreement/items/9485.php [ Links ]
Villers, M. de. (2011). Roll cloud on the South African east coast. Weather, 66(2). [ Links ]
Wang, Q., Wu, H., Florita, A. R., Brancucci Martinez-Anido, C., & Hodge, B. M. (2016). The value of improved wind power forecasting: Grid flexibility quantification, ramp capability analysis, and impacts of electricity market operation timescales. Applied Energy, 184 (November), 696-713. https://doi.org/10.1016/j.apenergy.2016.11.016 [ Links ]
Willmott, C. (2005). Advantages of the mean absolute error (MAE) over the root mean square error (RMSE) in assessing average model performance. Climate Research, 30, 79-82. https://doi.org/10.3354/cr030079 [ Links ]
Wright, J. G., Bischof-Niemz, T., Calitz, J., Mushwana, C., van Heerden, R., & Senatla, M. (2017). Presentation: Formal comments on the Integrated Resource Plan (IRP) Update assumptions, Base Case and observations 2016. Retrieved from https://www.csir.co.za/sites/default/files/Documents/20170331CSIR_EC_DOE.pdf [ Links ]
Wright, J. G., Bishof-Niemz, T., Calitz, J., Mushwana, C., Heerden, R. van, & Senatla, M. (2017). Report: Formal comments on the Integrated Resource Plan (IRP) Update Assumptions, Base Case and Observations 2016. Retrieved from https://www.csir.co.za/sites/default/files/Documents/20170331CSIR_EC_DOE.pdf [ Links ]
Wright, J. G., Calitz, J., Bischof-niemz, T., & Mushwana, C. (2017). The long-term viability of coal for power generation in South Africa (Technical Report as part of Eskom's financial crisis and the viability of coal-fired power in South Africa November 2017). Retrieved from http://meridianeconomics.co.za/wp-contenl/uploads/2017/11/20171121-IEEFA-SACoalGen-Report-FINAL.pdf. [ Links ]
* Corresponding author: Tel: +27 12 842 7269; email: jwright@csir.co.za

