


Services on Demand
Article
 English (pdf)
 Article in xml format
 Article references
Indicators

Related links
-
 Cited by Google
 -
 Similars in Google
Share

 Permalink
Journal of Energy in Southern Africa
On-line version ISSN 2413-3051
Print version ISSN 1021-447X
J. energy South. Afr. vol.30 n.2 Cape Town May. 2019
http://dx.doi.org/10.17159/2413-3051/2019/v30i2a6355
WINDAC 2018 CONFERENCE PAPER - NOT PEER-REVIEWED
doi: https://dx.doi.org/10.17159/2413-3051/2019/v30i2a6355
Stress validation of finite element model of a small-scale wind turbine blade
Tolulope BabawarunI; Wei Hua HoII; Harry NgwangwaIII
IDepartment of Mechanical and Industrial Engineering, University of South Africa, Private Bag X6, Florida 1709, South Africa. https://orcid.org/0000-0003-0707-4806
IIDepartment of Mechanical and Industrial Engineering, University of South Africa, Private Bag X6, Florida 1709, South Africa. https://orcid.org/0000-0002-8739-9151
IIIDepartment of Mechanical and Industrial Engineering, University of South Africa, Private Bag X6, Florida 1709, South Africa. https://orcid.org/0000-0001-5486-8049
ABSTRACT
Wind turbine blades are the first mechanical part of a wind turbine that interacts with the wind and hence play a key role in wind power generation. It is important that the wind turbine blade is tested for structural integrity in accordance to design code IEC 61400-23 such as strain limits, fatigue life, blade tip clearance limit, and surface stress. This paper focuses on the calculation and validation of static bending stresses in the blade; it presents the experimental and simulated stress analysis of a small-scale wind turbine blade. The simulation and 3D design software ANSYS, version 19.0 is used in the finite element analysis (FEA). By using FEA, we aim to capture the stress generated on the blade geometry under static loading and unloading conditions. As a first step towards this, the finite element results were validated against experimental results on a kestrel E230i turbine blade. The blade was fixed at one end, loaded, and unloaded statically at three selected points. The finite element results are calculated within a 25% error margin of the experimental results. A reverse engineering procedure was used to determine the appropriate ANSYS model blade properties that were used, as the exact material properties were not available from the manufacturer.
HIGHLIGHTS
• A single small-scale wind turbine blade is analysed.
• Static loading and unloading is experimentally conducted on the blade.
• Finite element model simulation is done using ANSYS version 19.0 under similar conditions as in the experiment.
• Comparison of result for both analyses was done
Keywords: ANSYS; bending strain measurements
1. Introduction
Energy resources are a crucial component of human life, and the supply of energy is a basic requirement for the subsistence and development of modern society. Renewable energy resources such as wind power had their first real boom at the beginning of the 1970s, when the first oil crisis struck [1].
Small-scale wind turbines, producing less than 10kW of electricity, can be used to generate electricity for a home or small business. The choice of wind turbine size is dependent on the ability of the turbine to meet the energy requirements, given the available wind resources. A typical South African household of two adults and a teenager consumes an average of between 600 and 900 kWh of electricity per month; hence, a small wind turbine can generate just enough power to meet its demands [2]. Small-scale wind turbines today are efficient, producing electricity in winds as low as 3-4.5 m/s.
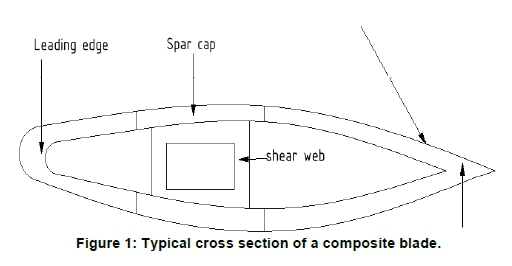
The wind turbine blade plays a key role in collecting wind energy and is one of the most important components of the wind turbine system. The wind turbine converts kinetic energy in the wind to electrical energy by the rotation of the blades. A modern blade is often made of composite materials and is designed in a way that compromises between structural and aerodynamic considerations. The blade is structurally designed to be hollow, with the outer structure comprising two shells, one on the pressure side and the other on the suction side [3]. It is constructed so as to be an assembled structure, comprising spar caps and shear webs. The spar caps (usually two of them), are designed to withstand bending moments, while the shear webs are designed to transfer shear forces and support the two spar caps [4]. Figure 1 gives a detailed view of the composite blade. It shows that the spar cap and shear webs are connected to each other. The connection is made possible by the use of adhesive joints, which might lead to discontinuities in the blade, and stress concentration may develop, which can lead to blade failure [5]. The outer shape of the wind turbine blade is designed to enhance aerodynamic performance, while the interior webs are aimed at increasing the strength and stiffness of the blade. It is important that the structure of the blade is strong enough to withstand extreme structural and aerodynamic loads as well as endure fatigue loading [6]. Since the blade is the most important part of any wind turbine system, it is important that special consideration be given to fatigue endurance.
The blades undergo testing by manufacturers as required by the classification authorities, according to IEC 61400-1[7-9]. Full-scale structural testing falls under the IEC 61400-23 [10] international standard. This testing involves two different tests: static edge-wise, and flap-wise. Both are conducted to the extreme design load case (50-year gust wind); a fatigue test is also conducted on the flap-wise and edge-wise (20 years life experience); as well as an extreme design load case. It should be noted that it is expensive to conduct a full-scale test on the wind turbine blade, and this is the reason why there is little literature on full-scale testing [10].
Static testing is an important requirement for the blades, and hence the structural response of the blade under static loading is the focus of this study. The static flap-wise test is also useful in determining the structural response of the primary load-carrying structure of the blade [11]. Several authors have researched the topic of static loading. Inomata et al [12] performed an operating stress test on a prototype 500 kW blade developed by the NEDO (New Energy and industrial technology Development Organisation) in Tappi Wind Park in Japan. The full-scale test was performed to gain confidence in structural integrity and to validate and verify the manufacturer's procedure. Kong et al. [13] present a design procedure of a medium scale E-glass/epoxy composite wind turbine blade. The procedure performed static and dynamic load analysis, structural design analysis, and modal analysis among others.
Berring et al. [14] performed an experimental investigation on a select section of the blade to determine the edge-wise and flap-wise bending stiffness and the bend-twist coupling. The results are then validated against the numerical finite element models. Jensen et al. [15] tested a 34 m glass-epoxy wind turbine blade until complete failure under flap-wise loading conditions. The blade manufactured by wind turbine development and manufacturing company SSP-Technology A/S initially passed all the static and dynamic classification authorities test required. Yang et al. [16] performed an experimental failure test on a 40 m wind turbine blade. A method known as video metrics was used to measure the local and integral deformation under flap-wise loading. It was determined that adhesive debonding of the outer aerodynamic shells caused initial failure.
This paper focuses on the mechanical testing of a small-scale Kestrel e230i composite blade, 1.12 m long, tested in flap-wise bending. Similar work has been reported on the use of strain gauges by Over-gaard et al. [17], in which a full scale static flap-wise bending test was performed on a 25 m wind turbine blade. The experiment involved investigating failure modes during loading and after the ultimate failure of the structure. The measured strain measurements were used to validate the predictive numerical model. Jorgensen et al. [18] conducted non-destructive testing (NDT) on a Vestas 25 m epoxy glass fibre blade using an ultra-sonic method. The experimental test involved the use of a method called the ultra-sonic for NDT to detect defects in the main spar and the skin laminate. The test was used to inspect the three-test sections of the blade to check for damages. Before making use of the method, the blade underwent a static bending test that met the design criteria equivalent to a 20 years lifetime of the blade type. Debel [19] conducted a static bending experimental study in a post-mortem setting in order to identify visually the different types of damage on the wind turbine blade. The post-mortem setting was useful in determining the various failure characteristics of the blade. Han et al. [20] performed a step-by step static test on a full-scale blade of 100 kW capacity using acoustic emission technology (AET). New source locations on the blade were highlighted and loading was done on them in order to analyse their performance. AET was used to inspect the damage during the load test.
The material properties such as Young's modulus of elasticity, Poisson ratio and shear modulus of rigidity of the blade to be used in ANSYS were determined through an educated trial and error procedure. The following stages were employed in arriving at the acceptable property: the first measured the blade aerofoil shapes along the span using digital Vernier callipers and well-dimensioned surface tables; secondly, the measured aerofoil shapes were lofted along the blade span in Autodesk Inventor Professional to produce its 3D model. Thirdly, a literature search was conducted for the material property of the blade, which was not readily available from the manufacturer due to the copyright concern. The material property is important in the ANSYS finite element analysis in order to arrive at a result that validates the experimental result. The finite element model was validated against the experimental stress results.
2. Wind turbine blade model
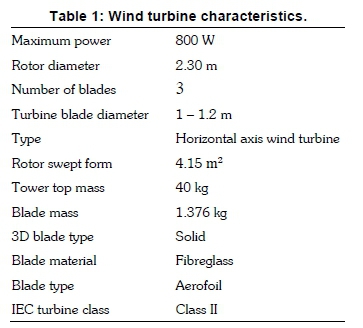
The small-scale wind turbine that was used for this study is a Kestrel e230i with a maximum power of 800 W and a rated power of 650 W at 11 m/s. The actual energy it generates at an average wind speed of 5 m/s average at sea level is 1 280 MWh/annum. It is a horizontal axis wind turbine with a tower height of 24 m and a blade length of 1-1.3 m. Table 1 gives the its full characteristics.
3. Experimental test
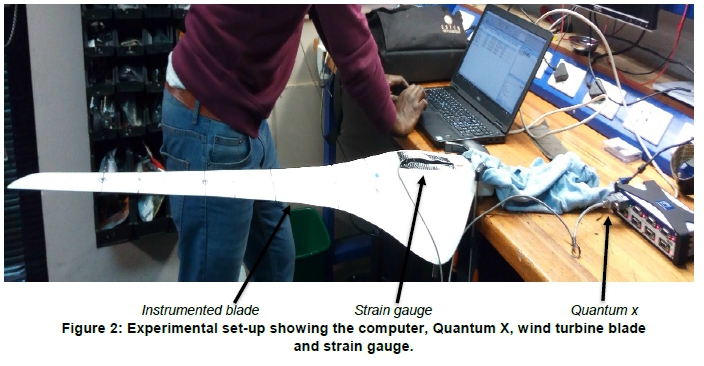
Structural bending test was conducted on the 1.12m long wind turbine blade in the flap-wise direction, as shown in Figure 2. The state of static bending load on the wind turbine blade is aimed at verifying if the turbine blade is capable of withstanding the sustained wind load action. Two different load cases acting on the blade result from external factors on the turbine, namely mass loads and aerodynamic loads [21]. Under static testing, loads are usually applied via the use of actuators either hydraulic or electrodynamic, or by the use of hang weights, or cranes in the case of large wind turbines [22]. The locations of the loading points may be determined by the calculated centres of pressure due to the different hypothetical wind pressure distributions over the blade in the flap-wise direction. In this study, hang weights are used and applied at three selected locations along the blade, namely at 350 mm, 750 mm and 950 mm from the root of the blade. These areas were selected to replicate different loading distribution across the blade and far away from the fixed point to avoid damage to the blade. The blade is tested in the worst case loading scenario, where it is assumed that it is firmly fixed at its root and that its pitch angle is negligibly small. The wind loads are assumed to act strictly parallel to the flap-wise direction. Thus in the set-up the table was firmly clamped to a table top and loaded as a non-prismatic cantilever beam structure. The selection of the two support structure at one end, which in this case is a table; it is fixed and loaded as a cantilever beam structure.
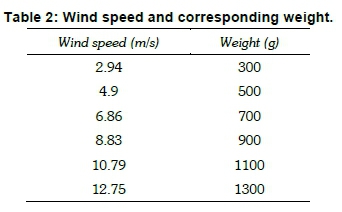
The wind speeds of a normal operating wind turbine range from 3.5-25m/s with a nominal wind speed of 14 m/s. at the nominal wind speed constant power production must be maintained hence the turbine uses a pitch control system [23]. In selecting the test loading on the blade a wind speed was used in the range of as low as 2.94m/s to an extreme gust of 12.75m/s. This was determined using the wind speed data for the Johannesburg region, which has an average maximum wind speed of 7 m/s. This wind speed was converted to equivalent mass loads in grams; it was then loaded as static loads on the blade. Table 2 shows the various wind speeds and their equivalent weights used in static loading.
The static test loading was done only in a flap-wise direction. The flap-wise force acts as thrust on the blade while the edge-wise force acts as a torque acting on the blade. The thrust acting on the blade is thus the most important force acting on the blade.
3.1 Measurement process
A Quantum X MX840B data acquisition system (see Figure 2) was used to record the static flap-wise bending strain on the blade. A quarter-bridge configuration was used because temperatures were expected to remain constant throughout the testing period. The number of active elements used in this experiment was one, which therefore translates to the quarter bridge configuration. The wind turbine blade was fixed at one end and the strain gauge neatly instrumented on the blade. The strain gauge used in this case is bonded metallic and the configuration used was the Wheatstone-bridge. In order to ensure the accuracy of the measurement it is important that the strain gauge is properly calibrated according to the National Institute of Standard and Technology (NIST or PTB). The strain gauge used was calibrated to 10.000μm/m.
Since stress cannot be determined through the direct measurement process, it is calculated using two different methods, through Hooke's law or the strain gauge measurement.
Hooke's law formula is given as
σ = E . ε
Where σ = material stress  , ε = strain
N and E = modulus of elasticity  , while the strain gauge measurement formula is given as

where F = force and A = cross-sectional area of the stressed material.
Another factor that influences the accuracy of the strain gauge is the sampling rate, which must be set at a value that is not too high or not too low. The minimum acceptable sampling rate for the strain gauge was set at 500 Hz [24].
The strain gauge was mounted at a distance of 80 mm from the blade root. It is rectangular, measuring 55 X 22 mm. The blade was instrumented with a strain gauge measuring the strain in the axial direction. Figure 2 shows the strain gauge fixed to the blade.
3.2 Data processing
The Quantum X MX840B includes an 8-channel
universal amplifier. As shown in Figure 2, one channel was used in the data processing. Eleven loading steps for each of the three scenarios was taken, totalling thirty-three. For each of the three loadings, a collection of raw data was captured in the laptop and transferred to Excel, where they were grouped. In every loading step a high number of data was collected, and the average strain for every loading step was manually calculated using the highest and the lowest data extracted from Excel. The average time for each loading was also calculated.
4. Results and discussion
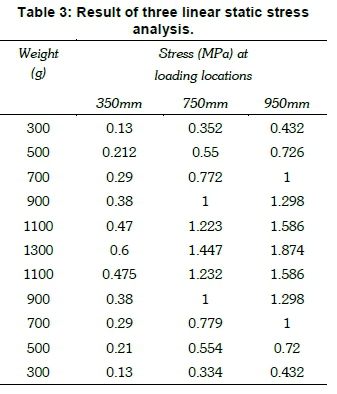
Strains were measured at three different locations, namely 350 mm, 750 mm and 950 mm from the blade root. The results were measured and recorded during the six loading and five unloading situations.
The measured results were obtained in strain values and converted into stress values using the relationship:
Stress, σ = Young's modulus, E x Strain, ε
Experimental loading started with 300 g, with subsequent increments of 200 g up to a final loading of 1300 g. The unloading reversed the procedure. Table 3 shows the result of the analysis.
4.1 Validation of FE Model
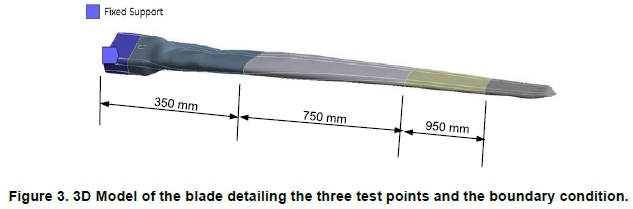
The Kestrel e230i blade that was considered is made of fibreglass and epoxy-resin and 1.12 m long. A 3D CAD model of the Kestrel e230i blade was generated using Autodesk Inventor Professional v2017. The finite element analysis of the blade was performed using ANSYS where structural static analyses were conducted. Figure 3 is a pictorial representation of the blade, together with its boundary conditions and load points.
Loading
As shown in Figure 3, a fixed boundary support was applied in ANSYS at the blade root and point loads were applied over the three selected element areas that were equal to those used in the experimental test. The point load was applied over the element area in order for the force to be equally distributed. The test loading of the blade was applied non-line-ally in an incremental fashion and the equivalent von mises stress was captured.
Meshing
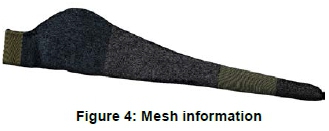
The turbine blade model was meshed as a solid body. The meshing on the model was conducted in ANSYS/Mechanical APDL V19.0. The mesh size function was Proximity and Curvature. The body-sizing function was also introduced. After conducting a mesh sensitivity study on different element size to determine the ideal element size to be used, the ideal element size of 3 mm was chosen.
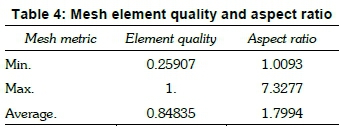
As seen in Figure 4 the final mesh analysis consists mainly of the tetrahedral elements with some hexahedral, wedge-shaped and pyramidal elements were necessary. The blade had a mesh statistics of 1 380 029 node points and 931 938 elements. Table 4 gives more information on the mesh element quality and aspect ratio.
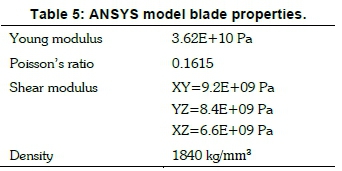
Blade properties
The ANSYS blade model was assumed to be of homogenous material, of similar properties to those of fibreglass. The real blade is made of fibreglass and epoxy resin, while the two most commonly used fibres in FRP blade construction are carbon and glass. The E-glass/epoxy composite material is used because of its desirable stiffness and strength, low cost, ease of manufacture [13] and has a good strength: weight ratio. Table 5 indicates the ANSYS blade properties that were seeing to match the e230i blade properties.
5. Comparison of experimental results and simulation result with the percentage error
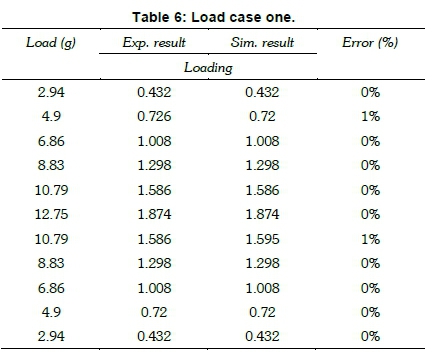
The finite element results obtained from the simulations were validated against the experimental results, and percentage errors of the stress values were calculated in Excel for each of the three load cases. The percentage error was shown to fall under 25%. The formula used for determining the error percentage in Excel is given as:

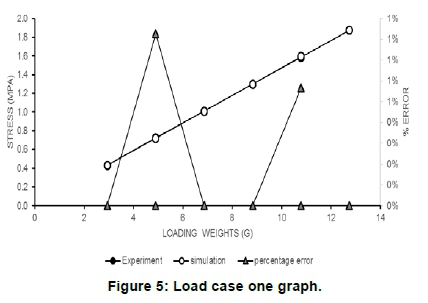
Table 6 and Figure 5 show the results obtained in load case one. The experimental result and simulation result agreed, or came very close to agreement in most load cases considered. The result can be seen to have a perfect validation with the maximum error to be 1%. Figure 6 gives a graphical representation of the error recorded.
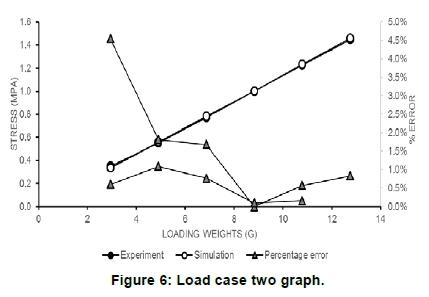
As can be seen in Table 7 and Figure 6, for load case two the maximum error percentage is 5% with the minimum as low as zero. This indicates that the experimental and simulation result agreed, hence a very good validation is reached. Figure 7 gives a graphical representation of this.
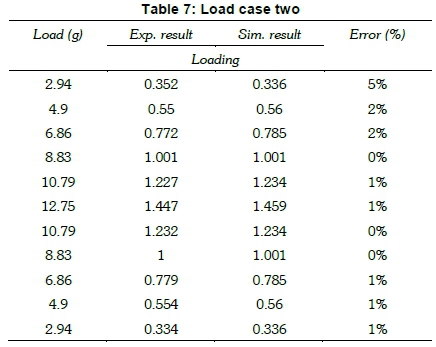
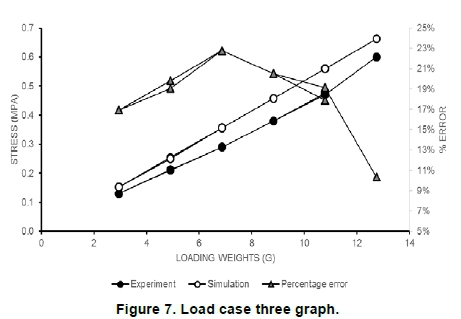
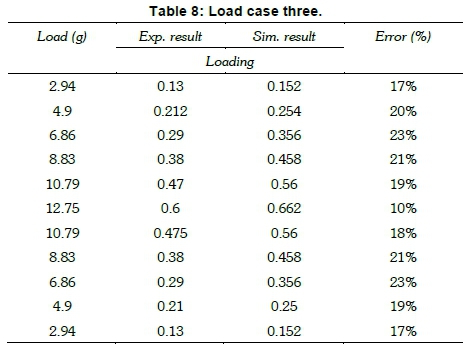
Table 8 and Figure 7 present a breakdown of the load case three, which is located at 350 mm from the blade root. The maximum error percentage was calculated to be 23% at a loading, with a minimum of 17%. As compared to load case one and two load case, three gives a higher error percentage.
5.1 Simulation result
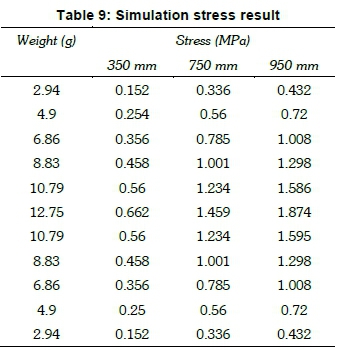
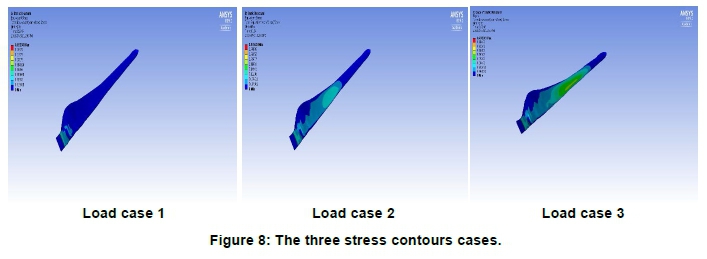
Figure 8 shows the stress contours of the blade on each of the three load cases considered. Each of the three different load cases considered generated different stress distribution results in the blade, as can be seeing in the ANSYS simulation result. In preventing failure from occurring at any point on the blade, it is important that the three cases were considered. As can be seen in Table 9 the load case three scenario shows the highest stress is around the root of the blade. The maximum stress is found to be 0.15268 MPa. In load case 2, which is 750 mm from the blade root, the high stress distribution is at the midsection (see Figure 8), where the maximum stress is 0.33625 MPa. Similarly, as shown in Figure 8, the higher stresses are distributed more towards the tip of the blade, which reflects the loading done around 950 mm from the blade root. The maximum stress is 0.43203 MPa.
6. Conclusion
In this paper, a Kestrel e230i conventional flat blade was modelled and analysed, and the results successfully validated using experimental results. A 3D CAD model of the blade was generated using Autodesk Inventor Pro V.2018. The pre-processing, post-processing and analysis of the finite element model was done using ANSYS. An experimental static bending test was carried out on the blade, and it was observed that the finite element results agreed with the test results to within 5% error for two of the test load cases. The third load case yielded relatively higher percentage errors, below 25% of the experimental results.
The result properly reflected and validated two of the simulated result, with percentage errors as low as 0% and as high as 5%. The third experimental result showed the percentage error fell within 25% of the simulated results. Three different load cases were considered and the response of the blade was analysed.
The corresponding measured stress of the experimental and simulation results fell within the 23% margin of error. The first and second load case scenario showed that the maximum percentage error was 5% and 1% respectively. This indicates a relatively good correlation between the experiment and simulation result, hence the results validate each other. For the third load case scenario, the percentage error is recorded at 23%, which was relatively high as compared to the first and second case. A reason for this could be that loading at position 1 (350 mm) was ill conditioned. In determining the percentage error at 350 mm from the blade root, the division by near zero yields an amplified percentage error. It should be noted that at 350 mm the loading done was too low and the moment arm at that point was too short. The levels of load that was used to conduct the testing at that point are not sufficient. This can be addressed in the future by increasing the loading on position 1.
Acknowledgement
This work was supported by the National Research Fund Competitive Support for Unrated Researchers CSUR 150718127549/98876. The authors also acknowledge the support given by WindAC student sponsorship that allowed the first author to travel to present his work at the WindAC 2018.
Author roles
Tolulope Babawarun: data compilation, write-up. Ho Wei Hua: research formulation, editing, proofreading Harry Ngwangwa: research formulation, editing, proofreading
References
[1] Thorstensson, E., 2009. Small-scale wind turbines: Introductory market study for Swedish conditions. Chalmers University of Technology. [ Links ]
[2] Wind Energy Policy Issues: Wind energy resource guide: Most frequently asked questions. Accessed from- http://www.culturechange.org/wind.htm on 14/10/2016. [ Links ]
[3] Br0ndsted, P. and Nijssen, R.P. (Eds). 2013. Advances in wind turbine blade design and materials. Woodhead. [ Links ]
[4] Chen, X., Zhao, W., Zhao, X. and Xu, J., 2014. Failure test and finite element simulation of a large wind turbine composite blade under static loading. Energies, 7(4), pp.2274-2297. [ Links ]
[5] Kong, C., Bang, J. and Sugiyama, Y. 2005. Structural investigation of composite wind turbine blade considering various load cases and fatigue life. Energy, 30(11-12 SPEC. ISS.), pp. 2101-2114. doi: 10.1016/j.en-ergy.2004.08.016 [ Links ]
[6] Fernandez, G., Usabiaga, H. & Vandepitte, D. 2018. An efficient procedure for the calculation of the stress distribution in a wind turbine blade under aerodynamic loads. Journal of Wind Engineering and Industrial Aerody namics, 172(November 2017), pp.42-54. [ Links ]
[7] IEC International Standard. Wind turbine generator system - Part I: safety requirements; 1994. [ Links ]
[8] Technical Note: IEC 1400-1 GL Test Regulation, 2000. [ Links ]
[9] Germanischer Lloyd. 1999. Regulations for the certification of the wind energy conversion system. Germany: Germanischer Lloyd. [ Links ]
[10] International Electrotechnical Commission. 2001. Technical specification IEC TS 61400-23 wind generator systems - part 23: Full-scale structural testing of rotor blades. [ Links ]
[11] Overgaard, L.C.T., Lund, E. & Thomsen, O.T., 2010. Structural collapse of a wind turbine blade. Part A: Static test and equivalent single layered models. Composites Part A: Applied Science and Manufacturing, 41(2), pp.257-270. Available at: http://dx.doi.org/10.1016/j.compositesa.2009.10.011. [ Links ]
[12] Inomata, N., Tsuchiya, K. and Yamada, S., 1999. Measurement of stress on blade of NEDO's 500 kW prototype wind turbine. Renewable Energy, 16(1-4), pp.912-915. [ Links ]
[13] Kong, C., Bang, J. and Sugiyama, Y. 2005. Structural investigation of composite wind turbine blade considering various load cases and fatigue life, Energy, 30(11-12 SPEC. ISS.), pp. 2101-2114. doi: 10.1016/j.energy.2004 [ Links ]
[14] Berring, P., Branner, K., Berggreen, C. and Knudsen, H.W. 2007, July. Torsional performance of wind turbine blades-Part 1: Experimental investigation. In 16th International Conference on Composite Materials (Vol. 43). Japan Society for Composite Materials. [ Links ]
[15] Jensen, F.M., Falzon, B.G., Ankersen, J. and Stang, H., 2006. Structural testing and numerical simulation of a 34 m composite wind turbine blade. Composite structures, 76(1-2), pp.52-61. [ Links ]
[16] Yang, J., Peng, C., Xiao, J., Zeng, J., Xing, S., Jin, J. and Deng, H., 2013. Structural investigation of composite wind turbine blade considering structural collapse in full-scale static tests. Composite Structures, 97, pp.15-29. [ Links ]
[17] Overgaard, L.C., Lund, E. and Thomsen, O.T., 2010. Structural collapse of a wind turbine blade. Part A: Static test and equivalent single layered models. Composites Part A: Applied Science and Manufacturing, 41(2), pp.257-270. [ Links ]
[18] Jorgensen, E.R., Borum, K.K., McGugan, M., Thomsen, C.L., Debel, C.P. and S0rensen, B.F., 2004. Full scale testing of wind turbine blade to failure-flap wise loading. Forskningscenter Risoe, Denmark. [ Links ]
[19] Debel, C.P., 2004. Identification of damage types in wind turbine blades tested to failure. In Dansk Metallurgisk Selskabs vinterm0de 2004. DMS. [ Links ]
[20] Chen, X., Zhao, W., Zhao, X. and Xu, J., 2014. Failure test and finite element simulation of a large wind turbine composite blade under static loading. Energies, 7(4), pp.2274-2297. [ Links ]
[21] Jureczko, M.E.Z.Y.K., Pawlak, M. and Męzyk, A., 2005. Optimisation of wind turbine blades. Journal of materials processing technology, 167(2-3), pp. 463-471. [ Links ]
[22] Zhou, H.F., Dou, H.Y., Qin, L.Z., Chen, Y., Ni, Y.Q. and Ko, J.M., 2014. A review of full-scale structural testing of wind turbine blades. Renewable and Sustainable Energy Reviews, 33, pp.177-187. [ Links ]
[23] E.M. Fagan, M. Flanagan, S.B. Leen, T. Flanagan, A. Doyle, J. Goggins. 2017. Physical experimental static testing and structural design optimization for a composite wind turbine blade. Composite Structures, 164, pp.90-103. [ Links ]
[24] H. Shi, C. Tian, R. Zhang, D. Yu and T. Ueda, 2012. Effect of sampling rate on the accuracy of strain gage measurement during printed circuit board functional test. 13th International Conference on Electronic Packaging Technology & High Density Packaging, Guilin, 2012, pp. 903-908. [ Links ]
Corresponding author: Tel: +27 6214 29186; email: dexter20054all@yahoo.com

