


Services on Demand
Article
 English (pdf)
 Article in xml format
 Article references
Indicators

Related links
-
 Cited by Google
 -
 Similars in Google
Share

 Permalink
Journal of Energy in Southern Africa
On-line version ISSN 2413-3051
Print version ISSN 1021-447X
J. energy South. Afr. vol.30 n.2 Cape Town May. 2019
http://dx.doi.org/10.17159/2413-3051/2019/v30i2a6341
WINDAC 2018 CONFERENCE PAPER - NOT PEER-REVIEWED
doi: https://dx.doi.org/10.17159/2413-3051/2019/v30i2a6341
Power system inertia in an inverter-dominated network
Mpeli RampokanyoI, *; Pamela Ijumba-KameraII
ICouncil for Scientific and Industrial Research, Energy Centre, Energy Systems, Pretoria, South Africa https://orcid.org/0000-0002-0669-4619
IICouncil for Scientific and Industrial Research, Energy Centre, Energy Systems, Pretoria, South Africa https://orcid.org/0000-0002-2968-3971
ABSTRACT
Erosion of power system inertial energy due to high penetration levels of renewable energy (RE) sources in a power system is a current teething issue with most system operators everywhere. The main issue is displacement of synchronous generators with inverter-based based generators, as the latter do not provide any inertial energy to the power system. The power system thereby becomes vulnerable to large system events (like sudden loss of a big generator or load) and in an inverter-based system this could result in catastrophes such as total collapse of the whole power system due to rapid rate of change of frequency. This paper focuses on power system inertia as RE penetration levels increase and also explores possible mitigation measures such as demand response techniques.
Keywords: renewable energy, inertial energy, demand response, rate of change of frequency, stored rotational energy
1. Introduction
Globally, there has been a rapid increase in the deployment of renewable energy resources (RES)[1] and the share of RES in terms of electricity generation is set to increase to 30% by 2023[2]. The bulk of the installed RES generating capacity is expected to come from solar photovoltaics (PV) and wind[2]. In South Africa, since the introduction of the REIPPPP programme in 2011, over 3000 MW of wind and solar PV have been connected to the grid. An additional 2000 MW is expected to be commissioned in the next four years, and the 2018 Draft Integrated Resource Plan recommended a further 13 000 MW to be procured by 2030, resulting in a 25% share of the installed capacity. These technologies are thus expected to play a major role in the power system in future.
These particular RES generating technologies behave quite differently from traditional synchronous machines - a key differentiator is that, because they are inverter-based, they do not contribute to system inertia [3], [4]. The forecast increasing levels of RES penetration are thus expected to erode the natural inertia of the power system, which leads to a faster rate of change of frequency (RoCoF), resulting in more severe frequency excursions in response to system events [5].
This paper presents a study examining the impact of depleting levels of inertia in a typical power system, by conducting primary frequency response simulation studies in DigSILENT. An assessment is also made to determine the impact of demand response as mitigation for the lower inertia levels. The rest of the paper is organised as follows. Section 2 presents background and technical definitions for power system inertia and Section 3 discusses the methodology used for the study. Section 4 covers the results from the simulations and their analysis, and Section 5 presents conclusions.
2. Background
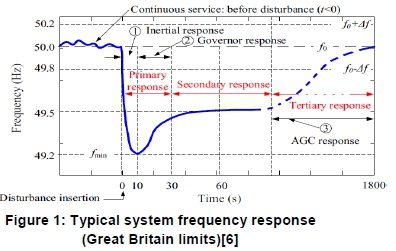
When an imbalance occurs in a power system the deficit is initially compensated by kinetic energy released by synchronous generators - this is known as inertial response [3]. Thereafter, primary frequency response reserves kick in to stop the frequency decline, as shown in Figure 1. Secondary and tertiary reserves are then utilised to return the system frequency to acceptable levels.
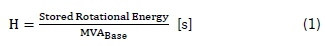
In physics, inertia can be defined as resistance to change in motion. In the context of a power system it can be defined as the ability of a system to oppose changes in frequency due to resistance provided by the kinetic energy of rotating masses in individual turbine-generators. When analysing inertia of a large system it is often convenient to represent inertia as the kinetic energy of the system, which is the amount of energy stored in the rotating masses [16]. Turbine-generator inertia constant is defined in Equation 1.
Stored rotational energy is defined as in Equation 2.
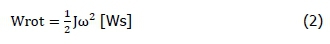
where J is moment of inertia of the rotating mass, and w is speed in RPM (revolutions per minute) of the rotating mass.
System inertia is given in Equation 3.
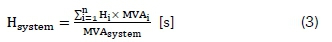
As representing system inertia as a constant is somewhat cumbersome, it is often convenient to represent it as total stored rotational energy of the system, as in Equation 4.
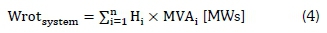
where i represents a generator unit in the system.
The rate of change of frequency (RoCoF) during the inertial response period can be estimated by Equation 5.
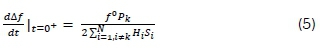
where Af is the deviation of the frequency ƒ from its nominal value ƒ °; 0+is the moment just after disconnection of the load/generation; Pkis the lost generation/load (the machine carrying the index k); and Hi and Sj are the inertial constant and apparent power rating of synchronous machine i, with i ranging from 1 to Ν[7],
As can be seen, RoCoF is directly proportional to the size of the disturbance, and indirectly proportional to the inertia of the system. With the proliferation of inverter-based generators, the system inertia is expected to decrease and lead to increasing RoCoFs, which can present a challenge in terms of frequency stability of the system. For simplicity RoCoF can also be estimated from the slope of the frequency response plot following a distance. The slope can be determined from the linear part of the curve (i.e. tangent) immediately after the disturbance. In this paper this approach is used to estimate RoCoF from the frequency response simulation plots.
Several utilities around the world have done extensive work to determine the minimum acceptable levels of inertia in their systems in order to ensure system stability is not compromised by increasing levels of penetration of inverter based genera-tion[8]-[11j.
In addition to this, the role of the demand response (DR) in correcting a frequency imbalance on the power system is becoming more prominent. With the advent of smart grids and increased visibility of loads, fast demand response (FDR) can serve as a mitigation for frequency excursions. Research has shown that thermostatically controlled loads [12], electrical vehicles [13] and even demand market participation (DMP) can all assist in frequency control. This study will look at the use of DR, with faster relays to mitigate the impact of reduced power system inertia in an inverter-dominated network.
3. Methodology
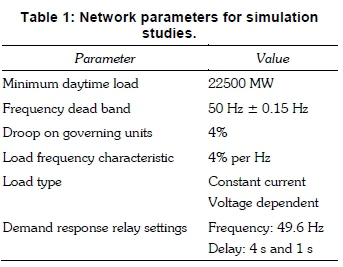
To assess the impact of depleting levels of inertia, a 40 GW aggregated power system was used - equivalent to the total demand of the South African system. While the study tried to emulate the South African system, it must be realised that the model used is not a true representation of it, as only generic model data was used and the network was aggregated. It follows that, while the results achieved here may be close to what could be achieved in the full accurate representation of the South African system, they only serve here as mere estimates of the actual reality. Studies were conducted for the minimum daytime load condition as this period coincides with maximum solar PV output, and hence lower inertia on the system. The network parameters assumed for the study are summarised in Table 1.
Increasing levels of RES penetration were simulated by replacing synchronous machines with inverter based generation. At each simulated penetration level, the calculated stored rotational energy, based on the synchronous machines that are online, is used to reflect the system inertia. This measure does not account for the inertia provided by rotating loads (and it is assumed that this is minimal). RoCoF is calculated directly from the slope of the frequency response curve.
For the purposes of the study, the South African Grid Code requirements were used to assess the adequacy of the network. As per Smith et al. [14], the system was set up with 800 MW of instantaneous reserves. The single largest contingency as prescribed by the National Energy Regulator [15] was then simulated and the frequency response of the network observed. The Grid Code requires the frequency to turn and remain above 49.5 Hz for a single credible contingency [15]. The single credible contingency in the study was defined as loss of a largest unit at 1000 MW. Also according to the Grid Code, the under frequency load shedding (UFLS) first stage is set at 49.2 Hz [15]. This is considered when conducting the simulations. A DR load block of 1000 MW with a 4s and a 1s delay is also used as a mitigation to arrest frequency decay at different RE penetration levels.
4. Results and analysis
This section gives results of the scenarios studied. Figure 2 and Table 2 show that at 0% instantaneous penetration the system inertia on the network is estimated as 138 000 MW. The RoCoF is estimated to be around 127 mHz/s when 1000MW unit is dropped. As the instantaneous penetration levels increase the inertia of the system gradually drops until it reaches 60000 MWs at 64% instantaneous penetration level. The RoCoF on the other hand increases until it reaches 375mHz/s at 64% instantaneous penetration level.
These results can be summarised as follows:
• The grid code limit of 49.5 Hz is maintained until 20% instantaneous penetration level.
• With increasing RE generation, RoCoF increases, following a credible contingency on the network
The frequency nadir starts encroaching on Grid Code limit of 49.5 Hz and at 64% penetration the frequency nadir reaches the first stage of UFLS at 49.2 Hz. Therefore the inertia value of 64% with 375 mHz/s RoCoF level can be regarded as critical limits instantaneous penetration limits for this particular system.
The results shown in Figures 3, 4 and 5 show that if demand response is deployed it helps with frequency response. More specifically, 4s delay on DR only helps with frequency recovery while frequency nadir is not improved at all. On the other hand if 1s delay is employed on the DR (hence rendering it as fast frequency response - FFR) significant improvement in the nadir is realised as follows:
• 50 mHz @ 40% penetration;
• 100 mHz @ 60% penetration;
• 129 mHz @ 64% penetration.
The above results can be summarised as follows:
• Slow demand response does not help in arresting the nadir of the frequency fall but rather frequency recovery. However shorter delays of DR relay settings leads to a better nadir.
• Therefore it follows that FDR can be regarded as an FFR technique that can easily be deployed to mitigate high RoCoF levels.
5. Conclusions
The following conclusions can be drawn:
• High renewable energy (RE)penetration levels lead to system inertia decreases while rate of change of frequency (RoCoF) increases, following a credible contingency on the network.
• For the particular system modelled here, 64% RE penetration level with 375 mHz/s RoCoF level can be regarded as critical limits for instantaneous penetration limits, based on the first stage of UFLS set at 49.2 Hz.
• FDR can be regarded as an FFR technique that can easily be deployed to mitigate for high RoCoF levels. This is essential from 40% penetration levels in this particular system.
• A system at 100% penetration of RE generation will need a totally different frequency management strategy with a new suite of ancillary services to the current conventional system.
Author roles
Mpeli Rampokanyo: scenario planning, relevant simulations, analysis of results
Pamela Ijumba Kamera: literature review, analysis and gathering of relevant data.
References
[1] International Energy Agency, Renewables Information 2018: Overview, 2018. https://webstore.iea.org/download/direcf2260?fileName=Renewables_Information_2018_Overview.pdf [ Links ]
[2] International Energy Agency, Renewables 2018 - Analysis and Forecasts to 2023, 2018. https://webstore.iea.org/download/summary/2312?fileName=English-Renewables-2018-ES.pdf [ Links ]
[3] P. Tielens and D. Van Hertem, The relevance of inertia in power systems, Renew. Sustain. Energy Rev., vol. 55, pp. 999-1009, Mar. 2016. [ Links ]
[4] Andreas Ulbig, Theodor S. Borsche, Göran Andersson, Impact of Low Rotational Inertia on Power System Stability and Operation, IFAC Proceedings Volumes, Volume 47, Issue 3, 2014, Pages 7290-7297 https://doi.org/10.3182/20140824-6-ZA-1003.02615. [ Links ]
[5] M. Rezkalla, M. Marinelli, M. Pertl, and K. Heussen, Trade-off analysis of virtual inertia and fast primary frequency control during frequency transients in a converter dominated network, in 2016 IEEE Innovative Smart Grid Technologies - Asia (ISGT-Asia), 2016, pp. 890-895. [ Links ]
[6] F. M. Gonzalez-Longatt, Impact of emulated inertia from wind power on under-frequency protection schemes of future power systems, J. Mod. Power Syst. Clean Energy, vol. 4, no. 2, pp. 211-218, 2016. [ Links ]
[7] EirGrid and SONI(system operator for northern Ireland), DS3: rate of change of frequency ( ROCOF ) Workstream Plan, no. January, pp. 1-7, 2011. [ Links ]
[8] Australian Energy Market Operator, Inertia Requirements Methodology, June, 2018. http://energylive.aemo.com.au/-/media/Files/Electricity/NEM/Security_and_Reliability/System-Security-Market-Frameworks-Review/2018/Inertia_Requirements_Methodology_PUBLISHED.pdf [ Links ]
[9] P. Wattles, Renewable Integration in ERCOT, 2017. http://energyweek.utexas.edu/files/2017/02/Wattles.pdf [ Links ]
[10] ENTSO-E, Frequency Stability Evaluation Criteria for the Synchronous Zone of Continental Europe, p. 25, 2016. https://docstore.entsoe.eu/Documents/SOC%20documents/RGCE_SPD_frequency_stability_criteria_v10.pdf [ Links ]
[11] Eirgrid and SONI, Operational Constraints Update, pp. 1-14, 2017. http://www.eirgrid.com/media/OperationalConstraintsUpdateVersionApril2013.pdf [ Links ]
[12] J. Stojkovic and N. Rajakovic, Demand response for frequency control in an interconnected power system, Mediterranean Conference on Power Generation, Transmission, Distribution and Energy Conversion (MedPower 2016), Belgrade, 2016, pp. 1-8. doi: 10.1049/cp.2016.1007. [ Links ]
[13] K. Wada, A. Yokoyama, S. Kawauchi, and F. Ishikawa, Frequency control using fast demand response in power system with a large penetration of renewable energy sources, 2014 Int. Conf. Power Syst. Technol., no. Powercon, pp. 1150-1156, 2014. [ Links ]
[14] V. Smith, I. Tshwagong, M. Ntusi, V. Smith, and C. Masike, Ancillary Services Technical Requirements for 2017/18 - 2021/22, Eskom Holdings SOC Ltd, South Africa,Tech. Rep. 342-434, pp. 1-26, 2016. [ Links ]
[15] National Energy Regulator of South Africa, The South African Grid Code: The System Operation Code, no. July, pp. 1-21, 2008. [ Links ]
* Corresponding author: Tel: +27 12 841 3422. Email: mrampokanyo@csir.co.za

