


Services on Demand
Article
 English (pdf)
 Article in xml format
 Article references
Indicators

Related links
-
 Cited by Google
 -
 Similars in Google
Share

 Permalink
Journal of Energy in Southern Africa
On-line version ISSN 2413-3051
Print version ISSN 1021-447X
J. energy South. Afr. vol.30 n.2 Cape Town May. 2019
http://dx.doi.org/10.17159/2413-3051/2019/v30i2a5658
WINDAC 2018 CONFERENCE PAPER - NOT PEER-REVIEWED
doi: http://dx.doi.org/10.17159/2413-3051/2019/v30i2a5658
Using normalised cross correlation and variance to determine the source of voltage unbalance exceedances in Eskom networks with wind farms
N. Ntsadu
Eskom, Beacon Bay, South Africa .https://orcid.org/0000-0002-8953-4855
ABSTRACT
During an exceedance of the voltage unbalance limit at a busbar there is a need to determine which entity is causing the problem between Eskom, wind farms and other entities that can influence the voltage unbalance at the busbar. There were voltage unbalance limit exceedances at Eskom-K, Eskom-C and Eskom-Z Eskom substations. There was a need to determine which entity was causing the voltage unbalance exceedances at these substations between Eskom, Transnet and wind farms. The normalised cross correlation was used to determine the source of voltage unbalance exceedances at Eskom-K and Eskom-C substation. The normalised cross correlation together with the variance was used to determine the source of voltage unbalance exceedances at Eskom-Z substation. The correlation value of Eskom-K voltage unbalance when correlated with the wind farm's total active power was close to one. The correlation value of Eskom-C voltage unbalance when correlated with the Eskom loads was also close to one. There was a high variance of the voltage unbalance and corresponded to the high variance of the Transnet traction station loads. Based on the correlation and variance results, it was concluded that voltage unbalance at Eskom-K substation was caused by the wind farms. The voltage unbalance at Eskom-C substation was caused by the Eskom loads. The voltage unbalance at Eskom-Z was caused by the traction loads because the Eskom-Z voltage unbalance variance corresponded with the traction load variance.
Highlights
• Voltage unbalance can be caused by different entities
• There is a need to determine which entity is causing the unbalance
• Normalised cross correlation can determine the source of unbalance
• Use variance or other mathematical tools where correlation fails
Keywords: grid code, amend, traction load, independent power producer, Transnet
1. Introduction
During an exceedance of the voltage unbalance at a busbar in a network with many entities, there is a need to determine which entity is causing the ex-ceedance. This paper considers three case studies in which there were exceedances of the voltage unbalance limit. The voltage unbalance limit is 2% for medium voltage networks as per NRS048-2 specification [1]. The exceedances occurred in networks with different entities. The entities were the wind farms, Transnet and Eskom. There was therefore a need to determine which of the entities was causing the problem. The normalised cross correlation and variance was used to determine the source of voltage unbalance exceedance.
Unbalanced loads are the common source of the problem of unbalanced voltages in the networks. When a wind farm based on doubly fed induction generators or permanent magnet synchronous machine is connected to a grid which has unbalanced voltages the wind farm can worsen the voltage unbalance if there are no control measures in place [2]. This is because the wind farm tends to draw negative sequence currents and thus makes the situation worse. The voltage unbalance in this case worsens with increased wind power penetration.
The South African grid code does not specify which rules must apply when different entities are involved in contributing to voltage unbalance limit exceedance [3]. It is therefore proposed in this paper that the cross correlation and the variance should be used to govern how each entity should contribute in solving the voltage unbalance problem in a network. The correlation or variance values can be ranked to determine which entities are contributing the most to the voltage unbalance. Based on this, rules can apply as to how each entity can improve the voltage unbalance as per its contribution.
The correlation values were ranked for each study case considered in this paper and the entities causing the voltage unbalance were determined based on the results. There was a case where the correlation alone was not enough to draw conclusions and therefore the variance was used to determine the source of voltage unbalance. It is thus important to note that the correlation alone will not always work for all situations but will require other mathematical tools to determine the source of voltage unbalance.
2. Voltage unbalance
Voltage unbalance has three common definitions, from the International Electrotechnical Commission (IEC), Institute of Electrical and Electronics Engineers (IEEE) and National Electrical Manufacturers Association (NEMA). The voltage unbalance limit is 2% according to the NRS048-2 and 4 specifications [1]. The NEMA and IEEE definition are similar and give the same the results. The IEC is also referred to as the true definition of voltage unbalance. It is expressed as the quotient of the negative sequence components to the positive sequence components of the voltage. Voltage unbalance causes heating and vibrations and damage of electrical equipment [2].
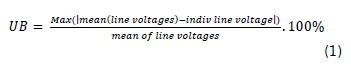
NEMA defines voltage unbalance as the ratio between the maximum difference between the mean of the line voltages and the individual line voltages to the mean of the line voltages [4, 5]. Equation 1 shows the NEMA definition of voltage unbalance (UB).
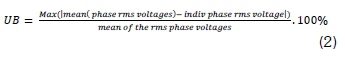
The IEEE defines voltage unbalance as the ratio of the maximum difference between the mean of the root mean square (rms) phase voltages and the individual phase rms voltages to the mean of the three-phase rms voltages [2, 3]. Equation 2 shows the IEEE definition of voltage unbalance.
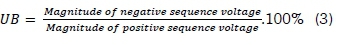
The IEC defines voltage unbalances as the ratio of the negative sequence magnitude to the positive sequence magnitude [4, 5]. Equation 3 shows the IEC definition of voltage unbalance.
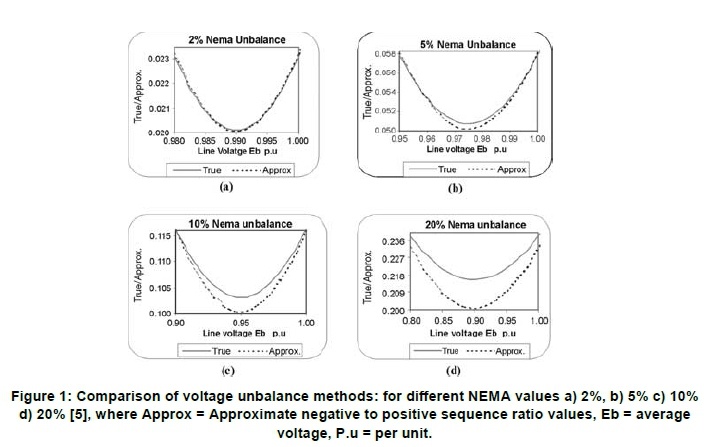
A comparison of the NEMA, IEEE and the true definition of voltage unbalance was conducted by Pillay and Manyange [5]. The finding was that the NEMA and the IEEE methods yield the same results. The subfigures in Figure 1 show comparisons of the NEMA approach versus the true definition. For voltage unbalance less than 5%, the NEMA and true definition closely match. As the unbalance increases, the true definition does not match the NEMA approach. Thus for low voltage unbalance below 5% the NEMA approach will give reliable results with minimum calculation required, but for higher voltage unbalance the true definition has to be used.
3. Variance and dispersion
The variance is a measure of data dispersion. In this paper the variance was based on the moving average instead of the standing average. It was ensured that the collective moving average data sample average was accurate to within two decimal places. This was based on the fact that the variance in the voltage unbalance should be related to the variance of the source that is causing it.
4. Wind farm and voltage unbalance
The doubly fed induction generator or permanent magnet synchronous generator based wind farms increases the voltage unbalance if it is connected to a grid which has unbalanced voltages. This is because the generator draws negative sequence currents and thus increases the voltage unbalance [2]. The voltage unbalance increases with increased penetration. Control mechanisms must be used to reduce the unbalance. In addition to increasing the voltage unbalance of the grid, the generator does not cope well under voltage unbalance conditions. The negative sequence currents can overload the converters and the generator [6, 7]. The imbalance also causes torque pulsations which then can cause vibrations [2]. The vibrations can damage the mechanical components of the generator or turbine. There are various techniques for controlling the voltage unbalance of a wind turbine generator. One approach is to modify the grid side and the machine side converters [7] such that the negative sequence currents are reduced under voltage unbalance conditions. The positive and the negative sequence components are controlled independently.
5. Grid code
Voltage is one of the power quality indicators. Many power quality indices are defined in terms of voltage. The power supply must be sent to the consumer in good quality. Voltage unbalance is one of the power quality indices that are used to measure and govern power quality. The primary contributor to voltage unbalance is usually the load in Eskom networks. Wind farms are secondary contributors because they worsen the unbalance that already exists in the network by drawing negative sequence currents. There can be events in the network whereby the voltage unbalance limit is exceeded and there are different entities that can influence the voltage unbalance. In these situations there is a need to determine which entities are causing the problem and how it can be governed. The grid code governs the grid integration issues of various entities connecting to the grid. However, the South African grid code does not specify how the problem of various entities contributing voltage unbalance should be handled [3]. It is therefore proposed in this paper that the normalised cross correlation and the variance should be used in the grid code to govern entities contributing to voltage unbalance in the grid.
6. Unbalanced loads
Eskom uses mostly three-phase, dual-phase and some minor single wire earth return (SWER) technologies on the medium voltage networks. Voltage unbalance occurs when the SWER and dual-phase network loads forms a significant portion of the loads. Load unbalance can also occur when the three phase transforms are not well balanced on the low voltage networks. The unbalance load causes unbalanced voltages as the negative sequence currents are increased in the network.
7. Traction load
The traction load is often not persistent and occurs as spikes over time. The load can be three-phase or two-phase. In the case of two-phase, the load can cause a sudden increase in voltage unbalance which makes voltage unbalance spikes. In this case the normalised cross correlation method will fail to identify the traction load as the cause of the unbalance ex-ceedances. This therefore requires an alternative method for determining the source of voltage unbalance. The variance based on a moving average was used to determine the source of voltage unbalance in this case as the correlation method had failed.
8. Normalised cross correlation
The cross correlation can be calculated using Equation 4. This is a normalised cross correlation which ranges between -1 and 1. A correlation of 1 means there is a strong linear relationship between two sets of data X and Y. This means more of X causes more of Y. A correlation of -1 means there is a strong inverse linear relationship between the two sets of data X and Y. That means more of X corresponds to less of Y. A correlation of 0 means there is no linear relationship between the two sets of data X and Y. The correlation can be taken for different time sample shifts. In this investigation the sample time is 10 minutes, so the data was shifted for each 10-minute sample when conducting the correlation. The shifted samples were limited to 100 in the forward and 100 in reverse direction.
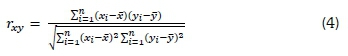
• rxy is the normalised correlation;
• i is an integer ranging from 1 to n;
• n is the number of samples in X and Y;
• xi is the ith sample of data X;
• Yi is the ith sample of data Y; and
•χ and y are the averages of the X and Y data respectively.
9. Case studies
There were three case studies in which the normalised cross correlation method was used to determine the source of voltage unbalance. The studies were on voltage unbalance events at three Eskom sites: Eskom-K, Eskom-C and Eskom-Z substations (S/S). In one of the case studies the normalised cross correlation method did not lead to conclusive results and thus the variance was used.
9.1 Case study one: Eskom-K voltage unbalance exceedance
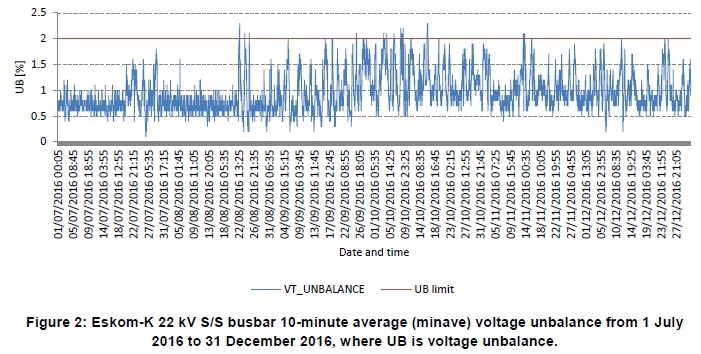
Figure 2 shows the voltage unbalance at the Eskom-K S/S 22 kV busbar from 1 July to 31 December 2016. The voltage unbalance on the 22 kV was below the 1.3% and had fewer fluctuations before 20 July, after which it increased above 1.3% and began to fluctuate and at some days exceeded the 2% limit. There were no network events on record to explain the sudden exceedances.
The overview of voltage unbalance on the Eskom-K S/S 22 kV busbar is shown in Figure 3, expressed in terms of the number of exceedances of the 2% limit. The number of exceedances is plotted in six-month intervals from 1 January 2015 to 31 December 2017. Data availability is also plotted on the same moth intervals. The exceedances of the voltage unbalance limit began on 22 August 2016.
9.1.1 Eskom-K network information Figure 4 shows the Eskom-K S/S and neighbouring substations. Eskom-K S/S is supplied from Eskom-G S/S transmission substation. The substations that are directly in line with Eskom-K S/S are: Eskom-T; Eskom-D; Eskom-M and Eskom-KU S/S. There are four independent power producers (IPPs) supplying Eskom-M S/S via the 132 kV lines. These are IPP-S, IPP-W, IPP-K and IPP-G. The active power ratings of the wind farms are as follows:
• IPP-S has a rating of 138 MW;
• IPP-W has a rating of 98 MW;
• IPP-K has a rating of 80 MW; and
• IPP-G has a rating of 111 MW.
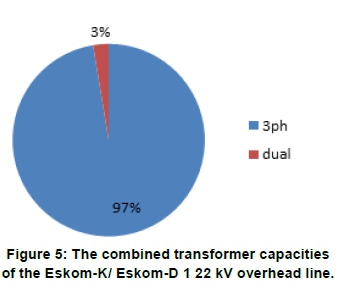
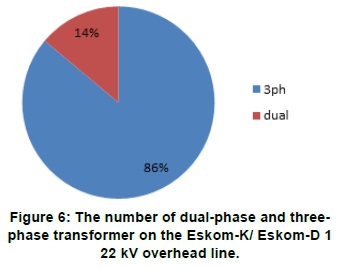
Eskom-K S/S has one 22 kV line which is named Eskom-K/Eskom-D 1 22 kV Overhead Line. The 22 kV line was analysed using Small World software. Most of the transformers on the Eskom-K/Eskom-D 1 22 kV overhead line are three-phase. Eskom-K S/S consists of two 66/22 kV 5 MVA transformers, a 66/66 kV 20 MVA voltage regulator and a 4.5MVARs capacitor bank. The total transformer capacity size on the overhead line is 24 369 kVA. About 97% of the transformer size on the line is three-phase and only 3% is due to dual-phase according to small world data as shown in Figure 5. There are 287 transformers in total. About 86% of the transformers are three-phase and only 14% of the transformers are dual-phase, as shown in Figure 6. The dual-phase transformers have a combined capacity of 634 kVA.
9.1.2 Source of Eskom-K voltage unbalance exceedances
The normalised cross correlation was used to determine the source of voltage unbalance at Eskom-K S/S. The entities that could contribute to the voltage unbalance were the load on the Eskom network and the wind farms (IPP-S; IPP-W; IPP-K and IPP- G).
Figure 7 shows the correlation of Eskom-M S/S 66 kV busbar voltage unbalance with Eskom-M S/S load and total wind active power from 17-24 August 2017 (eight days). The correlation at zero time shifts between Eskom-M S/S load and Eskom-M S/S 66 kV busbar voltage unbalance is -0.056 and is closer to zero. This implies that the load plays an insignificant role in producing the voltage unbalance at Eskom-M S/S 66 kV busbar. On the other hand, the cross correlation at zero time sample shifts between the total wind farm active power and Eskom-M S/S voltage unbalance is 0.955 and is close to 1. This shows that there is a strong correlation between the Eskom-M S/S 66 kV voltage unbalance and the wind farm active power and thus the voltage unbalance is caused by the wind farms. However, it is not obvious which wind farm is causing the voltage unbalance problem as there is no available voltage unbalance data from the wind farm sites.
Figure 8 shows the correlation between Eskom-M S/S 66 kV busbar voltage unbalance and Eskom-KS/S 22 kV voltage unbalance. The correlation at zero time sample shifts between Eskom-M S/S 66 kV busbar voltage unbalance and the Eskom-K S/S 22 kV busbar voltage unbalance is 0.927 and is close to 1. This means that the Eskom-K S/S 22 kV busbar voltage unbalance is due to Eskom-M S/S 66 kV busbar voltage unbalance. This in turn implies that the voltage unbalance problem at Eskom-K is caused by the wind farm(s). It was checked with other sites downstream Eskom-M S/S and was found that the wind farms are responsible for all the voltage unbalance of all the sites. This can be seen in Table 1.
Table 2 shows that the Eskom-K S/S 22 kV voltage unbalance and the load at sites that did not have the voltage unbalance data. The conclusion is that the voltage unbalance at Eskom-K is not due to these sites. It can also be noticed that the Eskom-K voltage unbalance is not due to its load as the correlation is -0.187 which is close to zero.
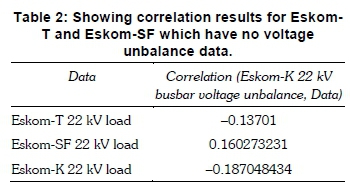
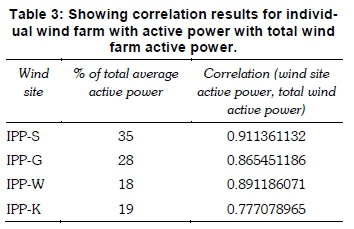
Table 3 shows that there is strong relationship between the individual wind farm active power and the total active power. This is because the wind farms experience the same wind profile and so generate almost the same active power profiles. It is therefore not possible to determine which individual wind farm is causing the voltage unbalance problems form this data alone. There was no voltage unbalance data from the wind farm sites. However, it should be noted that IPP-W has an 18% average but has a high correlation with wind total active power than IPP-K and IPP-G which have 19% and 28% average respectively. Thus IPP-W has less effective power but contributes the most to the voltage unbalance.
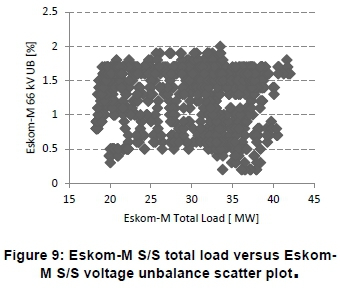
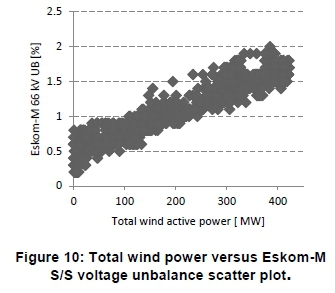
9.1.3 Eskom-M versus IPP scatter plots
Figure 9 shows the scatter plot for Eskom-M S/S total load vs the Eskom-M S/S 66 kV Voltage unbalance during the observation period (12 to 24 August 2017). There is no obvious linear relationship between the load and the voltage unbalance. This means that the load plays an insignificant role in the producing the voltage unbalance. On the other hand, Figure 10 shows the scatter plot of total active power generated by the wind farms versus the Eskom-M S/S 66 kV Voltage unbalance. There is clear linear relationship between the voltage unbalance and the total active power generated. This implies that the wind farms are the source of the voltage unbalance at Eskom-M S/S, which in turn correlates with the Eskom-K voltage unbalance.
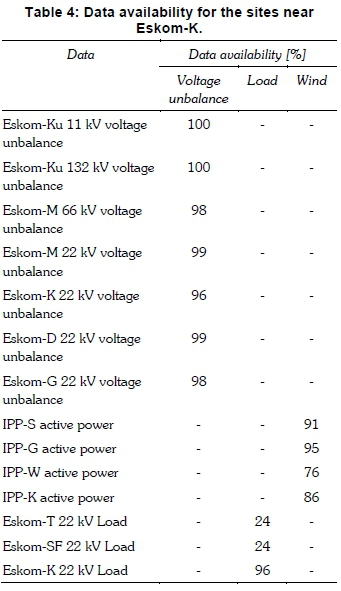
9.1.4 Eskom-K data availability
It should be noted that the conclusions drawn from the data depend on data availability. The data availability on data that was used is discussed in this section. Table 4 shows the data used and the corresponding data availability based on the observed period. The observation period was eight days, from 17-24 August 2016. There are 1152 samples expected per data observed since there are 144 samples per day. Data availability is thus the number of samples in the data acquired divided by the total expected samples during the period. The data availability is expressed in percentage format.
9.2 Case study two: Eskom-C voltage unbalance exceedance
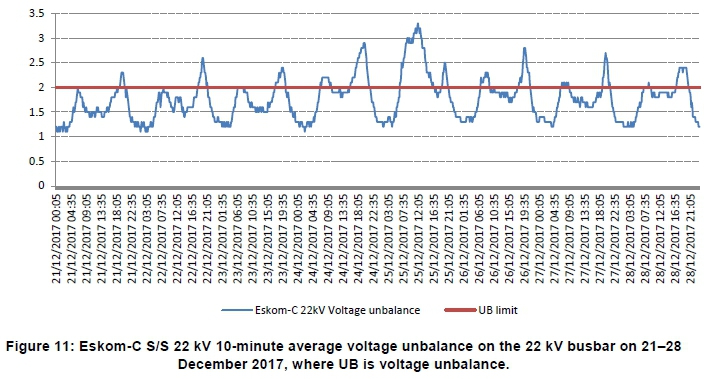
Figure 11 shows the Eskom-C 22 kV busbar voltage unbalance from 21-28 December 2017. The voltage unbalance limit violation occurs mostly during the load peaking times. The observed period was eight days, including the peak load times of Christmas day. Eight days is sufficient to get accurate results from cross correlation calculations.
The voltage unbalance at Eskom-C S/S 22 kV busbar was summarised in terms of number of ex-ceedances, as shown in Figure 12. The number of exceedances is plotted in six-month intervals starting from 1 January 2013 to 31 December 2017. Data availability is also plotted on the same intervals. It can be seen from the graph that the number of ex-ceedances in the first six months in each year is lower than the exceedances in the second six months of the same year. The number of exceed-ances increases with the increase in years. Although data availability is low during the years 2015 to 2017, the number of exceedances is high compared to 2013 and 2014. The number of exceedances started to increase during 2015. This was the year in which the IPP-Th wind farm was commissioned, but it will be shown that IPP-Th wind farm was not the source of voltage unbalance exceedances at Eskom-C S/S 22 kV busbar.
9.2.1 Eskom-C network information
Figure 13 shows the Eskom-C S/S and its neighbouring substations. Eskom-K S/S is supplied from Eskom-Pr, Eskom-V transmission substations and from the IPP-Th wind farm.
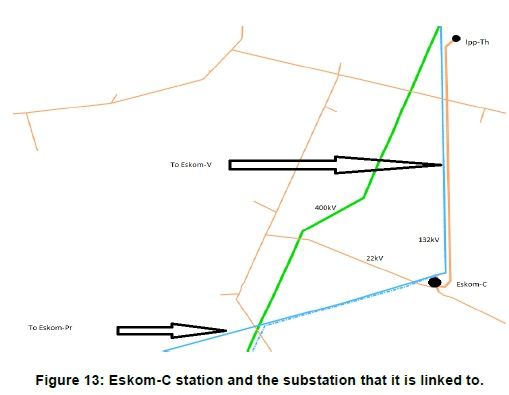
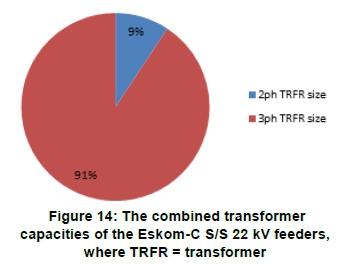
The Eskom-C S/S 22 kV overhead lines consist mainly of three-phase transformers. Eskom-C S/S has two 22 kV overhead lines: Eskom-C/Eskom-A and Eskom-C/Eskom-R 22 kV. There is also a 21 MW wind farm (named IPP-Th) supplying Eskom-C S/S on the 22 kV busbar. The total transformer capacity size is 10 382 kVA. About 91% of the transformer size on the Eskom-C S/S 22 kV overhead lines are three-phase and only 9% are dual-phase transformers according to small world data as shown Figure 13. There are 213 transformers in total.
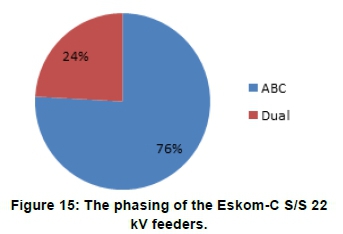
About 76% of the transformers are three-phase and 24% of the feeders are dual phase as shown in Figure 14. The dual-phase transformers have a combined capacity of 563 kVA.
9.2.2 Source of Eskom-C voltage unbalance exceedances
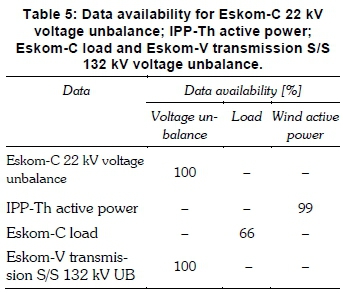
The normalised cross correlation was used to determine the source of voltage unbalance at Eskom-C S/S. The entities that could contribute to the voltage unbalance were Eskom and the IPP-Th wind farm. Figure 16 shows the cross correlation between the Eskom-C S/S 22 kV busbar voltage unbalance; Eskom-C 22 kV busbar load; IPP-Th wind farm active power and Eskom-V transmission S/S 132 kV voltage unbalance. The cross correlation between the Eskom-C S/S 22 kV busbar voltage unbalance and Eskom-V transmission S/S 132 kV voltage unbalance at zero time sample shifts is 0.9692. The cross correlation between the Eskom-C S/S 22 kV busbar voltage unbalance and Eskom-C 22 kV busbar load at zero-time sample shifts is 0.686. The cross correlation between the Eskom-C S/S 22 kV busbar voltage unbalance and IPP-Th wind farm active power at zero-time sample shifts is -0.211.
The Eskom-V transmission S/S 132 kV voltage unbalance has the highest correlation with the Eskom-C S/S 22 kV busbar voltage unbalance. This means the voltage unbalance exceedances at Eskom-C S/S 22 kV busbar are due to the Eskom-V transmission S/S 132 kV busbar voltage unbalance. The Eskom-V 132 kV unbalance is intern caused by the unbalanced networks that are linked to Eskom-V S/S. The Eskom-C load does contribute to the unbalance exceedance; however, it plays a small role compared to the Eskom-V S/S. The IPP-Th wind farm reduces the voltage unbalance at Eskom-C as it has a correlation of -0.211 which is less than 0.
9.2.3 Eskom-C load versus voltage unbalance scatter plots
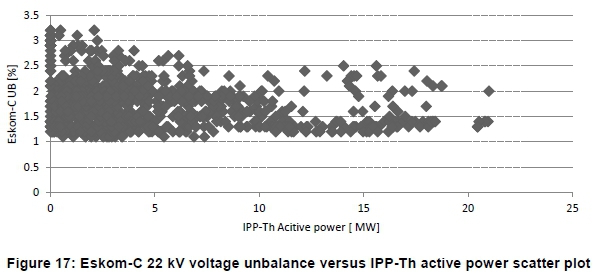
Figure 17 shows the Eskom-C 22 kV voltage unbalance versus IPP-Th active power scatter plot during the observation period (21 to 28 December 2017). There is no obvious linear relationship between the IPP-Th active power and the Eskom-C 22 kV voltage unbalance. This means that the wind farm plays an insignificant role in the producing the voltage unbalance.
Figure 18 shows the Eskom-C 22 kV voltage unbalance versus Eskom-C load scatter plot during the observation period (21 to 28 December 2017). There is a linear relationship between the Eskom-C load and the Eskom-C 22 kV voltage unbalance.
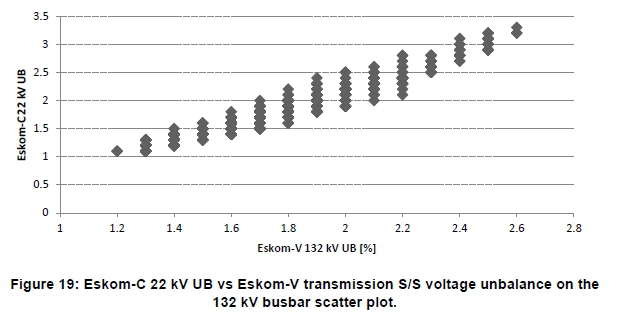
Figure 19 shows the Eskom-C 22 kV voltage unbalance versus Eskom-V transmission S/S voltage unbalance scatter plot during the observation period (21 - 28 December 2017). There is an obvious linear relationship between the IPP-Th active power and the Eskom-C 22 kV voltage unbalance.
9.2.4 Eskom-C data availability
The conclusions drawn from the Eskom-C S/S data depend on data availability, so the data availability on data that was used is discussed in this section. Table 5 shows the data and the corresponding data availability over the observation period of eight days, from 21-28 December 2017. There are thus 1152 samples expected per data observed, since there are 144 samples per day. Data availability is the number of samples in the data acquired divided by the total expected samples during the period. Data availability is expressed in percentage format.
9.3 Case study three: Eskom-Z voltage unbalance exceedance
Figure 20 shows the Eskom-Z 11 kV voltage unbalance from the 1 April to 31 August 2011. The voltage unbalance on the 11 kV was below the 2% limit before 22 May but there was reoccurring voltage unbalance limit exceedance after 12 June. There were no records for voltage unbalance after 22 May to 12 June for the 11 kV voltage unbalance. The exceed-ances occurred after network reconfigurations.
A vectograph was not installed for the 22 kV busbar as there are no readings of the 22 kV busbar voltage unbalance in 2011. The voltage unbalance increase at Eskom-Z S/S corresponds with the decommissioning of an Eskom-Z 66 kV line and commissioning of a Eskom-Z S/S 132 kV lines with traction stations.
9.3.1 Eskom-Z network information
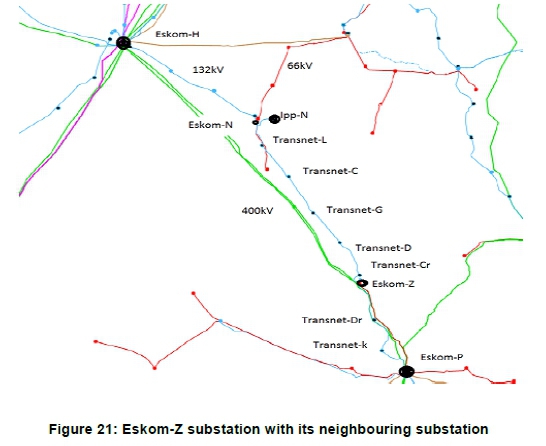
Figure 21 shows the Eskom-Z S/S and its neighbouring S/S. Eskom-Z is a 132/22/11 kV S/S, supplied from the Eskom-H transmission station in a ring feed via Eskom-N and Eskom-P S/S. Under normal operating conditions, active power flows from Eskom-H to Eskom-Z and Eskom-P S/S. There is an IPP-N wind farm connected at Eskom-N S/S. There are five traction stations between Eskom-N and Eskom-Z S/S on the 132 kV network and two tracking stations between Eskom-P and Eskom-Z S/S.
The Eskom-Z S/S 11 and 22 kV networks consist mainly of three-phase transformers. It has four 22 kV feeders and four 11 kV feeders. Two of the four 11 kV feeder bays feed a municipality with a notified maximum demand (NMD) of 4MVA. These are called Munic 1 and 2. There is one large power user (LPU) on the 22 kV busbar, with has an NMD of 1MVA.
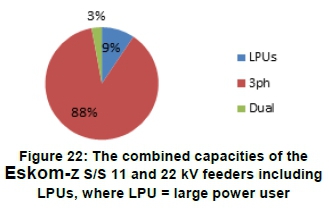
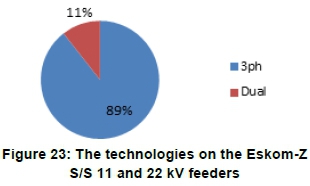
The combined 11 and 22 kV Eskom-Z S/S transformer capacity including LPUs is 95645 kVA. About 88% of the transformer size is three-phase, 9% is due to LPUs and only 3% is due to dual-phase according to small world data as shown Figure 22. There are 1177 transformers in total. About 89% of the transformers are three-phase and only 10% of the transformers are dual phase, as shown in Figure 23.
9.3.2 Source of Eskom-Z exceedances
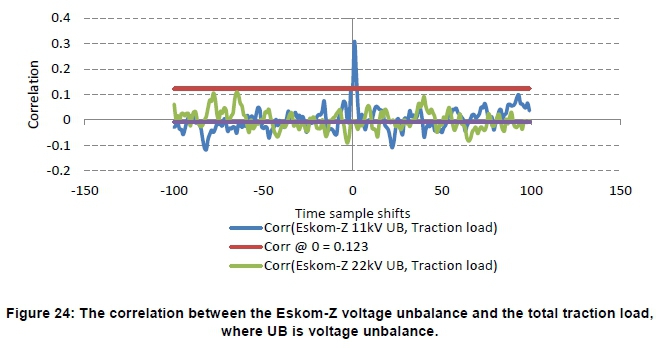
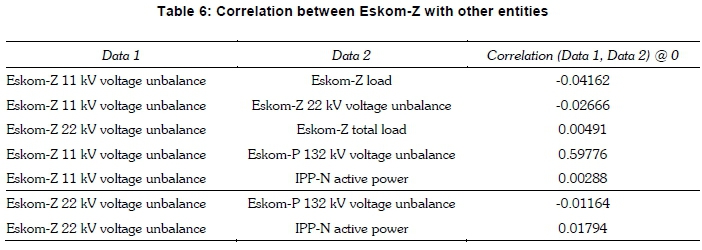
The normalised cross correlation and variance were used to determine the cause of the unbalance at the Eskom-Z 11 kV and 22 kV busbars. The data used was from 21-24 December 2017. The entities that could contribute to the voltage unbalance were the load on the Eskom network, Transnet traction load and the IPP-N wind farm. The correlation between the Eskom-Z 11 kV busbar, 22 kV busbar voltage unbalance and the traction load is shown in Figure 23, which shows that there is a correlation of 0.123 between the Eskom-Z 11 kV voltage unbalance and the traction load at zero sample time shifts. There is a -0.00777 correlation between the Eskom-Z 22 kV busbar and the traction load at zero sample time shifts. These correlation values are quite small and close to zero. In this case, the correlation method fails to identify the source of voltage unbalance. This calls for an alternative method for identifying the source of voltage unbalance exceedances. The variance was used as an alternative tool to determine the source of voltage unbalance exceedances.
Table 6 shows the Eskom-Z S/S voltage unbalance correlation with other entities in the network. The correlation values are low. The correlation method failed to identify the source of voltage unbalance exceedances. The variance will be used to determine the source of the exceedances.
9.3.3 Determination of unbalance exceedances using the variance
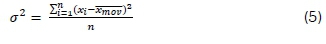
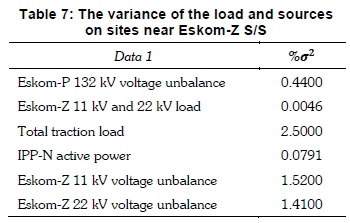
The variance of data X can be calculated using Equation 5. It should be noted that the moving av-erage was used to determine source of voltage un-balance in this case but generally a standing average is used. The variance was used to measure the de-gree of dispersion of data. For the purpose of data comparison, the variance was calculated using normalised data with respect to the maximum. Normal-ization was conducted on the data recorded from 21-24 December 2017. It was ensured that the ac-curacy between the normalised data average and its corresponding moving average was two decimal places. Table 7 was constructed to record the vari-ous variances.
where
•σ2 is the variance of data X;
• i is the sample number in data X;
• n is the number of samples of the data X;
• xj is the ith sample in data X; and
•
is the moving average of data X.
It can be seen from Table 7 that the source of the voltage unbalance limit exceedance on the 11 kV and 22 kV busbars at Eskom-Z S/S was the traction station load. The variance of the traction load was 2.5%. The Eskom-Z S/S 11 and 22 kV busbar voltage unbalance variances were 1.52% and 1.41% respectively. The traction load variance was the highest variance for the source of unbalance and corresponds with the high variances on of the Eskom-Z 11 and 22 kV busbar voltage unbalance.
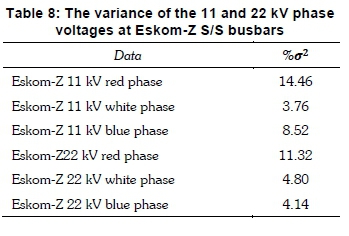
The voltage regulation data on the 22 kV and 11 kV busbar showed a high variance on the red phase, as can be seen in Table 8. This means that the red phase is the phase most used by the traction stations.
9.3.4 Eskom-Z data availability
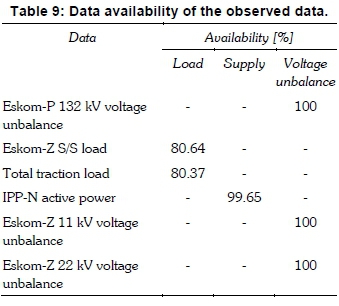
It should be noted that the conclusions drawn from the data depends on data availability, so the data availability on data that was used is discussed in this section. Table 9 shows the data used and the corresponding data availability based on the observed period. The observation period is eight days, from 21-28 December 2017. There are thus 1 152 samples expected per data observed, since there are 144 samples per day. Data availability is thus the number of samples in the data acquired divided by the total expected samples during the period. Data availability can be expressed in percentage format.
10. Conclusions
The normalised cross correlation can be used to determine the source of voltage unbalance. When the cross correlation does not work, alternative methods must be used. The variance was used to replace the correlation method in one of the case studies. The grid code does not specify how the voltage unbalance caused by various entities should be handled. The normalised cross correlation method must be used to govern the entities contributing to voltage unbalance of the grid. The normalized cross correlation should be used in the grid code to govern voltage unbalance related issues. The normalized cross correlation value for wind farms should be less than or equal to zero.
References
Dold, A.J., Ally, M., Balgobind, P., Bhana, D., Cretchley, D.H., Erasmus, D., Geldenhuys, H., Johnson, P.A., Koch, R.G., Kruger, D., Küster, M.W., Langbridge, I., Maminza, L. G., Marloth, R., McCurrach, R., Nkalashe, M.V., Nxumalo, D., Schult, C.F. and Sigwebela, I. 2003. Electricity supply - quality of supply: Voltage characteristics, compatibility levels, limits and assessment methods. Standards South Africa. Pretoria. 22-23 . [ Links ]
Pimple, B.B, Vekhande, V.Y. and Fernandes, B.G. 2010. New direct torque control of DFIG under balanced and unbalanced grid voltage. TENCON 2010 - 2010 IEEE Region 10 Conference. 2154-2158. [ Links ]
Magoro, B. and Khoza, T., South African Bureau of Standards 2014. Grid connection code for renewable power plants (RPPs) connected to the electricity transmission system (TS) or the distribution system (DS) in South Africa.' South African Bureau of Standards. Pretoria. [ Links ]
Bollen, M. 2002. Definition of voltage unbalance.' Institute of Electrical and Electronics Engineers. Power engineering review, vol. 22, no. 11, pp. 49-50. [ Links ]
Pillay, P. and Manyage, M. 2001. Definitions of voltage unbalance. Institute of Electrical and Electronics Engineers. Power engineering review. vol 21. no 5. pp 50-51. [ Links ]
Kearney, J. and Conlon, M.F. 2007. Analysis of a variable speed double-fed induction generator wind turbine during network voltage unbalance conditions. 42nd International Universities Power Engineering Conference. Brighton. England. pp 1060-1064. [ Links ]
Kearney, J., Conlon, M.F. and Coyle, E. 2009. The integrated control of the rotor side and grid side converters in a DFIG to reduce both power and torque pulsations during network voltage unbalance conditions. 2009 44th International Universities Power Engineering Conference (UPEC). Glasgow. Scotland. pp 1-5. [ Links ]
Corresponding author: Tel: +27 43 703 5998; email: Ntsadun@eskom.co.za

