


Services on Demand
Article
 English (pdf)
 Article in xml format
 Article references
Indicators

Related links
-
 Cited by Google
 -
 Similars in Google
Share

 Permalink
Journal of Energy in Southern Africa
On-line version ISSN 2413-3051
Print version ISSN 1021-447X
J. energy South. Afr. vol.30 n.2 Cape Town May. 2019
http://dx.doi.org/10.17159/2413-3051/2019/v30i2a5409
ARTICLES
doi: http://dx.doi.org/10.17159/2413-3051/2019/v30i2a5409
Positioning South Africa's energy supply mix internationally: Comparative and policy review analysis
Vanessa NdlovuI, *; Roula Inglesi-LotzII
IDepartment of Economics, University of Pretoria, Main campus, Tukkiewerf building, Pretoria 0002, South Africa. https://orcid.org/0000-0001-7625-227X
IIDepartment of Economics, University of Pretoria, Main campus, Tukkiewerf building, Pretoria 0002, South Africa. https://orcid.org/0000-0001-7509-4687
ABSTRACT
Optimisation and diversification of South Africa's energy generation mix is fundamental to meeting its developmental goals and enhancing the crucially important security of supply. South Africa should investigate means to diversify its generating capacity. With the growing demand, South Africa has reached a point where other methods of power generation need to be considered and implemented. This study gives a detailed description of the South African energy supply mix, its evolvement in the past 25 years, and assesses how South Africa fares in comparison with other countries such as its BRICS companions (Brazil, Russia, India, and China) and in the Organisation for Economic Co-operation and Development (OECD), in terms of its current and future energy mix. It was found that the total primary energy supply (TPES) share of non-OECD countries is becoming more prominent, with China, India, and Russia being significant contributors. The OECD's ratio of universal TPES decreased from 1990 to 2015. There is a heavy reliance on fossil fuels in the BRICS countries, which appeals to appropriate policies to influence and guide the transition from the current fossil fuel-dominated energy supply mix to one that follows international trends but, most of all, appreciates its specific geographic position and natural resources.
HIGHLIGHTS:
• Current South African energy supply mix compared to BRIC and OECD.
• Comparison study of the different regions' energy supply mixes.
• Global TPES share BRICS, is becoming more prominent.
• OECD's share of global TPES has been decreasing.
Keywords: renewable energy; green economy; BRICS; OECD
1. Introduction
Optimisation and diversification of South Africa's energy generation mix is fundamental to meeting the various developmental goals and enhancing the crucially important security of supply. Taking into consideration the country's growing population and the aging power plant fleet, South African energy policymakers have to make critical decisions for the energy supply mix in the future. The supply mix is currently dominated by generation from fossil fuels such as coal, oil and gas - major pollution contributors and especially affecting air quality. South Africa is responsible for over 50% of Africa's emissions, because of its extensive coal use, of which less than 40% is transformed into useful energy (Boden et al., 2011). According to the Department of Environmental Affairs (DEA, 2010), the largest contributor to greenhouse gas emissions is the energy generation sector, as it accounts for more than 80% of South Africa's emissions, while the largest source of emissions by fuel is the combustion of coal, gas and oil. Globally, the electricity sector has shifted from a primary reliance on fossil fuels to alternative energy solutions (Foster et al., 2017).
South Africa is evidently catching up to the trend of transitioning to alternative energy solutions with its renewable energy initiatives, including the Renewable Energy Independent Power Producer (REIPP) Procurement Programme. This was initially determined in August 2011 by the Minister of Energy through the Electricity Regulation Act Number 4 of 2006 (Government Gazette, 2006), requiring that 3 725 MW of energy be generated from renewable energy sources. According to the Minister, REIPP had to procure the 3 725 MW and contribute it towards socio-economic, sustainable growth, creating jobs and developing the country's renewable energy industry, (Department of Energy (DoE), 2015). The next Ministerial determination in December 2012 required a further 3 200 MW of renewables generation capacity to be procured from independent power producers (IPPs). A third determination in August 2015 gave provisions for procurement of a further 6 300 MW of renewables generation capacity from IPPs. On the 4th of April 2018, Minister of Energy, Jeff Radebe, signed additional agreements for the twenty seven projects to be procured under bid (Phases or so-called Windows 3.5 and 4). The Minister highlighted that:
The procurement of the 27 new projects was the biggest IPP procurement by the Department of Energy to date, representing a total of R56 billion of investment and about 2300 MW of generation capacity to be added to the grid over the next 5 years. He also indicated that this investment of R56 billion injected by the private into the economy, with no contribution from Government other than support to Eskom in the event of a default by the buyer. This will have a positive impact on the economy and competition in the energy sector will certainly benefit the consumer. (DoE, 2018).
It is imperative to examine the status quo of the country's energy supply mix and it's positioning visa-vis international trends for future policy recommendations and implementation. Policymakers should comprehend the historical evolution of the supply mix, as energy investments are not shortterm and depend heavily on the established supply mix of the past. In addition, international trends give a direction of the global energy markets and potential trends that South Africa can follow.
The objective of the present study is to give a detailed description of South Africa's energy supply mix, how it has evolved through the years, as well as to assess how South Africa fares in comparison with its BRICS and OECD counterparts in terms of its current and future energy mix. The study begins with an overview and description of South Africa's energy supply mix over the years, then explores the current energy supply mix and, lastly, compares the South African energy supply mix with the world in respect to BRICS and OECD countries' energy supply mix.
2. Literature review
Many developing countries are experiencing energy deficiencies, resulting from shortages in supply and poor infrastructure, which affect their economies (Ateba & Prinsloo, 2019; Pollet et al., 2015). This challenge will be exacerbated by increasing demand in the future. Most industrial sectors, such as the manufacturing sector in India, have been negatively affected and exports have decreased (Allcott et al., 2016). The primary energy supplies are also experiencing a decline because of the notable increases in the cost of fossil fuels. Fuel imports, particularly oil, are a burden on most economies (International Energy Agency (IEA), 2016). Most developing countries such as South Africa intend to increase local energy supplies and the renewable energy sector has been recognised as a fundamental target area. It is important for a country to generate a multiple energy strategies and expand the share of sustainable and local energy resources, given that energy is an important element for sustainable development and prosperity.
Establishing an optimal energy supply mix when transitioning from a fossil fuel-dominated mix, renewable energy is important when creating greener low-carbon energy systems with enough load-following capabilities. Several studies have been conducted in determining the optimal combination of fossil fuels as well as renewable energy sources in determining a sustainable and optimal energy supply mix (Amer & Daim, 2011; Cararo et al., 2014; Vidal-Amaro et al., 2015). Vidal-Amaro et al., (2015) proposed the use of a 'Minimum Total Mix Capacity (MTMC) method to evaluate several scenarios of Renewable Energy Supply (RES) incorporation in the Mexican electricity system to obtain capacity mixes of RES and fossil fuels', so as to generate an electricity system by considering the hourly values of RES production and electricity demand. The Mexican Congress announced that fossil fuel-based electricity generation must be limited to 65% by 2024, to 60% by 2035 and to 50% by 2050 (Vidal Amaro et al., 2015). Minimum complementary fossil fuel capacity that is required for the demand without electricity imports is checked to ascertain the total mix capacity for the transition system. When using the MTMC methodology, biomass, wind and solar power mergers acquire at least 35% RES electricity production; only one merger can result in the minimum overall capacity, which makes the optimal mix (Vidal Amaro et al., 2015).
Amer & Daim (2011) investigated Pakistan's renewable energy electricity generation alternatives. The analytic hierarchy process was first used in that country's energy sector to choose and prioritise multiple renewable energy technologies for generating electricity. A model composed of the goal, criteria, sub-criteria and alternatives was formulated. It consisted of wind energy, solar photovoltaic (PV), solar thermal and biomass energy variants. The outcomes of the proposed decision model can be utilised for developing a long-term renewable energy policy.
As stated by the IEA (2014), renewables may improve energy security through reducing reliance on imported fuels and fossil fuels; thereby help to diversify the power mix. Renewables can be positioned in a decentralised manner, which allows them to be more quickly deployed than centralised power plants. They can create employment for locals through their deployment and maintenance activities. Renewables are also important as they help to provide energy access to remote communities. This IEA outlook also indicated that the share of renewables in total capacity is set to 44% by 2040.
Other studies indicated and highlighted the importance of incorporating renewable energy into a country's energy mix (Apergis & Payne, 2010; Inglesi-Lotz, 2015). As reported in Apergis & Payne (2010), renewable energy will not only solve the problems that are linked to the present energy consumption patterns and provide modernisation of the energy sector, but will also advance sustainable development objectives. Inglesi-Lotz (2015) also highlighted that there is an advantage in government policies that promote renewable energy by initiating renewable energy markets and portfolio standards, not only to improve environmental conditions, but also from a macroeconomic point of view.
Literature also showed that there are deficiencies in the strategic management and policy implementation of the South African energy supply system, which has been a major contributor to the energy crisis, Ateba & Prinsloo (2019), evidenced this in the study which focused on the effective strategic management of electricity in South Africa. It was found that 'various strategic management failures and the lack of an integrated approach have been a major stumbling block to energy supply sus-tainability in the country'; and suggested that an integrated strategic management framework would be an effective approach to achieving electricity supply sustainability in South Africa. A similar sentiment was expressed by Pollet et al., (2015), which highlighted that, even though South Africa has been seen as the 'powerhouse of Africa', it faces an electricity supply crisis and has failed to supply enough electricity for its economy for the past 40 years. This study stated that government energy and efficiency initiatives should be emphasised on oil and gas exploration; and recommended that off-grid renewables and hydrogen energy could be considered as potential generation alternatives.
As stated in the 2010 Integrated Resource Plan (IRP) (DoE, 2011) the South African government intends to expand its independent power creation. This will be done by measures that include, but not limited to, ensuring that there is renewable energy generation: self-generation and co-generation. The IRP also stated that the involvement of IPPs will include important benefits such as the relative speed at which they can be brought to accomplishment, the lessening of Eskom's resource burden on financing, new facilities and improvement of South Africa's renewable energy profile (DoE, 2011).
According to Montmasson-Clair & Ryan (2014), 'National electricity planning, as part of energy policy, has emerged internationally as the most effective and efficient framework to shape the development of the electricity supply industry (ESI)'. The paper states that internationally, numerous administrations have ingrained electricity planning into an IRP. The IRP meets the estimated demand in a set period and does so affordably as well as efficiently. It also takes into cognisance equity issues, environmental protection, reliability as well as other country-specific goals. The IRP should minimise the present and future costs of meeting energy demand, recognising the impacts on utilities, government, the environment and society.
According to the South African Department of Energy, the IRP is synchronised for generation expansion and demand-side intervention programmes because of the multiple criteria to meet electricity demand (DoE, 2011). It is described in the Electricity Regulation Act Number 4 of 2006 (Government Gazette, 2006) to cover the period 2010-2030. The IRP supports private generation and power supply acquisitions from regional projects. The programme regulates the timing and project mix and states how the National Energy Regulator will license such projects. The IRP does not advise or consider the ownership of the project construction or their location. The IRP plans for both capacity additions and operating regimes of these capacities.
The 2010-2030 IRP noted the favoured generation technology needed to meet the anticipated demand growth up to 2030. A policy-adjusted IRP update draft was released in November 2016 for consultation and included several government objectives such as affordable electricity, carbon mitigation, decreased water use, localisation and regional growth, making a balanced strategy in varied electricity generation sources, and gradual decarbonisation of the South African electricity sector. Progress has been identified since the promulgation of the IRP Ministerial determinations that include renewable energy, nuclear, coal and gas have been issued. The IRP is the government's plan for new generation capacity and it will be replaced by an updated plan in the future. Several assumptions have changed and these include:
• the changed electricity demand and the link with economic growth in the past three years;
• new local and global technology and fuel developments;
• carbon mitigation blueprints and the influence on electricity supply up to 2050; and
• electricity affordability and its impact on demand and supply.
Key assumptions that have changed include technology costs, electricity demand projection, fuel costs, and Eskom's existing fleet performance (DoE, 2016). Gauché et al., (2012) argue that the IRP 2010 recommended energy mix is excessively dependent on unsustainable resources that are also at risk in the short-to-medium term. Coal and other conventional resources may be limited, and if this assumption were correct, action needs to be taken rapidly. The concentrated solar panel (CSP) is the only maintainable and dispatchable energy technology that can supply a significant portion of South Africa's electricity needs (Ateba & Prinsloo, 2019). A proportional mix of PV, wind and CSP can provide South Africa's energy supply, but there is a need to take advantage of the localisation potential and excellent sustainable energy resources.
Several options can be used to check the alternatives that are available to South Africa between now and 2050 as per the 2016 IRP update projections. The list includes resource size, demand matching and cost; learning rate; technology risk; resource availability risk; national security risk; environmental risk; localisation potential; local participation; industrialisation; and export potential. These options should be examined in detail as they present an analysis of resource size, localisation potential and demand matching.
The substitutes to base load and peaking fit in the shrinking substitute group with some dependence on hydro imports, with the current focus of the IRP being on risk avoidance. This implies that the risk mitigation is paradoxical if the discussed forecasts were accurate. Studies such as (Fluri, 2009; Viebahn et al., 2011; Craig et al., 2017) have observed that CSP seems to be the ultimate solution. Although this technology may be ideal for post-fossil energy supply, cost and maturity are found to be limitations. As also found in Gauché et al., (2012), a system of CSP plants would be expensive despite its ability to provide all energy needs. A similar energy system with the same certainty would presumably consist of all three renewable types in the same proportion. The conclusion was that assuming that the storage potential offered by CSP will remain the most efficient and economical storage for utility scale power generation, an optimal mix of CSP with other renewables will be essential.
In evaluating energy policy and incentives, Musango (2011) highlighted the South African policy status and incentives that affect replaceable electricity generation, electricity generation initiatives and their challenges. The policy implications and recommendations in support of future renewable electricity generation includes, organising a coordinating agency, generating public awareness, providing financial support guarantees, capacity building, and development of skills. The conclusion was that the potential for developing wind, solar, biomass and small-scale hydro renewable electricity in South Africa is acknowledged.
Current South African policy, especially the IRP, encourages growth of renewable electricity creation. The announcement and the beginning of the REIPPP bidding process accelerated the extensive execution of renewable electricity creation. There are, nevertheless, still several obstacles. Schedules and policies must be created such that they can expedite the execution and implementation of electricity technologies. The proposed strategies in the present study include the creation of an organising committee; increasing public awareness; investment assurances; and capacity and skills development.
3. Methodology and data
Collier (1993) stated that using comparative analysis can provide the foundations for proper descriptive analysis towards formulation of hypotheses and theories, offering differences and similarities of the studied objects. Nakumuryango & Inglesi-Lotz (2016) also highlighted that South Africa is classified as a two-tiered economy; the first being its primary sectors that include mining and agriculture; manufacturing; and the financial sector. It is more advanced and well developed when compared with international markets. The second tier consists of the informal sector and the general poor conditions in some sectors of economy. Hence, to adapt to South Africa's economic nature and for a more comprehensive comparative analysis for the present study, South Africa was compared with OECD countries and its other BRICS counterparts, which are developed and developing countries respectively. The BRICS countries are Brazil, Russia, India, China and South Africa, which share a major characteristic as being emerging economies. The World Economic Forum (2011) ranked South Africa favorably in comparison with other BRICS countries. South Africa is also committed to the African unity and integration within the Constitutive Act of the African Union (AU) (African Union, 2000). This includes the reinforcement of continental institutions, which are important in acknowledging the continent's challenges of poverty, underdevelop-ment, energy security and stability. South Africa, through its BRICS membership, ensures that other African countries are at an advantage and continue to gain energy; information and communications technology; rail and road infrastructure; and agriculture and food security from the BRICS countries.
South Africa also has characteristics of developed countries, rendering it important to compare and contrast the South African energy supply mix to that of OECD countries, looking at differences, gaps and potential of their energy supply and mix compositions. For each region, the constitution of the energy mix is influenced by the domestic presence of usable resources or the possibility of imports; the extent and type of energy needs to be addressed; and policy choices guided by historical, economic, social, demographic, environmental and geopolitical factors. Considering this, additional indicators such as the electricity generation mix for each of the countries are compared. Controlling for the size of the economy by normalising the total primary energy supply (TPES) with gross domestic product (GDP) would provide valuable insights, both for the evolution of the South African TPES in comparison with the country's economic growth, as well as when comparing with countries of different economic size.
The data used for the comparative analysis exercise is that of the TPES, measured in kilotons of oil equivalent (ktoe), of the BRICS and OECD energy balances, obtained from the IEA database in 19902015. The TPES is energy production plus energy imports, minus energy exports, minus international bunkers, then plus or minus stock changes (depending on whether the net stock is an inflow or outflow).
TPES = (energy production + energy imports) - energy exports - international bunkers ± stock changes (1)
This gives a holistic picture of the primary energy mix for all the selected country groups. The energy mix alludes to how the final energy consumption for a geographical region is broken down by primary energy source. It comprises fossil fuels, nuclear energy, waste and other types of renewable energy, including biomass, wind, geothermal, water and solar. These energy sources are used to generate electricity, produce transportation fuel, as well as for heating and cooling in residential and industrial buildings.
4. Comparative analysis
4.1 South African energy supply mix over the years
The South African electricity supply has been dominated by Eskom, as described by Lloyd (2012):
Eskom was established in 1923 in terms of the Electricity Act (1922), following the amalgamation of several private enterprises. It grew regionally in a number of 'undertakings', each with their own generating facilities. Distribution was primarily by municipalities, who bought power from their own local undertaking. The local undertakings constructed comparatively small power stations to service these local markets. The power stations were fuelled by coal, generally delivered by rail. There was comparatively little long-distance transmission of power. As a result, many rural areas had no access to electricity.
Bigger and more economically efficient power stations were built near the coalfields as it cost less to transmit electricity by wire than to transport coal by rail. The profits that were gained from the export business enabled the power utility to buy large quantities of coal. (Lloyd, 2012). Big coal-powered stations were then built. 'There were eight such stations of 600 MW units, each with its own boiler, generator and associated facilities: Kriel (1973), Duvha (1975), Matla (1977), Tutuka (1984), Lethabo (1985), Matimba (1986), Kendal (1987)and Majuba (1996)' (Lloyd, 2012). The Koeberg nuclear power station was constructed in Cape Town in 1984 with a 1940 MW installed capacity.
Currently, the main source of electricity generation is through coal-fired power plants, which contribute 93% of the 42 000 MW generating capacity. Eskom supplies approximately 95% of South Africa's electricity and more than 45% of Africa. Eskom uses various technologies to generate electricity, the combination of which is called the 'plant mix' Eskom has several, wind, solar, tidal, wave and biomass energy research projects. Coal-fired base load power stations are the biggest plants and they run 24 hours a day Eskom's Generation Division has 13 coal-fired power stations with an installed capacity of 37 745MW. Their total net output, excluding the power consumed by their auxiliaries and generators currently in reserve storage, is 35 650 MW (Eskom, 2015).
4.2 South Africa in BRICS
The BRICS countries' role in the world energy picture becomes more noteworthy when ranking countries by TPES, with four of them featuring in the IEA key world energy trends (IEA, 2016). Table 1 shows that China ranked first, accounting for 22% of global TPES; and India and Russia third and fourth respectively. It is assumed that South Africa was included within the remaining rest of the world category which accounted for 37% of global TPES. Within the BRICS group, China was the main contributor of TPES in 2015, with approximately 60% of the total BRICS contribution; followed by India at 17% and the rest with smaller contributions (Russia, 14.27%; Brazil, 5.99%; and South Africa, 2.86%) (IEA, 2016). For comparative purposes, South Africa was included in Table 1, even though it did not feature in the top ten ranking, as it only contributed 1% to the global TPES. When normalising the TPES with South Africa's GDP (looking at the ratio of TPES divided by GDP), but also when comparing with countries of different economic size such as those in the top 10 ranking in the table, South Africa still featured at the bottom of the ranking with the lowest GDP and TPES.
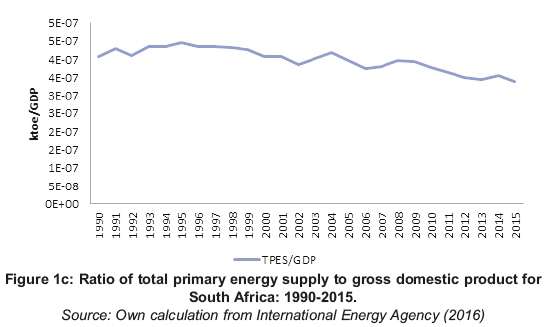
Figures 1a, 1b and 1c highlight the South African TPES source shares for the period 1990 to 2015. During this time, it can be noted that coal and crude oil were the dominant sources, followed by biofuels and waste (possibly as the result of agricultural influences). South Africa had 66.7 billion tons in coal reserves in 2016 which is equivalent to 7% of the world's total (Department of Energy, 2016). The fuel shares of TPES in South Africa had not shown significant changes between 1990 and 2015, with coal decreasing by only 1.87% from 69.57% in 1990 to 67.70% in 2015, and crude oil increasing by 0.97% from 13.13% in 1990 to 14.10% in 2015.

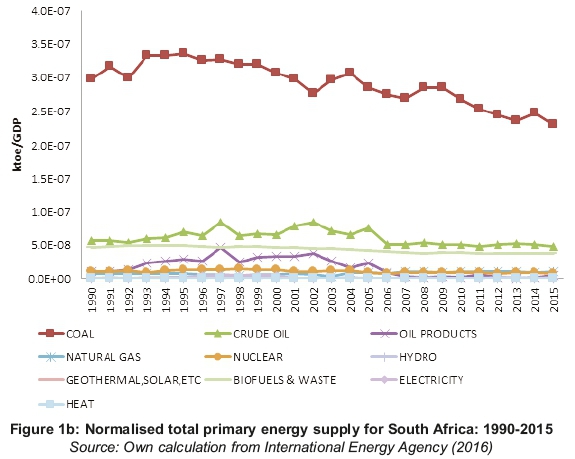
 ,
,
Biofuel creation and use was marginally lower in South Africa (10.89% in 1990 and 11.09% in 2015) when compared with BRICS as a whole (13.87% in 1990). Biofuels in TPES had reduced between 1990 and 2015 in the BRICS countries (7.89% in 2015) because of increased electrification. Coal continued to represent a dominating share in TPES. Between 1990 and 2015 the share of coal has increased constantly over the years for the BRICS, influenced primarily by increased consumption in China, with coal reaching 48.71% in 2015 from 30.40% in 1990. The impact of the 2008 global economic crisis as well as the electricity crises in South Africa in 2008 can be seen in Figure 1c, where there was a decline in the normalised TPES/GDP
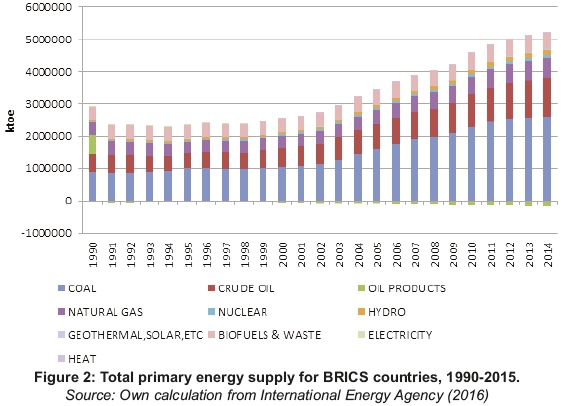
As illustrated in Figure 2, TPES for all the BRICS countries more than doubled from 2 286 731 ktoe in 1990 to 5 037 396 ktoe in 2015. In terms of energy, the BRICS countries accounted for 37% of the world energy demand (IEA, 2014). Although in these countries the population growth since the 1990s had been considerable, its effect was not proportional to all energy types as steep increases could be observed for natural gas and crude oil, compared with the rest.
In Figure 3, it can be noted that China had the largest contribution in fossil fuels energy production in 2015 contributing 61% to the total BRICS TPES, followed by Russia with 17%.

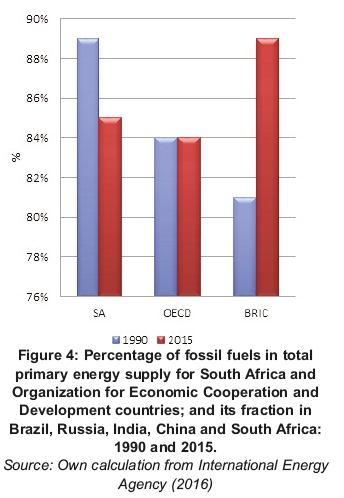
Over the years, BRICS countries remained dependent on fossil fuels for their energy production as well as for export. In 2014 The BRICS countries combined contributed approximately 38 % of global carbon emissions. With China's share of the contribution making up more than 24 % of the global total, surpassing India the second largest emitter in the group (Green Peace, 2015) (Green Peace, 2015). Figure 4 illustrates the share of fossil fuels to the total supply mix in South Africa, the OECD and BRICS countries in 1990 and 2015. The TPES from fossil fuels for the BRICS countries had been increasing over the years, significantly so for China and India (IEA, 2016). According to Green Peace (2015), there had been a gradual decline in coal use in China since 2014 because of economic rebalancing, a war on air pollution and growth in renewable energy. After a decade of tremendous growth, coal use was down more than 4% in the first nine months of 2015. Coal imports decreased to 31% in the same period partly because of concerns about associated air pollution. China has commenced with exploring alternatives. In primary energy consumption, even though wind and solar energy were still small compared with coal, non-hydro renewables were at 1% of TPES in 2015 (IEA, 2016). Reuters indicated that, despite the Chinese governmental push to cap coal shipments levels to 2017 levels, there has been an increase in coal imports with imports 3.4% above 2017 (Reuters, 2019).
4.3 South Africa and OECD
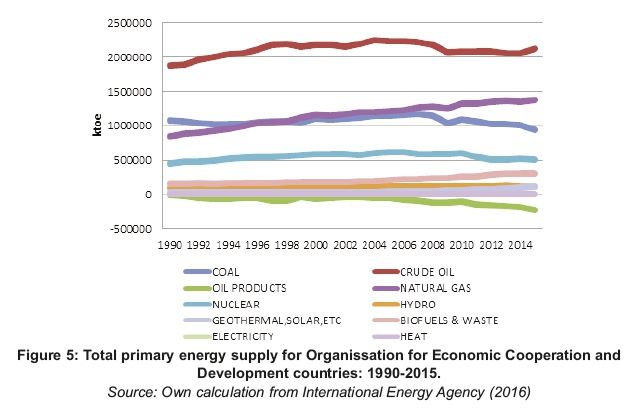
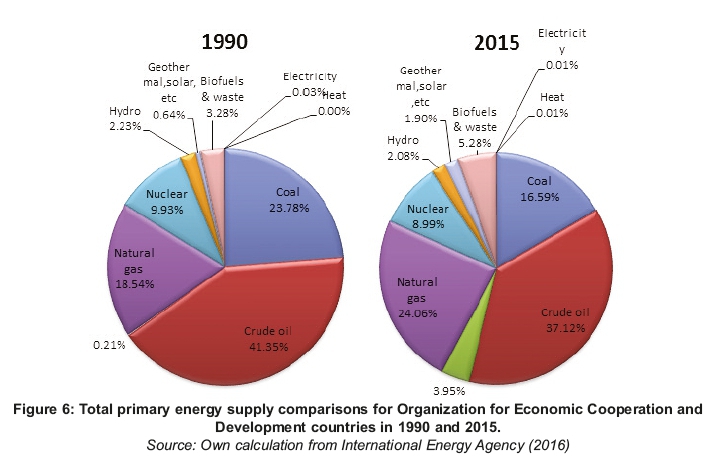
Since the 1970s oil shocks, OECD countries have broadened their energy supply, resulting in the fuel shares changes in TPES. Figures 5 and 6 show that, although crude oil remained the main component of TPES, its share decreased from 41.35% in 1990 to 37.12% in 2015. The reduction was compensated by an increased penetration of natural gas (from 18.54% to 24.06%). The OECD's share of global TPES decreased from 60% in 1971 to 39% in 2013, possibly because of the steady growth of energy demand from two of the BRICS countries, China and India.
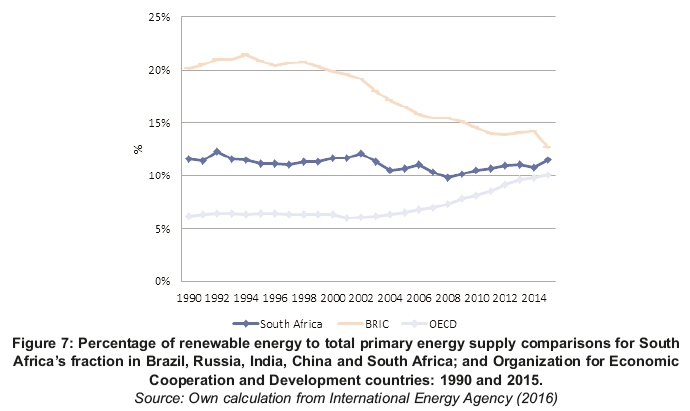
4.3 Renewable energy share to TPES
Renewable energy use increased in proportion to demand, as highlighted in Figure 7. Energy demand growth in first world OECD countries is slow, but quicker in some BRICS third world countries. The change from traditional cooking methods to the use of modern renewable energy reduces the renewable energy share.
In recent years, it has become evident that optimisation and diversificsation of a country's energy supply mix is fundamental to meeting its various developmental goals and enhancing the crucially important security of supply. The main aim of this study was to describe the current South African energy supply mix and to assess how South Africa fares in comparison to its BRIC and OECD counterparts. This was done by conducting a comparison study of the different regions' energy supply mixes. The analysis shows that the global TPES share for non-OECD countries, such as BRICS, is becoming more prominent, with China, India, and Russia being the main contributors. In addition, the OECD's share of global TPES has been decreasing.
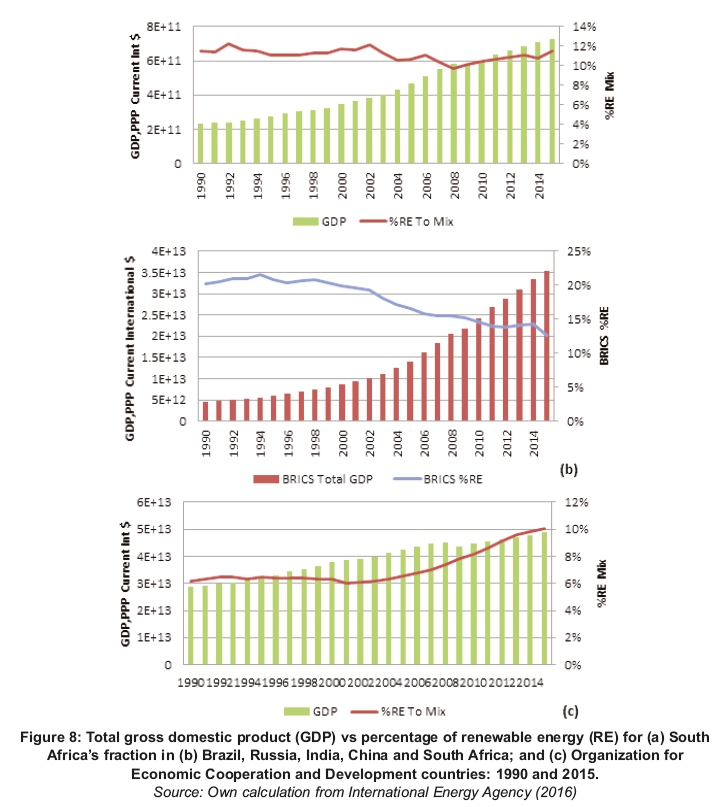
Overall, BRICS countries during the period 1990-2015 had a greater dependence on fossil fuels in their energy mix. Because of that, when commodity prices collapse, as they did after the last super-cycle, it is cheaper to switch back to coal and other traditional sources of energy instead of renew-ables, which tend to be more expensive to install but are cheaper over a lifetime of use (refer to Figure 8b). When economic activity comes down (because of the global economic recession), as it did in most BRICS countries, even China-other input costs come down or increase at a lower rate; all this supports a base energy programme that can push policy makers into lower investment mode. This can also be seen in Figure 8.
A green economy is supportive of highly industrialised countries in its net benefit/profit curve in the first investment cycle, which is approximately five years (CCICED, 2012). The OECD countries would tend to keep investing and supporting a green economy, even when the economic cycles do not provide short-term returns, as can be seen from Figure 8. Some of the BRICS countries are resource-rich, but technology-poor, so they tend to miss the key multiplier effect of any technology revolution such as the renewable energy one. Eventually, the super-convergence of these, inevitably, brings lower cost outcomes faster in the OECD than in BRICS economies.
In the deliberation about the advantages or otherwise of establishing a green economy, Brazil believes that there exists a compromise between economic development objectives and environmental aims; and that these compromises have far-reaching negative effects on the establishment of the Brazilian economy. As opposed to a few advanced and emerging countries' belief that the establishment of a green economy could result in economic advancement and suppression of scarcity, Brazil's stance is that a green economy would mostly benefit more advanced economies (Wentworth & Oji, 2013). This study also contended that developing countries are not competent in developing new technologies, as taking on the process would require the restructuring of the economy to cater for the new costs.
The BRICS' public policy has fundamentally been poised towards a more industrialist framework directed mainly at economic development. Governments of late are making more deliberate determinations to integrate societal development onto the growth plan. In so doing, partiality is directed at policy, which is geared at alleviating societal imbalances and scarcity. To realise this, Brazil's societal progression legislation is aligned with the public policy for total development. This has created conjoined policy goals. There is a lack of strategies to advocate for the promotion of greener economies. Some of the BRICS policymakers contend that a green economy can slow down the economic growth. Russia is advocating for the development of a green economy in partnership with other organisations such as the UN Economic Programme (UNEP 2012). Policy implementation in Russia is constrained, so implementation of the plans is slow and inconsistent (Wentworth & Oji, 2013). China has grown economically at the expense of the environment. A green economy can reduce a country's challenges, but the government should have an assurance that the growth is in accordance with its objectives. China's development plans are underpinned by relative competitiveness that focuses on internal growth. A green economy could obstruct their objectives, hence the need for China to dictate the terms of its engagement on the green economy (CCICED, 2012). A green economy can, however, offer advantages for environmental protection, while feeding into economic output requiring reassessment of projections for growth (Wentworth & Oji, 2013).
In South Africa, prior to 1994, information on renewable energy was mostly known by the government owing to apartheid and this had huge impacts on the sector (Sebitosi & Pillay, 2008) (Sebitosi & Pillay, 2008). South Africa is now working with other BRICS countries to develop its renewable energy. As the renewable energy sector is regarded as high risk, BRICS countries have relied on loans because of a lack of investors to fund this phenomenon. There are limited finance options in South Africa and Russia for such initiatives. Small and medium-sized enterprises cost from USD1-20 million, but they encounter the most challenges in funding as BRICS governments focus on bigger renewable projects. This results in slow development and discourages creativity (Zeng et al., 2017).
5. Conclusions
South Africa is currently on the correct trajectory in terms of its renewable energy policy implementation and increasing renewable projects growth. However, it would be more beneficial for South Africa to prioritise industrial development to gain momentum in moving towards being more of a developed nation where the uptake for renewable energy is higher such as in the (OECD) developed nations.
The South African TPES fuel share is dominated by fossil fuels, particularly coal and crude oil, and this has been increasing over the years. Similarly, its BRICS counterparts' TPES fuel share is also dominated by fossil fuels, mainly coal, crude oil, and natural gas, growing at a fast pace between 1990 and 2015. Fossil fuels are also the main contributor to the OECD countries' TPES, but there the share of the dominating fossil fuels decreasing between 1990 and 2015, with crude oil and coal decreasing from 41% to 37%, and 24% to 18% respectively. It is evident that there is a heavy reliance on fossil fuels in South Africa and other BRIC countries. Certainty in the implementation of current policies such as the IRP as well as less bureaucratic disablement is required to influence and guide the transition from the current fossil fuel-dominated energy supply mix to one that follows international trends, but most of all responds to its specific geographic position and availability of natural resources. Additional policy that details alternatives to the current fossil fuel biased supply as well as its structural implantation plan is required to enable a smooth and just transition.
Renewables are still not the preferred source of energy in South Africa and other BRICS countries. The development of a green economy and the increased usage of more renewable energy sources can help to address the challenges that the developing countries face, but seemingly the governments, aware of these strategic options, proceed cautiously, consistently weighing the impact of developing a green economy in the country's overall development objectives. The gap between policy aspirations and actual implementation is often huge in South Africa and some of the BRICS countries, due to the instability of the civil services, and discontinuity of policies compared to the more developed OECD countries.
Author roles
Vanessa Ndlovu (PhD student): data collection and write-up.
Roula Inglesi-Lotz: Supervision of research formulation and analytical techniques.
References
African Union. 2000. African Union. Retrieved from Constitutive Act of African Union: https://au.int/sites/default/files/pages/34873-file-constitutiveact_en.pdf. Accessed on 27 April 2019 [ Links ]
Allcott, H., Collard-Wexler, A., & O'Connell, S. 2016. How do electricity shortages affect industry? Evidence from India. American Economic Review 106(3): 587-624. [ Links ]
Amer, M., & Daim, T. U. 2011. Selection of renewable energy technologies for a developing country: A case of Pakistan. Energy for Sustainable Development, 15: 420-435. [ Links ]
Apergis, N., & Payne, J. E. 2010. Energy consumption and growth in South America: Evidence from a panel error correction model. Energy Economics, 32: 1421-1426. [ Links ]
Ateba, B., & Prinsloo, J. 2019. Strategic management for electricity supply sustainability in South Africa. Utilities Policy: 92-103. [ Links ]
Boden, T., Marland, G., & Andres, R. 2011. Global, regional, and national fossil-fuel co2 emissions. Oak Ridge, Tenn., U.S.A.: Carbon Dioxide Information Analysis Center Oak Ridge National Laboratory, U.S. Department of Energy. [ Links ]
Business Report. 2018, May 18. Business- Report: Energy. Retrieved from IOL: https://www.iol.co.za/business-report/energy/radebe-wants-revised-irp-seen-by-mid-august-14893890. Accessed 18 May 2018 [ Links ]
Carraro, C., Tavoni, M., Longden, T., & Marangoni, G. 2014. The optimal energy mix in power generation and the contribution from natural gas in reducing carbon emissionsto 2030 and beyond. Discussion Paper: Harvard Project on Climate Agreements, 2014-63. [ Links ]
China Council for International Cooperation on Environment and Development [CCICED]. 2012. Development Mechanism and Policy Innovation of China's Green Economy. Beijing: CCICED. [ Links ]
Collier, D. 1993. The comparative method. In political science: the state of discipline II. American Political science Association. [ Links ]
Craig, O., Brent, A., & Dinter, F 2017. Concentrated solar power (CSP) innovation analysis in South Africa. South African Journal of Industrial Engineering, 28(2): 14-27. [ Links ]
DEA [Department of Environmental Affairs]. 2010. National Climate Change Green Paper. Pretoria, South Africa: Department of Environmental Affairs. [ Links ]
DoE [Department of Energy]. 2011. Integrated Resource Plan for Electricity 2010-2030 Revision 2 Final Report. Pretoria, South Africa: Department of Energy. [ Links ]
DoE [Department of Energy]. 2015. Renewable Energy IPP Procurement Programme Bid Window 4 Preferred Bidders. Pretoria, South Africa: Department of Energy. [ Links ]
DoE [Department of Energy]. 2016. Integrated Resource Plan for Electricity 2010-2030 Revision 2 Draft Report. Pretoria, South Africa: Department of Energy. [ Links ]
DoE [Department of Energy]. 2016. South African coal sector report. Pretoria: Department of Energy. [ Links ]
DoE [Department of Energy]. 2018, April 4. Speech by the Minister of Energy, Hon Jeff Radebe, MP at the. Retrieved from Department of Energy: https://www.ipp-projects.co.za/ Accessed 4 April 2018. [ Links ]
Eskom. 2015. Integrated report 2015. Eskom. [ Links ]
Fluri, T. 2009. The potential of concentrating solar power in South Africa. Energy Policy, 37(12), 5075-5080. [ Links ]
Foster, E., Contestabile, M., Blazquez, J., Manzano, B., Workman, M., & Shah, N. 2017. The unstudied barriers to widespread renewable energy deployment: Fossil fuel price responses. Energy Policy, 258-264. [ Links ]
Gauche, P, Pfenninger, S., Meyer, A. J., Von Backstrom, T. W., & Brent, A. C. 2012. Modelling dispatch ability potential of CSP in South Africa. SASEC. [ Links ]
Gauche, P, Von Backstrom, T. W., & Brent, A. C. 2013. A Concentrating Solar Power value proposition for South Africa. Journal of Energy in Southern Africa, 24(1). [ Links ]
Government Gazette. 2006, July 5. Department of Energy. Retrieved from Department of Energy Policies: Electricity Regulation Act Number 4 of 2006: http://www.energy.gov.za/files/policies/ELECTRICITY%20REGULATIO N%20ACT%204%20OF%202006.pdf. Accessed 27 April 2019 [ Links ]
Green Peace. 2015. Laggards and leaders: the energy transition in BRICS countries. [ Links ]
IEA [International Energy Agency]. 2014. Africa Energy Outlook - A focus on energy prospects in Sub-Saharan Africa. Paris, France: International Energy Agency. [ Links ]
IEA [International Energy Agency. 2016. Key World Energy Trends: Excerpt from World Energy Balances. [ Links ]
Inglesi-Lotz, R. 2015. The impact of renewable energy consumption to economic growth: A panel data application. Energy Economics, 53, 58-63. [ Links ]
Kusakana, K., & Vermaak, H. J. 2013. Hydrokinetic power generation for rural electricity supply: Case of South Africa. Renewable Energy, 55, 467-473. [ Links ]
Lloyd, P (2012). Restructuring South Africa's electricity supply industry. [ Links ]
Montmasson-Clair, G., & Ryan, G. 2014. Repositioning electricity planning at the core: An evaluation of SouthAfrica's Integrated Resource Plan. Trade and Industrial Policy Strategies. [ Links ]
Musango, J. K. 2011. Sustainable electricity generation technologies in South Africa: Inititatives, challenges and policy implications. Energy and Environment Research, 1(1). [ Links ]
Nakumurayango, A., & Inglesi-Lotz, R. 2016. South Africa's performance on renewable energy and its relative position against the OECD countries and the rest of Africa. Renweable and Sustainable Energy Reviews, 56, 999-1007. [ Links ]
Pollet, B., Staffell, I., & Adamson, K.-A. 2015. Current energy landscape in the Republic of South Africa. International Journal of Hydrogen Energy, 40(46), 16685-16701. [ Links ]
Reuters. 2019, January 14. Reuters. Retrieved from Reuters: Asia: https://www.reuters.com/article/china-economy-trade-coal/update-1-chinas-2018-coal-imports-at-four-year-high-despite-curbs-idUSL3N1ZE1K1. Accessed 14 January 2019 [ Links ]
Sebitosi, A. B., & Pillay, P. 2008. Renewable energy and the environment in South Africa: A way forward. Energy Policy, 36, 3312-3316. [ Links ]
UNEP. 2012. [UN Economic Programme). Green Economy Advisory Services: Russian Federation, Paris, Kenya and Geneva: UNEP. [ Links ]
Vidal-Amaro, J. J., Ostergaard, P A., & Sheinbaum-Pardo, C. 2015. Optimal Energy mix for transitioning from fossil fuels to Renewable Energy Sources-the Mexican electricity system. Applied Energy, 150, 80-96. [ Links ]
Viebahn, P, Lechon, Y., & Trieb, F 2011. The potential role of concentrated solar power (CSP) in Africa and Europe - A dynamic assessment of technology development, cost development and life cycle inventories until 2050. . Energy Policy, 39(8), 4420-4430. [ Links ]
Wentworth, L., & Oji, C. 2013. The green economy and the BRICS countries: bringing them together. Economic Diplomacy Programme. [ Links ]
World Economic Forum. 2011. The global competitiveness report 2011-2012. WEF [ Links ]
Zeng, S., Liub, Y., Liua, C., & Nan, X. 2017. A review of renewable energy investment in the BRICS countries: History, models, problems and solutions. Renewable and Sustainable Energy Reviews, 860-872. [ Links ]
* Corresponding author: Tel.:+27 (0)11 629 5532; email: vanessacndlovu@gmail.com

