


Services on Demand
Article
 English (pdf)
 Article in xml format
 Article references
Indicators

Related links
-
 Cited by Google
 -
 Similars in Google
Share

 Permalink
Journal of Energy in Southern Africa
On-line version ISSN 2413-3051
Print version ISSN 1021-447X
J. energy South. Afr. vol.30 n.1 Cape Town 2019
http://dx.doi.org/10.17159/2413-3051/2019/v30i1a2473
ARTICLES
Reactive power and harmonic compensation: A case study for the coal-mining industry
F. RoosI; R.C. BansalII, *
IDepartment of Electrical, Electronics and Computer Engineering, University of Pretoria, Hatfield Campus, Pretoria 0028, South Africa
IIElectrical and Computer Engineering Department, University of Sharjah, Sharjah, P.O. Box 27272, United Arab Emirates
ABSTRACT
This study reports on a case study in Grootegeluk Mine: Exxaro Coal, Lephalale, South Africa, in terms of power factor correction (PFC), load flow, harmonic frequency scans and harmonic voltage distortion analyses. The DIgSilent PowerFactory software was used for network simulations. Harmonic and reactive power compensation techniques were compared in terms of filter type evolution and technology advancement, with the use of simple trade-off criteria such as cost-effectiveness versus performance. It was found that both passive and hybrid filters were more favourable and could effectively compensate all voltage and current harmonics and reactive power for large nonlinear loads. The installation of switched PFC filter banks tuned at the fifth harmonic order accommodates future network growth and this solution can be rolled out to any mining industry as a benchmark to lower energy cost and maximise savings achievable on the electricity bill.
Keywords: electrical energy, passive filter, reactive power compensation, total harmonic distortion
1. Introduction
All areas of industry need to cut production expenses because of tough economic conditions. Lowering the cost of energy by means of power quality improvement is crucial to assist in business sustainability. Presently power quality is dirty and compromised because of harmonic producing inductive loads [1-3]. Harmonic propagation is caused by an increase in the use of variable speed drives amongst other power electronics in industry, driven by energy saving initiatives [4]. Nonlinear loads typically have low input power factors (PFs), while sourcing substantial harmonic currents, which create severe issues at the power supply system [1]. Passive filters, i.e., resonant circuit (LC) filters, have been used traditionally to get rid of current harmonics of the reticulation network. System PF was improved by using capacitors to compensate inductive alternating current loads. A major drawback found in using this type of filter is that it suffers from resonance [1-3], Reactive power and harmonic compensation have been realised by means of thyristor-switched filters (TSFs) containing numerous passive filter collections installed in the networks [2]. The amount of TSF's compensation is adjusted in accordance with load power fluctuations [3]. A drawback found in using this type of filter is that resonance could also occur between impedance of the grid and the TSF. The problems related to resonance highlighted in passive filters have been mitigated in the development of active filters to bring about more dynamic and adjustable solutions by making use of power electronics [4-6]. Active filters have shown better performance and effectiveness in harmonic compensation [7, 8], High cost for active filters is a drawback in terms of economic viability and high-power converter ratings are also required [9]. Hybrid filters effectively mitigate the problems and drawbacks of pure passive filter and/or pure active filter solutions. Hybrid filters provide cost-effective harmonic compensation, specifically for high power nonlinear loads, [10-13], Numerous hybrid filter topology variations have been reported in the literature [14, 15]. One of the most popular methods identified is a combination of a shunt hybrid power filter (SHPF) and a thyristor-controlled reactor (TCR). This SHPF-TCR hybrid PF corrector effectively eliminates the current harmonics and compensates the reactive power sourced from the load [1, 2]. However, both passive and hybrid technologies are feasible and economically viable solutions.
In this study, various PFC methodologies suitable for the specific plant environment at Grootegeluk Mine: Exxaro Coal were investigated. A technical solution was proposed to maximise savings achievable on the Eskom (national power utility) electricity bill. The objective was to effectively eliminate the harmonics and compensate reactive power subject to
various constraints. The resulting PF and % total harmonic distortion (THD) had to be within the prescribed limits [8]. This research focused on finding the most optimal reactive power compensation strategy for the typical harsh mining environments governed by the Mine Health and Safety Act. A compensation strategy would be designed (a trade-off based on voltage, harmonic effects, type of filter and control philosophy), which would incorporate the design criteria related to mining operations. The overall PF was anticipated to improve to above 0.96 and the % THD to be within acceptable limits, which was of prime importance to lower the energy costs and prevent equipment damage, respectively. The proposed technical solution would maximise the electricity savings.
2. Background overview
2.1 Definition of power factor and total harmonic distortion
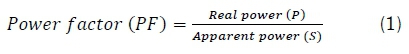
The PF provides a measure of the effective utilisation of real power (P) in the network. It also denotes the relation between the line voltage and line current and corresponding phase angle between them [16], The PF is defined in literature as Equation 1 [17, 18].
Equation (1) then takes the form of Equation 2
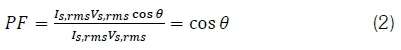
where IS;rms and VS;mis are root mean square (rms) values of line current and line voltage, respectively and θ is phase angle between the respective phase current and phase voltage.
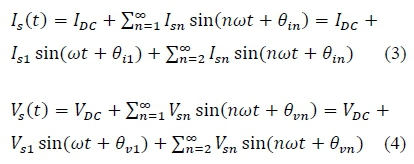
The θ is valid only for linear systems. In a system where electronic equipment is installed like active power switching devices, a non-linear behaviour will be experienced, therefore, rendering Equation 2 invalid [16]. Line voltage and line current become distorted because of the nonlinear load. Equations 3 and 4 give the Fourier expansion representations for the line current and line voltage, respectively [1618].
Using Equation 1 as reference, PF can now be expressed as in Equation 5.
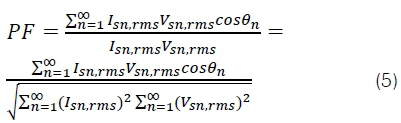
where VSn,m,s and lsn,m,sare rms values of the ηth harmonic voltage and line current, respectively and 0n is the phase angle between the respective phase current and phase voltage.
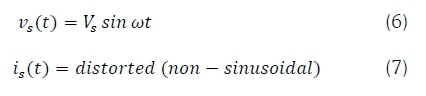
By assuming that distortion is restricted to t and that line voltage is pure sinusoidal, Equations 6-9 can be valid.
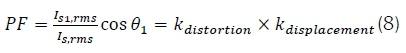
The PF can now be expressed as in Equation 8.
The THDi (THD with respect to current) is defined by Equation 9.
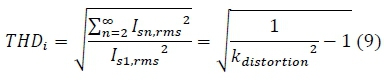
As seen from Equations 8 and 9, PF and THD are related to distortion and displacement factors. An improvement in PF may, consequently, lead to reduction in harmonic content within the network.
2.2 Capacitor voltage support
Applying shunt capacitors to a system results in a voltage rise caused by the flow of capacitor current (or the reduction of inductive current) through the inductive reactance of the system from the point of installation back to the generation. The voltage rise at the capacitor location is approximately equal to the capacitor current Ic times the inductive reactance Xl of the system. There is a voltage rise all the way back to the voltage source, the magnitude depending on the inductive reactance between the source and the location. In a radial system, there is also an increase in the voltage beyond the capacitor location resulting from the increase at the capacitor location. The voltage rise that capacitors will produce based on the Ic and the Xl of the system to the capacitor location is given by Equation 10.

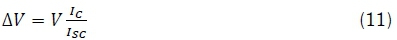
For systems with a reasonably high X/R ratio, where the short-circuit impedance to the capacitor
location is about the same as the inductive reactance, Xl in Equation 10 is the impedance that determines the system short-circuit current available at the capacitor location. This short-circuit current is useful in estimating the voltage rise. A commonly used estimate is given by Equation 11.
2.3 Increased system capacity
Increased system capacity may justify the addition of shunt power capacitors on a distribution system. This is particularly significant when loads supplied by the system are increasing rapidly. The addition of shunt power capacitors reduces the volt-ampere (VA) loading on the system, thereby releasing capacity that can then be used to supply future load increases. The power factor required to release the desired amount of system kVA can be determined by Equation 12.

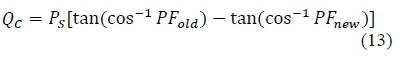
To calculate the capacitive kVAr (kilo volt Ampere reactive) necessary to correct to a new, higher power factor, the inductive kVAr of the new (corrected) power factor is subtracted from the old (existing) power factor. The difference is the amount of capacitive kVAr to be added to the system. Equation 13 is a convenient way of doing this.
2.4 Size and number of capacitor banks
The shunt capacitance requirements are determined for a power system by modelling the system for various contingencies and determining the capacitors required to maintain acceptable system voltage. The maximum capacitor bank size is influenced by:
• change in system voltage upon capacitor bank switching; and
• switchgear continuous current limitations When a capacitor bank is energised or de-energised, the fundamental system voltage increases or decreases, respectively. This voltage change is often limited to a value in the range of 2 - 3% to have a minimal effect upon customer loads. This voltage change (ΔV) can be estimated by Equation 14.
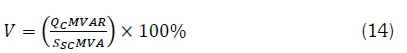
where V is the voltage change as a percentage of the fundamental frequency rms system voltage; QCMVAR is the mega volt-ampere reactive (MVAR) size of the capacitor bank; and SSCMVA is the available three-phase short-circuit mega volt-ampere (MVA).
2.5 Switching transients during energisation
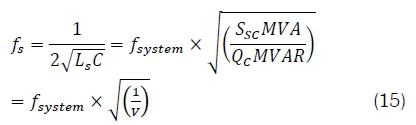
When a capacitor bank is energised or de-energised, current and voltage transients are produced, affecting both the capacitor bank and the connected system. Transient frequencies caused by isolated capacitor bank switching generally fall in the range of 300-1000 Hz. The characteristic frequency is related to the steady-state voltage rise (ΔV) using Equation 15.
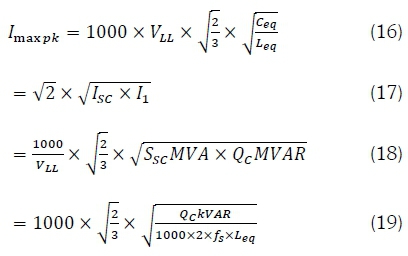
Capacitor switches must be capable of repeatedly withstanding inrush current, which, for an isolated capacitor bank, is as given by Equations 16-19.
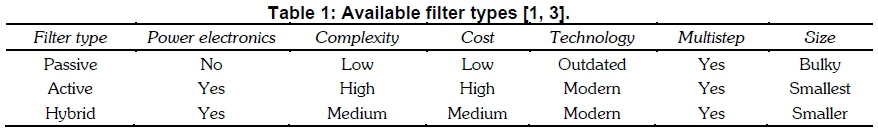
2.6 Evaluation of approaches in terms of filter types
Table 1 shows the high-level differences in terms of power electronics, complexity, cost, technology, steps and size between passive, active, and hybrid filters. In this study, passive filters are selected as the most viable option because of financial constraints, however the specified solution makes use of a multistep configuration thereby benefitting from similar technology improvements as with active and hybrid filters.
2.7 Problem formulation
In recent years, increasing attention has been paid to minimise the energy cost and inefficiency in electricity distribution system. One of the methods to minimise energy cost is to incorporate PFC in the reticulation network. Harmonics cause the following unwanted symptoms in the power system networks [16, 19-21]:
• high levels of reactive power;
• high neutral current;
• low PF;
• voltage distortion; and
• low energy efficiency.
Harmonic filters can suppress harmonic distortion in any reticulation network [22-25]. A compensator needs to be specified for fluctuating modular plant loading conditions, which is then capable of maintaining the harmonic distortion levels well within the prescribed limits [26-29]. An economical solution is required in which the capital investment cost related to PFC is recoverable in short time because of lower procurement cost of reactive power [27, 30]. The present study was based on the following main objectives [31-34]:
• to mitigate poor PF caused by inductive loads such that a near unity PF is measured on the supply distribution side;
• to control and limit the propagation of harmonics in the broader network in accordance with prescribed THD criteria to such an extent that near sinusoidal source currents are measured at the distribution level; and
• to free up capacity in terms of apparent power available upstream from the installed capacitor location.
3. Load flow analysis on Grootegeluk Mine
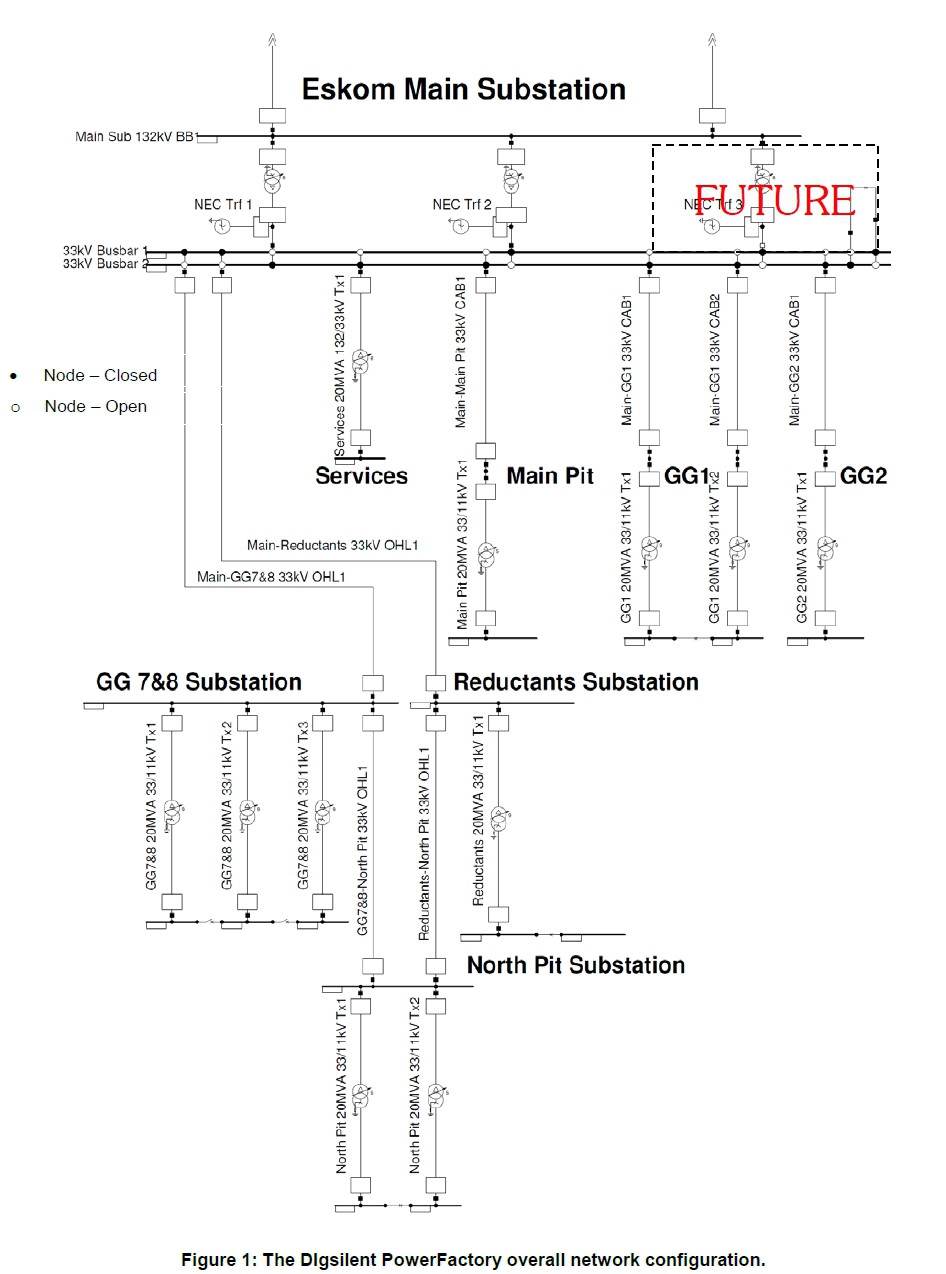
3.1 Network configuration
Figure 1 illustrates the DIgSilent PowerFactory overall network configuration. At the time of this study, two 132/33 kV, 80 MVA transformers were in service, with a third transformer planned to be commissioned in 2017. These transformers are connected to a 33 kV main substation double busbar arrangement consisting of 33 kV main and reserve busbars that are normally operated in a split configuration. Transformer 2 is connected to the 33 kV reserve busbar that supplies the 'new' plant consisting of reduct-ants, north pit and Grootegeluk (GG) 7 and 8 substation ring networks. Once transformer 3 is commissioned it will also be connected to the 33 kV reserve busbar. Transformer 1 is connected to the 33 kV main busbar that supplies the Old' plant consisting of GG1, GG2 and main pit substations.
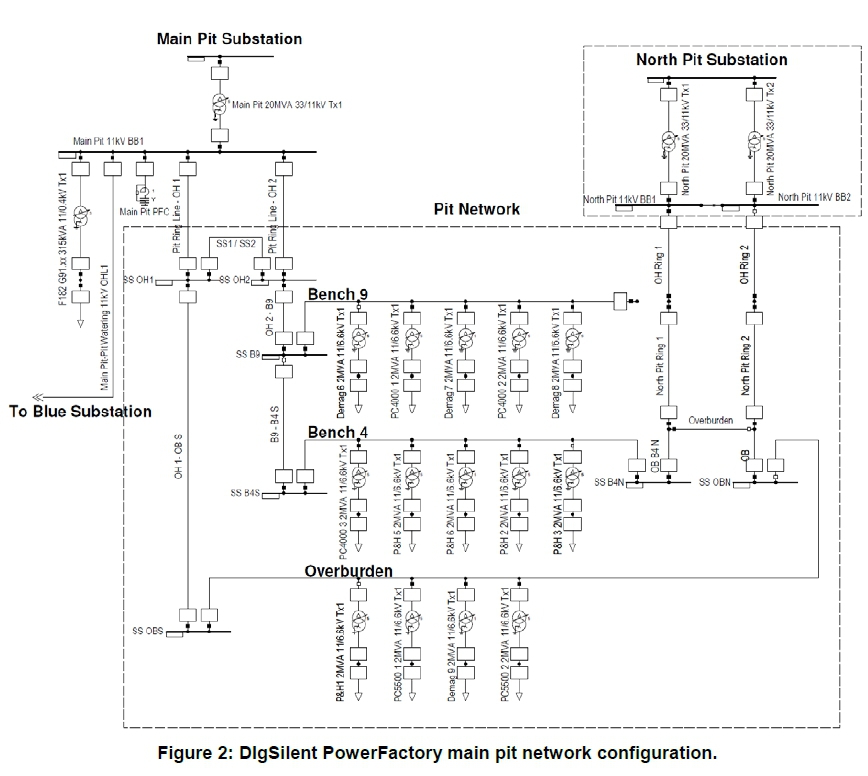
Figure 2 illustrates the DIgSilent PowerFactory main pit network configuration. The main pit network is supplied by both the 33/11 kV main pit substation and the 33/11 kV north pit substation that enable 80 MVA transformers at the 132/33 kV main substation to be operated in an open or closed configuration. The existing 11 kV PFC banks at main pit, GG1 and GG2 are as follows:
• GG1 and GG2: two 8 MVAR PFC single filters tuned at 4.7 pu (per unit), utilising air core reactors; and
• main pit: 6 MVAR PFC damped C type filter utilizing air cored reactors, tuned at 4.7 pu.
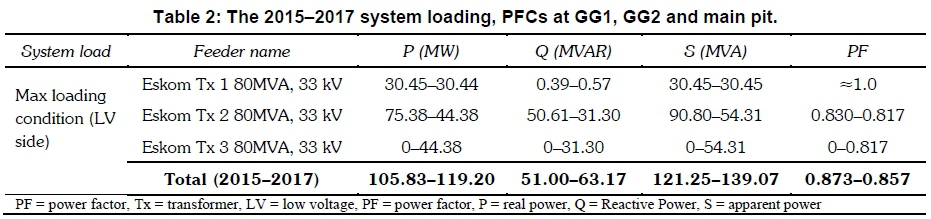
3.2 Existing and future system load
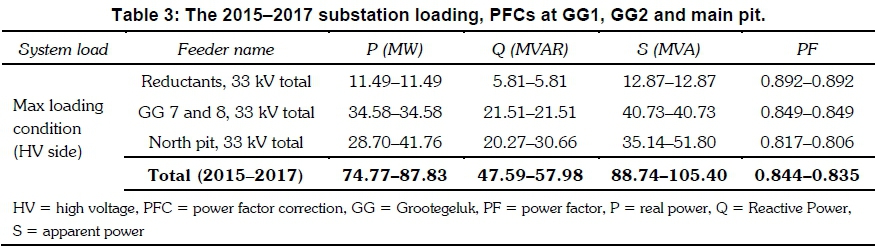
Table 2 presents the 2015 - 2017 total system load on two transformers at the 132/33 kV main substation. Table 3 presents the 2015 substation load breakdown within the network model that will be considered for the switched PFC filter bank designs at north pit, GG 7 and 8 and reductants 33/11 kV substations. It is evident that the total load value of 88.74 MVA from Table 3 is supplied from transformer 2. Network losses are responsible for the reduction in the total load from 90.80 MVA to 88.74 MVA. The loading on transformer 2 of 90.80 MVA exceeds its rated capacity of 80 MVA. Table 2 also presents the 2017 total system on three transformers at the 132/33 kV main substation. Table 3 also shows the 2017 substation load breakdown within the network model that will be considered for the switched PFC filter bank designs at north pit, GG 7 and 8 and reductants 33/11 kV substations. The introduction of transformer 3 connected to the reserve busbar alleviates the overloading conditions on transformer 2, because the respective transformers are sharing the load to the north pit and GG 7 and 8 and reductants 33/11 kV substations.
Some additional loads not represented in Tables 2 and 3 can be divided into two main areas as follows.
• Grootegeluk expansion plan: The pit area will expand to the West with additional load added to north pit and main pit substations in 2017 and 2021; and
• Thabametsi Coal Plant: An additional +/-20 MVA temporary construction load for the planned Thabametsi Coal plant. This additional load is planned to be supplied from the existing 33 kV reductants, north pit and GG 7 and 8-ring networks.
This additional load is planned to be phased into the existing system load within the next six years. These additional loads that do not form part of the loading populated within the DIgSilent PowerFactory model and were excluded from the assessment and do not form part of the detailed planning of the proposed switched PFC filter banks on 11 kV at north pit, GG 7 and 8 and reductants substations. The additional load will, however, influence the overall power factor correction on 33 kV and additional PFC may be required.
3.3 Power factor correction bank sizes and system improvements
The sizing of the switched PFC Filter Banks makes provision for future network expansion and ramp loading to ensure that the PFC is effective for a wide range of plant loading. The results of the different loading conditions are shown in Table 3. The PFC requirements to ensure a PF of at least 0.97 at the 33 kV north pit, GG 7 and 8 and reductants substations are shown in Table 4 requiring the installation of a 2.94 MVAR bank at 11 kV reductants, a 12.85 MVAR bank at 11 kV GG 7 and 8, as well as a 13.08 MVAR (2015 loading) - 20.20 MVAR (2017 loading) bank at 11 kV north pit. To ensure uniform PFC equipment throughout the system for ease of construction and maintenance, the switched PFC banks are proposed with 1.5 MVAR step increments at specific substations as shown in Table 4. Note that the total 33 kV PFC specified of 31.50 MVAR is higher than calculated requirement because of 20 MVA, 33/11 kV distribution transformer magnetisation effects.
Based on the network simulations, the maximum 2015 power consumption for this study at reductants substation is 11.49 + j5.81 MVA, a 4.5 MVAR switched PFC filter bank is proposed to ensure a PF of 0.994 at maximum substation loading. The proposed bank consists of two stages, 1 χ 1.5 MVAR and 1 χ 3.0 MVAR to be installed on busbar 1 and 2 respectively. Similarly, based on the 2015 power consumption at the GG 7 and 8 substation of 34.58 + J21.51 MVA, a 10.5 MVAR switched PFC filter bank is proposed to ensure a power factor of 0.956 at maximum substation loading. The proposed bank consists of three stages, 1 χ 1.5 MVAR, 1 χ 3.0 MVAR and 1 χ 6.0 MVAR to be installed on busbar 1, 2 and 3 respectively.
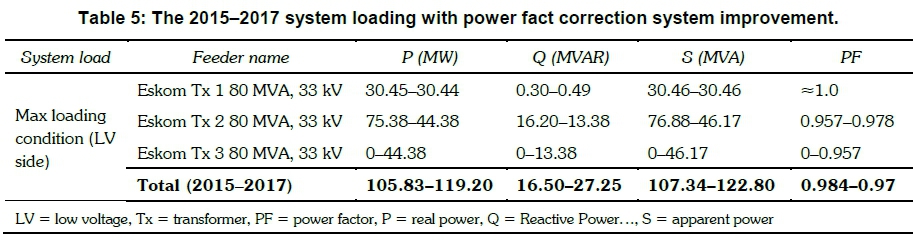
The 2015 power consumption at the north pit substation is 28.70 + J20.27 MVA and its 2017 power consumption is 41.76 + j30.66 MVA. A 16.5 MVAR switched PFC filter bank (strategically selected as a value between the 2015 and 2017 loading condition) is proposed to ensure a PF of 0.992 at 2015 maximum substation loading. The proposed bank consists of four stages; a 1 χ 1.5 MVAR and a 1 χ 6.0 MVAR to be installed on busbar 1, and 1 χ 3.0 MVAR and 1 χ 6.0 MVAR to be installed on busbar 2. Table 5 summarises the results from the network assessment with the 2015 and 2017 maximum power consumption at main 132/33 kV substation with the installation of proposed switched PFC filter banks.
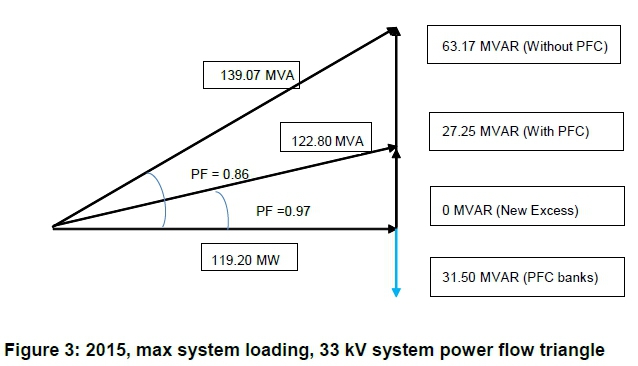
The proposed banks will ensure an overall PF of 0.97 for both the 2015 and 2017 maximum power consumption and will decrease the system power requirement from 119.20 + J63.17 MVA to 118.84 + J27.25 MVA.
3.4 The MVA power reduction with PFC
Figure 3 shows the power triangle of the 33 kV system, based on the combined power flow from the 33 kV main intake substation to the 33 kV GG 7 and 8 networks with 16.5 MVAR, 10.5 MVAR, and 4.5 MVAR switched PFC banks installed at the 11 kV north pit, GG 7 and 8, and reductants substations respectively. Note the improvement in power factor, as well as the reduction in apparent power with switched PFC banks installed.
4. Harmonic analysis
Harmonic analysis consists of both harmonic frequency scans and harmonic voltage distortion analysis. Harmonic frequency scans would show harmonic impedance peaks relative to harmonic order. Areas of concern exist where these peaks are above the threshold of 2.5 χ linear impedance and would be further investigated in terms of harmonic voltage distortion. Harmonic voltage distortion analysis provides information used to determine the required harmonic filtering to comply with NRS048-2 (National energy regulator power quality standard). For the purposes of this study, only the results of 11 kV north pit substation are presented.
4.1 Harmonic frequency scan
The DIgSilent PowerFactory model was used to simulate the 11 kV harmonic impedances, which is presented in this paper. The following harmonic frequency labelling, as indicated in the frequency scan charts and tables, was used:
• Existing network: The 11 kV network harmonic impedance with the existing 11 kV harmonic filter banks at Main Pit, GG1 and GG2 in service. The existing harmonic filters consist of:
ο GG1 and GG2: Two 8 MVAR PFC single filters tuned at 4.7 pu, utilising air core reactors; and
ο Main pit: Six MVAR PFC damped C-type filter, utilising air cored reactors tuned at 4.7 pu.
• Plain PFC banks: The 11 kV network harmonic impedance with the existing 11 kV harmonic filter banks in service at the Main Pit, GG1 and GG2 and with plain PFC switched banks at the 11 kV GG 7 and 8 (10.5 MVAR), North Pit (16.5 MVAR) and Reductants (4.5 MVAR) substations, respectively.
• PFC filter banks 4.7 tuned: The 11 kV network harmonic impedance with the existing 11 kV harmonic filter banks in service at the main pit, GG1 and GG2 and with fifth harmonic filter switched banks at the 11 kV GG7 and 8 (10.5 MVAR), north pit (16.5 MVAR) and reductants (4.5 MVAR) substations, respectively.
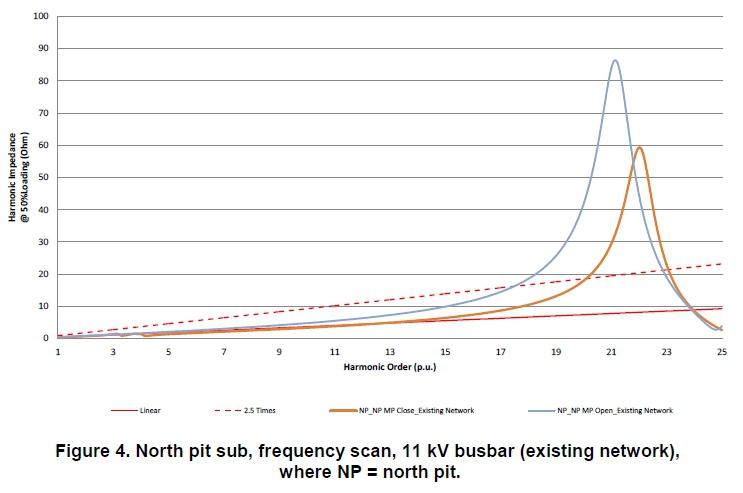
The frequency scans were performed at 50% loading to represent the load damping effect at the parallel resonant peaks. The simulated harmonic impedances more than the 2.5 χ linear impedance were flagged. These harmonic impedances and harmonic voltage distortions were further investigated in Section 4.2. In Figures 4 and 9 and Table 6, 'Base' represents the frequency scans with the 11 kV power system configured with the 11 kV feeders that connect the main pit and north pit substations operating N/O at the main pit substation. The pit area is supplied from the north pit substation. In the graphs that follow, the solid line represents the linear impedance calculated by Equation 20.

where Z50Hzrepresents the system impedance at 50 Hz, as calculated from the symmetrical short-circuit level.
Furthermore, the vertical axis on all the graphs that follow represents the harmonic impedance at 50% loading and the horizontal axis on all the graphs represents the harmonic order. The upper harmonic impedance threshold is defined as the 2.5 χ linear impedance. The 11 kV network and PFC configurations that result in parallel resonant peaks above the upper harmonic threshold can result in voltage harmonic distortions above the NRS048 harmonic distortion planning levels and must be investigated in detail. A high linear impedance Z(n) can result in individual voltage harmonic distortions Vn, according to Ohm's law in Equation 21.

If the voltage harmonic is above the NRS048 planning levels, harmonic filtering or different types or combinations of harmonic filters should be considered. The voltage harmonic distortions associated with the frequency scans are evaluated in Section 4.2. Figure 4 shows the results of a frequency scan performed on the 11 kV north pit busbar 1 with the existing 11 kV PFC banks in service at main pit, GG1 and GG2. The results indicate dominant parallel resonant peaks around the twenty-first and twenty-third harmonic orders, well above the 2.5 χ linear impedance. Although the twenty-second harmonic impedance is high, it is not a concern, as it does not coincide with the characteristic harmonics.
Figure 5 shows the result of a frequency scan performed on the 11 kV north pit busbar 1 with the existing 11 kV PFC banks in service at main pit, GG1 and GG2 and with 16.5 MVAR, 10.5 MVAR and 4.5 MVAR switched plain PFC banks installed in the 11 kV north pit, GG7 and 8 and reductants substations, respectively. Additionally, the graph indicates the change in harmonic impedance as the step-size of the 16.5 MVAR plain-PFC bank at the north pit substation is varied.
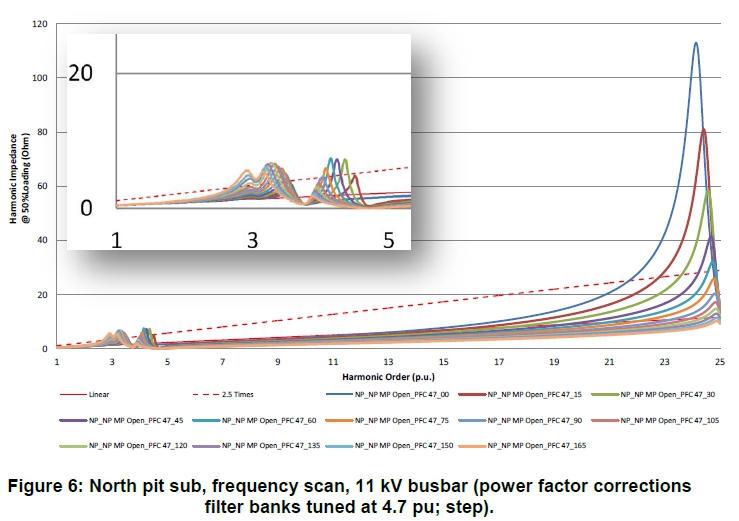
Figure 5 also indicates that, for each PFC configuration, two parallel resonant peaks exist per configuration. One peak is characterised as a severe parallel resonant peak of high harmonic order well above the 2.5 χ linear impedance. The other peak is a less severe peak of a lower harmonic order, centred near the fourth harmonic order. From the graph, it can also be noted that, as the size of the 16.5 MVAR plain PFC bank at the north pit substation increases (due to step variation), the severe peaks shift in order from the fifteenth to the seventh and the impedance magnitude decreases. However, there is a tight grouping of peaks near the fourth harmonic order that stays relatively constant in both order and magnitude as the PFC step size is varied. Figure 6 shows the result of a frequency scan performed on the 11 kV north pit busbar 1 with the existing 11 kV PFC banks in service at main pit, GG1 and GG2 and with 16.5 MVAR, 10.5 MVAR and 4.5 MVAR switched PFC banks (tuned with fifth harmonic LC filters) installed in the 11 kV north pit, GG7 and 8 and reductants substations, respectively. Additionally, the graph indicates the change in harmonic impedance as the step size of the 16.5 MVAR plain PFC bank at the north pit substation is varied.
Figure 6 also indicates the change in the harmonic impedance response with the fifth harmonic LC filters in service. The severe parallel resonant peaks that are well above the 2.5 χ linear impedance line are still present and have shifted from the fifteenth harmonic order to the twenty-fourth harmonic order. The less severe peaks that were present at the fifth harmonic order have been eliminated by the LC filters with peaks still present at the third harmonic order. A parallel resonant peak at the twenty-first harmonic order is present in the existing network. With a plain switched filter bank, there is a parallel resonant peak with a smaller magnitude at the fifth and seventh harmonic orders. For the switched PFC devices, harmonics from the fifth order to the twenty-third order are eliminated by the installation of the PFC tuned with fifth harmonic LC filters. There are still third order harmonics present on these networks that are above the 2.5 χ linear impedance and their effects on the harmonic voltage distortion are assessed in Section 4.2.
4.2 Harmonic voltage distortion
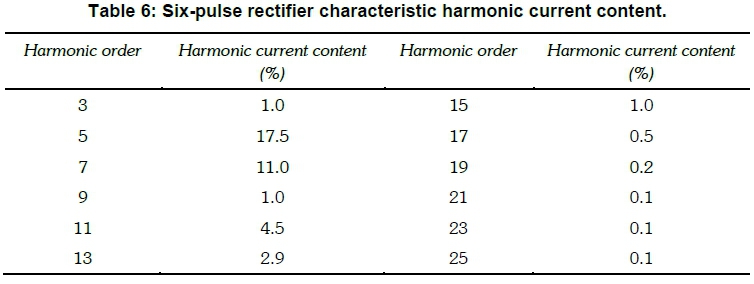
The harmonic voltage distortion within the 33/11 kV power system was simulated based on the assumption that 15% of the connected load base will be nonlinear to simulate the unknown harmonic current content of the future plant. This was achieved by inserting characteristic six-pulse rectifier harmonic lumped loads onto the 11 kV north pit busbars, while scaling the normal loads to 35% of the 2017 loading values. The harmonic distortion was chosen to simulate a voltage THD of approximately 4.2% on the existing 11 kV north pit busbar with no PFC installed. The lumped loads have a harmonic current content at specific harmonic orders, as shown in Table 6.
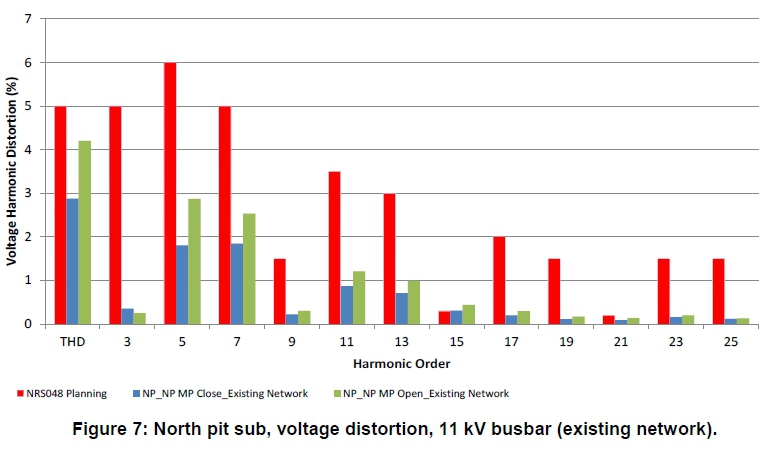
Figure 7 evaluates the expected voltage harmonic distortion due to the high twenty-first harmonic impedance, as shown in Figure 4. It also shows the result of a harmonic load flow performed on the 11 kV north pit busbar 1 with the existing 11 kV PFC banks in service at main pit, GG1 and GG2.
Figure 7 shows that, with only the existing PFC devices in service at the GG1, GG2 and main pit substations, the 11 kV voltage harmonic content of the fifteenth harmonic at the north pit substation is above the NRS048-4 planning criteria (acceptable distortion levels).
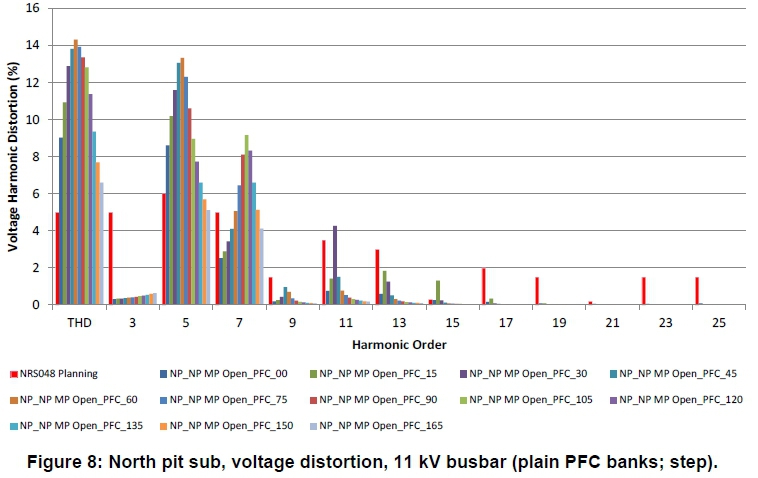
Figure 8 evaluates the expected voltage harmonic distortion in accordance to the harmonic frequency scan shown in Figure 5. It also shows the result of a harmonic voltage distortion analysis performed on the 11 kV north pit busbar 1 with the existing 11 kV PFC banks in service at main pit, GG1 and GG2 and with 16.5 MVAR, 10.5 MVAR and 4.5 MVAR switched plain PFC banks installed in the 11 kV north pit, GG7 and 8 and reductants substations, respectively. Further, it indicates the change in harmonic voltage distortion during the switching contingencies of the 16.5 MVAR plain PFC bank at the north pit substation.
In Figure 8 with the existing PFC in service on 11 kV GG1, GG2 and main pit as well as the plain PFC at the GG7 and 8 networks, the fifth and seventh voltage harmonics are well above the NRS048 levels. The THD is also well above the NRS048 compatibility levels for the 11 kV and 33 kV busbars. The high fifth and seventh impacting the THD values, when using a plain PFC bank, are a concern. With the fifth harmonic current dominant in most parts of the plant, it is recommended that a harmonic filter solution, tuned close to the fifth harmonic should be implemented. Figure 9 evaluates the expected voltage harmonic distortion in accordance to the harmonic frequency scan shown in Figure 6. In Figure 9 the introduction of fifth harmonic filters on the 11 kV north pit, GG7 and 8 and reductants substations (existing PFC simulated on GG1, GG2 and main pit) dramatically reduces the voltage harmonic content on both the 11 kV and 33 kV networks.
The voltage harmonic content at the north pit substation is now well within the NRS048 planning limits. The fifth harmonic LC filters are therefore effective, reducing the voltage harmonic distortion levels to below the NRS048 planning limits, and will prevent negative impacts on the utility voltage. The reduction in the individual voltage harmonics is clearly visible when compared to the scenarios where plain PFC were installed on the 11 kV network shown in Figure 8.
The voltage harmonic content at the north pit substation is now well within the NRS048 planning limits. The fifth harmonic LC filters are therefore effective, reducing the voltage harmonic distortion levels to below the NRS048 planning limits, and will prevent negative impacts on the utility voltage. The reduction in the individual voltage harmonics is clearly visible when compared to the scenarios where plain PFC were installed on the 11 kV network shown in Figure 8.
4.3 Results and discussion
Based on the load flow results obtained from the provided DIgSilent PowerFactory model, a total reactive power requirement for switched PFC banks of 31.5 MVAR was identified to ensure a 0.97 lagging PF for the 2017 system load of 119.21 + J63.17 MVA. The sizing of the switched PFC filter banks makes provision for future network expansions and ramp loading to ensure that the PFC is effective for a wide range of plant loading. It is proposed that the switched PFC filter banks tuned with 4.7 harmonic LC filters should be installed as follows:
• At the north pit substation, a 16.5 MVAR switched PFC filter bank is proposed to ensure a PF of 0.992 at the maximum substation loading. The proposed bank consists of four stages: 1x1.5 MVAR and 1 χ 6.0 MVAR to be installed on busbar 1 and 1 χ 3.0 MVAR and 1 χ 6.0 MVAR to be installed on busbar 2.
• At the GG7 and 8 substations, a 10.5 MVAR switched PFC filter bank is proposed to ensure a PF of 0.956 at the maximum substation loading. The proposed bank consists of three stages:
1x1.5 MVAR, 1x3.0 MVAR and 1 χ 6.0 MVAR to be installed on busbars 1, 2 and 3, respectively.
• At the reductants substation, a 4.5 MVAR switched PFC filter bank is proposed to ensure a PF of 0.994 at the maximum substation loading. The proposed bank consists of two stages: 1x1.5 MVAR and 1 χ 3.0 MVAR to be installed on busbars 1 and 2, respectively.
5. Conclusions
This research consisted of a study of power factor correction (PFC), load requirements, load flow, fault analyses, harmonic frequency scans and harmonic voltage distortion analyses. The DIgSilent Power-Factory was used to carry out investigations.
The introduction of plain PFCs on the substations resulted in severe parallel resonant peaks that were well above the 2.5 χ linear impedance guideline and thus resulted in very high voltage harmonic distortions more than the NRS048-2 compatibility levels. However, the installation of switched PFC filter banks tuned with fifth harmonic order resulted in a viable solution. The introduction of the switched PFC banks tuned with fifth order resonant circuit harmonic filters decreased the harmonic impedance peaks, consequently reducing the harmonic voltage distortion effects below the NRS048-2 compatibility levels. Therefore, switched PFC filter banks tuned with fifth harmonic order are the preferred solution. The installation of switched PFC filter banks tuned at the fifth harmonic order resulted in a viable solution with no harmonic voltage distortion violations present in the system. The systems overall power factor was improved to above 0.96 thereby lowering energy cost, hence the proposed solution will maximise savings achievable on the ESKOM electricity bill. Future work to further investigation includes the following.
• A proper economic evaluation should be completed with the aim of confirming the most economical solution in which the capital investment cost related to PFC is recoverable in the short term because of the lower procurement costs of reactive power.
• A detailed equipment schedule aligned and tailored for harsh coal mining environments is needed.
• A PFC design report needs to be compiled and should include all the input data, specify the design parameters, provide single line diagram of the compensator required and specify the equipment ratings.
References
[1] Acha, E., Agelidis, V., Anaya, O., and Miller, T. J. E. 2002. Power electronic control in electric systems. Oxford: Newness Power Engineering series. [ Links ]
[2] Akagi, H., Watanabe, E. H., and Aredes, M. 2007. Instantaneous power theory and applications to power conditioning. New Jersey, USA: John Wiley & Sons. [ Links ]
[3] Fuchs, Ε. F., and Mausoum, M. A. S. 2008. Power quality in power systems and electrical machines. London, UK: Int. Journal of Academic Press. [ Links ]
[4] Obulesu, Y. P., Reddy, M. V., and Kusumalatha, Y. 2014. A %THD analysis of industrial power distribution systems with active power filter case studies. Int. Journal of Electrical Power and Energy Systems, 60, 107-120. [ Links ]
[5] Rahmani, S., Hamadi, Α., Al-Haddad, K., and Dessaint, L. A. 2014. A combination of shunt hybrid power filter and thyristor-controlled reactor for power quality. IEEE Trans. Ind. Electron., 61 (5), 2152-2164. [ Links ]
[6] Hu, H., Shi, W., Lu, Y. and Xing, Y. 2012. Design considerations for DSP-controlled 400 Hz shunt active power filter in an aircraft power system. IEEE Trans. Ind. Electron., 59 (9), 3624-3634. [ Links ]
[7] Du, X., Zhou, L., Lu, H., and Tai, H. M. 2012. DC link active power filter for three-phase diode rectifier. IEEE Trans. Ind. Electron., 59 (3), 1430-1442. [ Links ]
[8] Gupta, N., Singh, S. P., and Bansal, R.C. 2012. A digital signal processor-based performance evaluation of three-phase four-wire shunt active filter for harmonic elimination, reactive power compensation, and balancing of non-linear loads under non- ideal mains voltages. Electric Power Components and Systems, 40 (10), 1119-1148. [ Links ]
[9] Angulo, M., Ruiz-Caballero, D.A., Lago, J., Heldwein, M. L., and Mussa, S. Α. 2013. Active power filter control strategy with implicit closed loop current control and resonant controller. IEEE Trans. Ind. Electron., 60 (7), 2721-2730. [ Links ]
[10] Singh, B., Chandra, Α., and Al-Haddad, K. 1999. A review of active filters for power quality improvement. IEEE Trans. Ind. Electron., 46 (5), 960-971. [ Links ]
[11] Lam, C. S., Choi, W. H., Wong, M. C, and Han, Y D. 2012. Adaptive dc-link voltage-controlled hybrid active power filters for reactive power compensation. IEEE Trans. Power Electron., 27 (4), 17581772. [ Links ]
[12] Hamadi, A, Rahmani, S., and Al-Haddad, K. 2013. Digital control of hybrid power filter adopting non-linear control approach. IEEE Trans. Ind. Informat., 9 (4), 2092-2104. [ Links ]
[13] Bhattacharya, Α., Chakraborty, C, and Bhattacharya, S. 2012. Parallel connected shunt hybrid active power filters operating at different switching frequencies for improved performance. IEEE Trans. Ind. Electron., 59 (11), 4007-4019. [ Links ]
[14] Batarseh, I., and Wei, H. 2001. Power factor correction circuits. Florida, USA: Int. Journal of Inc., 517541. [ Links ]
[15] Emanuel, A. E., Orr, J. Α., Cyganski, D., and Gulachenski, Ε. M. (1993). A survey of harmonic voltages and currents at the customer's bus. IEEE Trans. Power Delivery, 8(1), 411-421. [ Links ]
[16] Peng, F. Z. 2001. Harmonic sources and filtering approaches. IEEE Ind. Appl. Mag., 7 (4), 18-25. [ Links ]
[17] Moran, L., Mahomar, J., and Dixon, J. 2002. Selecting the best point of connection for shunt active filters in multi-bus power distribution systems, in 37th IAS IEEE Proc. Industry Applications Annual Meeting, 1703-1709. [ Links ]
[18] Al-Naseem Ο. Α., and Adi, A. K. 2010. Impact of power factor correction on the electrical distribution network of Kuwait - a case study. Power and Elec. Engineering, 2(1), 173-176. [ Links ]
[19] Zaveri, N., and Chudasama, A. 2012. Control strategies for harmonic mitigation and power factor correction using shunt active filter under various source voltage conditions. Int. Journal of Electrical Power and Energy Systems, 42, 661-671. [ Links ]
[20] Subjak, J. S., and Mcquilkin, J. S. 1990. Harmonics-causes, effects, measurements, analysis: an update. IEEE Trans. Ind. Appl., 26 (6), 1034-1042. [ Links ]
[21] IEEE Inc., 1993. IEEE recommended practices and requirements for harmonic control in electrical power systems. (IEEE Std. 519-1992), ANSI/IEEE Inc. [ Links ]
[22] Batarseh, I. 2004. Power electronic circuits. Florida, USA: John Wiley & Sons Inc. [ Links ]
[23] El, M. A, Samir, H., Ezz, A, Dalai, E. A, Helmi, H., and Ibrahim, M. T. 2007. The impact of capacitor bank installation on the performance of distribution systems - a case study, in Proc. 19th International Conference on Electricity Distribution, 1-4. [ Links ]
[24] Hamadi, Α., Rahmani, S., and Al-Haddad, K. 2010. A hybrid passive filter configuration for VAR control and harmonic compensation. IEEE Trans. Ind. Electron., 57 (7),2419-2434. [ Links ]
[25] Flores, P., Dixon, J., Ortuzar, M., Carmi, R., Barri-uso, P., and Moran, L. 2009. Static VAR compensator and active power filter with power injection capability using 27-level inverters and photovoltaic cells. IEEE Trans. Ind. Electron., 56 (1), 130-138. [ Links ]
[26] Junyi, L., Zanchetta, P., Degano, M., and Lavopa, E. 2012. Control design and implementation for high performance shunt active filters in aircraft power grids. IEEE Trans. Ind. Electron., 59 (9), 3604-3613. [ Links ]
[27] Tang, Y., Loh, P.C., Wang, P., Choo, F. H., Gao, F. and Blaabjerg, F. 2012. Generalized design of high performance shunt active power filter with output LC filter. IEEE Trans. Ind. Electron., 59 (3), 14431452. [ Links ]
[28] Milanés-Montero, M. I., Romero-Cadaval, E., and Barrero-González, F. 2011. Hybrid multiconverter conditioner topology for high-power applications. IEEE Trans. Ind. Electron., 58 (6), 2283-2292. [ Links ]
[29] Akagi, H. 2005. Active harmonic filters. In Proc. IEEE, 93 (12), 2128-2141. [ Links ]
[30] Akagi, H. 1996. New trends in active filters for power conditioning. IEEE Trans. Ind. Applic, 32 (6), 1312-1322. [ Links ]
[31] Antunes, C. H., Pires, D. F., Barrico, C, Gomes, Α., and Martins, A. 2008. A multi-objective evolutionary algorithm for reactive power compensation in distribution networks. Applied Energy, 86 (8), 977984. [ Links ]
[32] Miller, T. J. E. 1982. Reactive power control in electric systems. USA: John Wiley & Sons Inc. [ Links ]
[33] Caramia, P., Carpinelli, G., Gagliardi, F., and Verde, P. 1994. Analysis and design of a combined system of shunt passive and active filters. Int. Trans. Electrical Energy Systems, 4 (2), 155-162. [ Links ]
[34] Capasso, Α., Lamedica, R., Manigrasso, R., Sani, G., Superti Furga, G., and Tironi, E. 1992. Reference power network for the harmonic propagation analysis. Int. Trans. Electrical Energy Systems, 2 (3), 167-178. [ Links ]
* Corresponding author: Tel: +971 6 5050971; email: rcbansal@ieee.org

