


Services on Demand
Article
 English (pdf)
 Article in xml format
 Article references
Indicators

Related links
-
 Cited by Google
 -
 Similars in Google
Share

 Permalink
Journal of Energy in Southern Africa
On-line version ISSN 2413-3051
Print version ISSN 1021-447X
J. energy South. Afr. vol.30 n.1 Cape Town 2019
http://dx.doi.org/10.17159/2413-3051/2019/v30i1a5267
ARTICLES
A ray tracer model for analysis of solar concentrating systems
Karidewa NyeingaI; Denis OkelloI *; Ole Jorgen NydalII
IDepartment of Physics, Makerere University, P.O. Box 7062, Kampala, Uganda
IIDepartment of Energy and Process Engineering, Norwegian University of Science and Technology, P.O. Box 7491, Trondheim, Norway
ABSTRACT
This study describes a 3D ray tracer model for analysis of a small-scale solar concentrating system where thermal heat is collected for cooking purposes. Emitted sun rays were traced from the source through all reflections until they intercepted with the receiver or were lost. The algorithm of the ray tracer and its implementation in MATLAB is clearly described. The ray tracer was programmed to contribute to the development of small-scale concentrating solar energy systems with integrated heat storage units. The ray tracer was demonstrated for selected cases where continuous reflecting surfaces and flat mirror-tiled surfaces were compared. Off-focus sensitivity analysis was shown and this could provide guidelines for the required solar tracking accuracy. The flux distribution on the absorber was analysed and found to be concentrated on a small area on the target for continuous reflecting surfaces and having high intensities. However, for reflectors with mirror tiles, an elongated image was formed centred on the focal point with low intensities. Small misalignment of the reflector in the order 0.2° had minimal impact on the interception ratio, but any further increase in the tracking errors caused a sudden drop in the interception ratio to zero. Results showed that there is close agreement in flux distribution and the tracking error impact on interception ratio, when compared with the literature. This model could be a useful tool when designing the reflection and absorption components of solar concentrators for complex systems with several components in a non-symmetric 3D arrangement.
Highlights
• An algorithm for a ray tracer was developed
• Enlarged images centred on the focal point were formed for mirror-tiled reflectors
• Small misalignment of the reflector had minimum impact on the interception ratio
• The tracer model could be used as a design tool
Keywords: reflectors; flat mirror tiles; smooth continuous surfaces; interception ratio; tracking errors
1. Introduction
The design of a solar thermal energy storage (TES) system for rural cooking application has been published [1, 2, 3, 4]. The TES consists of rock pebbles and local vegetable oils such as sunflower oil as the heat storage media. Sunflower oil is also used as the heat transfer fluid [5, 6]. The system was integrated with a cooking application to facilitate cooking after sunset [7]. Prototypes of the system are being tested. The system is designed to use a parabolic dish (PD) concentrator, but the application of these at low temperatures to provide heat for cooking is at a low stage of development. A PD reflector typically uses curved reflective panels made of glass or laminated films and usually requires a mechanism to track the motion of the sun. Solar tracking is the act of making a solar collector change its orientation with the movement of the sun in the sky [8]. The incident solar energy on the PD collector is reflected onto an absorber placed at the focal point; heat is produced at the desired temperature. The thermal limits of the receiver material must be considered [9, 10]. In the case of TES designed for storing heat for rural cooking applications, the aim is to achieve a temperature of about 200° C, which is suitable for cooking and also below the smoke point of sunflower oil [11].
Direct solar radiation incident normal to the aperture of a PD collector is ideally reflected on the focal point [10]. However, since the sun's disc has a finite angular size of 0.53°, light rays reaching the earth's surface are not parallel. Therefore, instead of the incident rays being reflected on the focal point, the reflected rays form an image of finite size centred about the focus [9, 10, 12]. The image formed or the flux distribution on the absorber can be analysed using a ray tracer. The tracer can also be used to analyse the absorber size, tracking errors, or any other parameter that is important in the design and construction of a solar concentrating system.
Ray tracing is a technique of following the path of an incident ray from the source to the final point [13]. It involves tracing the individual paths of many rays passing through the optical system to find out their distribution pattern on the surface of interest. For parabolic concentrators, ray tracing would start with the assembly of rays incident on the aperture and then determine their distribution and intensity at the receiver [14, 15]. The advantage of using ray tracing is its ability to handle any kind of geometry and still provide complete visibility [14]. An accurate beam distribution analysis aids in the design of reflectors and absorbers [15].
Yan et al. [16] reported on a flux distribution model of the focal plane in a dish concentrator system based on ray tracing. The model was designed to determine the influence of the mirror slope error, solar direct normal irradiance, and tracking error of elevation-azimuth tracking device on the flux distribution and interception ratio. It was found that the azimuth tracking error of the concentrator decreases with the increase of the concentrator elevation angle. Ruelas et al. [17] investigated the geometric aspects of the focal image for a Scheffler-type solar concentrator (STSC) using the ray tracing technique to establish parameters that allow the designation of the most suitable geometry for coupling the STSC to a Stirling engine. It was observed that the solar image geometry has variations within an elliptical area. Spencer and Murty [18] described a general procedure for treatment of the ray tracing method. Te-Tan [19] presented a study based on ray tracing technique to examine the errors induced in a light ray's path as it is reflected or refracted at a paraboloidal boundary surface. It was concluded that using the ray tracing method, the effect of the light path in each boundary surface within the optical system can be systematically examined. Leutz and Annen [20] presented a method using reverse ray tracing for stationary solar concentrators with the aim of estimating the performance of photovoltaic concentrators. The study found that using ray tracing new concentrators may be optimised for location and tilt. Chena et al. [21] investigated a solar concentrator combining primary paraboloidal and secondary hyperboloidal or ellipsoidal mirrors by using ray-tracing method to obtain higher concentration ratio. Madessa et al. [22] used the ray tracing technique to study the transportation of concentrated solar rays in a mirror guide channel. The effect of the channel length, cross-sectional area, internal reflectors and incident angles were analysed, the results showing that the efficiency of the channel was low. Nydal and Tesfay [23] used ray tracing to evaluate the SK14 solar concentrator to fry Ethiopian injera bread and reported that the reflected rays spread more evenly on the pan but also gave higher losses compared with an ideally smooth reflector. Foong et al. [24] experimentally investigated the charging of a phase change material using a double reflector system. A hole was cut in the primary reflector to allow reflected rays from the secondary reflector to reach the storage unit just behind the primary one. Van Rooyen et al. [25] employed ray tracing to retrieve the optical characteristics of a single Scheffler reflector. The optical efficiency of the Scheffler reflector is visualised in a 3D map for varying solar declination and solar hour angle.
Ray tracing computations have been useful when analysing double reflection systems, where a secondary reflector is placed at the focus of a primary reflector and an absorber at the focus of the secondary reflector. Secondary reflectors can be used to increase the concentration ratio even further, which is necessary if the initial concentrating system has a low concentration ratio limiting the temperatures achieved [9,10]. Nydal [26] used a ray tracer to study a double reflector parabolic concentrator for direct illumination of heat storage. The results showed that a 0.1 m horizontal absorber dish captures most of the incident rays if the secondary reflector was slightly elevated above the point of common focus of the primary and secondary reflectors. Groulx and Sponagle [27] conducted a ray tracing analysis of a two-stage solar concentrator of two parabolic mirrors. The focal length and the distance between the secondary mirror and the target were analysed, as was the impact of tracking errors on the concentration ratio. It was found that small misalignments of about 0.2° would cause the concentration efficiency to drop to zero.
A ray tracer becomes an important tool in the analysis of the tracking errors and the extent to which the system can tolerate the misalignment. Such systems become sensitive to the size and geometry of the absorbers. Madessa et al. [28] experimentally investigated the design and testing of a polar-aligned sun tracking system that could be integrated with a small-scale PD solar concentrator for low-temperature cooking. The system comprised two solar PV panels and a shading plate. The sun tracker worked with approximately 0.1° accuracy.
To study solar radiation concentrating systems requires a good model that can provide 3D simulations. The present study aimed to develop and demonstrate a ray tracer tool to analyse small-scale solar concentrating systems. A comprehensive description of the model and algorithms was provided, followed by a detailed and precise implementation of the algorithms. The work was done in 3D to provide better analysis of the system components and results. Various absorber types and sizes were investigated.
2. The ray tracer model
2.1 Solar concentrating system
Figure 1 shows a schematic diagram of a solar concentrating system. It consists of rays emitted by the sun, a parabolic dish as the reflector and a receiver placed at the focal point of the reflector. Sun rays hitting the aperture of the parabolic dish concentrator are reflected onto an absorber/receiver placed at focus of the reflector. The rays are assumed to be parallel to the parabola axis.
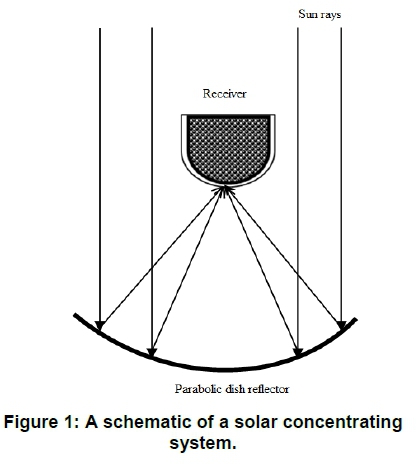
The main components in Figure 1 are:
• The sun: It is a vector of rays where a ray has a starting point and a direction. The size of the sun and its height above the horizon are defined. Each ray has a position, and direction dependent on the given sun angle. The sun is discretised into panels and each panel emits a ray from its centre.
• The reflector: A parabolic dish is used as the reflector. The surface of the parabola is made of either flat mirror tiles or smooth continuous mirrors. The reflectors are described by their focus, aperture size, offset height and offset centre. Mirror imperfections are ignored.
• The receivers: The different types or shapes of receivers considered are flat dish, box and spherical shapes.
• Box: A box (not shown in the figure) is placed around the concentrating system to trace lost rays.
2.2 Algorithm for a parabolic dish surface made of flat mirror tiles
The interest is to find the intersection of a line and a plane of a flat mirror tile. A plane having points Ρ and P3on it with normal N is described by Equation 1.

The line passing through the points P, P1, P2is expressed as Equation 2.

where u gives the length of the line between the points.
The intersection of these two is described by Equation 3.
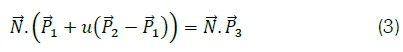
Therefore u is determined using Equation 4.
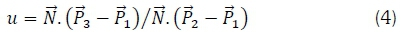
The computational sequence is then to find the normal vector to the plane.
2.3 Algorithm for a parabolic dish with smooth continuous surface
The aim is to find the point of intersection of a ray with a curved surface. Given a parabola with an aperture a, and a focal length/, on the z-axis; then the surface is expressed by Equation 5.

Let P(x,y, z) be the point of intersection on the parabolic surface with a ray having direction d, and starting from a point S(sx,sy,Sz), which is the sun. The length of the path of the ray to the point of intersection is u. Equation 6 defines P.

In component form, Equation 6 can be expressed as Equation 7.
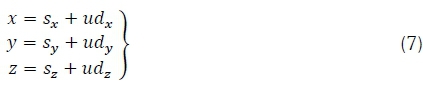
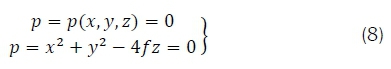
It follows that the shape of the surface in Equation 5 can be written as in Equation 8.
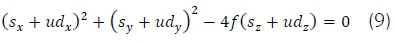
Inserting the components from Equation 7, the surface shape gives Equation 9 for u.
Re-arranging Equation 9 gives Equation 10.
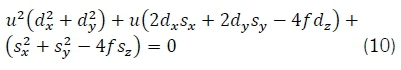
Equation 10 is a second order equation of the form given by Equation 11.

where
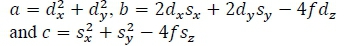
The solution is given by Equation 12.
Equation 12 is solved in MATLAB tracer. There may be real solutions and no solutions or complex numbers. Only positive numbers are extracted out of the solution for u. The rest are lost rays. The computation does not fail as long as the nonphysical results after the computations of u are removed.
The normal vector, η at the point of intersection is then used to compute the reflected ray, r as in Equation 13.
The normal vector is the normalised gradient of the surface and is expressed by Equation 14.

For a parabola, the gradient components at the point P(x,y,z) are given by Equation 15.
Therefore the procedure for each surface is as follows:
• given a sun point, S and a direction of the ray, d, the second order equation for u is solved;
• remove the nonphysical values of u, and only the positive values are retained;
• the intersection point is computed from Equation 6;
• compute the normal vector n, and the reflected vector using Equation 13;
• the point Ρ then becomes the new sun point and r, the new sun direction;
• after all the surfaces have been looped over, retain only the first reflection point of the ray in case of multiple reflections; and
• ray tracing is done until all rays hit the absorber or are lost into the surrounding.
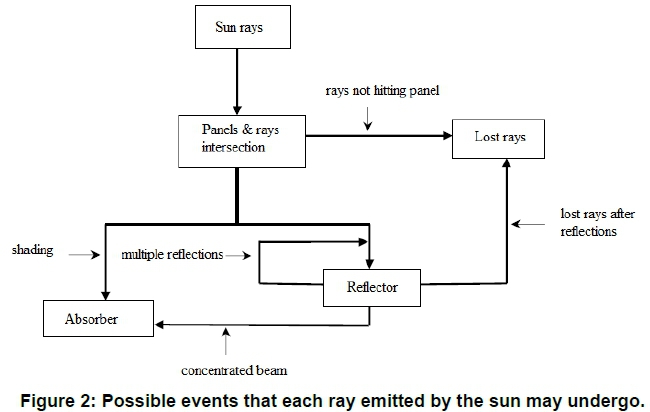
Figure 2 illustrates the possible events that each ray emitted by the sun may undergo. A ray that hits a reflector may be reflected onto a receiver/absorber or it may undergo numerous reflections. A ray from the sun may be considered as a lost ray if it did not intersect with a panel.
3. Results and discussions
Two types of parabolic dish reflectors were considered in the simulation: a PD reflector with smooth continuous surface, and a PD reflector with mirror tiles lined on the surface. Table 1 shows some of the input parameters used in the ray tracer model. The user can select the number of rays to be traced depending on the details required in the study.
3.1 Demonstration of the model-incident rays
Figure 3 illustrates rays emitted by the sun incident normal to the aperture of a PD collector and reflected onto the receiver placed at the focus of the PD concentrator. A spherical receiver was used. The reflector was made of a smooth continuous mirror surface. These basically demonstrated the model's capability to trace rays from the source past the reflector onto a receiver. In this case, the incident parallel rays (Figure 3a) were concentrated on the receiver placed at the focus (Figure 3b). Ideally for any perfect parabola, all rays incident parallel to the axis of a PD were reflected through the focal point. This provided an opportunity for solar energy concentration when using a PD reflector.
3.2 Flux distribution on the absorber
A parabolic reflector produces an image of the sun on the surface of the receiver. Figure 4 presents the flux distribution on a flat dish absorber because of reflections from a PD. The radiation is incident at an angle of 0° on the aperture of the PD reflector. Figure 4a shows the flux distribution on the receiver by a continuous reflecting surface. The image was concentrated on a small area on the target. High intensity was achieved. Figure 4b shows the flux distribution on the receiver by a mirror-tiled reflector. A rather large image centred on the focal point was formed on the target compared with the case in Figure 4a. Low intensity was obtained. Similar results were presented by Groulx and Sponagle [27], where the simulations produced elongated images centred on the focal point.
The shape of the images observed can be explained in theory by the fact that the sun's disc has a finite angular size of 0.53°, so that light rays reaching the earth's surface are not parallel [9, 10, 12]. Hence, instead of the incident rays being reflected on the focal point, the reflected rays form an image of finite size centred about the focus. Duffie and Beckman [10] explained that each element of a reflector forms an image on the receiver. The total image is the sum of all images from all the elements of the reflector. A continuous reflecting surface can be considered as a perfect reflector, as it forms an image which is perfectly aligned. On the other hand, a mirror-tiled reflector can be considered as an imperfeet reflector because of the contours. Imperfect reflectors would produce large images [10]. Non-uniform images are produced by each element of the reflector. The total image appears to spread over the target area. Duffie and Beckman [10] further pointed out that if there were any flaws in the mirror surface, additional spreading of the image occurred. The sizes of the tiles strongly influence the flux distribution on the absorber. Therefore, sizes of the tiles should be as small as possible to improve performance of the mirror-tiled collectors [9].
Figure 5 shows the flux distribution on a flat dish absorber for radiation incident on the aperture of a parabolic reflector at an angle of 5°. A continuous reflecting surface was used in Figure 5a while a reflector made of flat mirror tiles was used in Figure 5b. The image formed on the receiver was enlarged (Figure 5a); however, a further enlarged image is seen in Figure 5b. In both figures, the image was shifted from the centre. The intensity was reduced with the mirror-tiled reflector showing a greater reduction.
The widening of the image and its shift away from the centre is caused by the fact that as the incidence angle on the χ - ζ plane increases 0° to 5° or beyond, the apparent half-angle subtended by the sun on the χ - y plane also increases [10]. The intensity is reduced because of the reduced incident radiation and the enlarged image size. The implication of the spreading of the image is that, for a reflector oriented in east-west axis, it will have an enlarged flux distribution on the receiver in the morning and in the late afternoon.
Figure 6 further illustrates the impact of the increase in incidence angle on the enlargement of the image and its shift away from the centre. The images were shifted to the edges of the receiver and the intensities were very low compared with the case discussed in Figure 5.
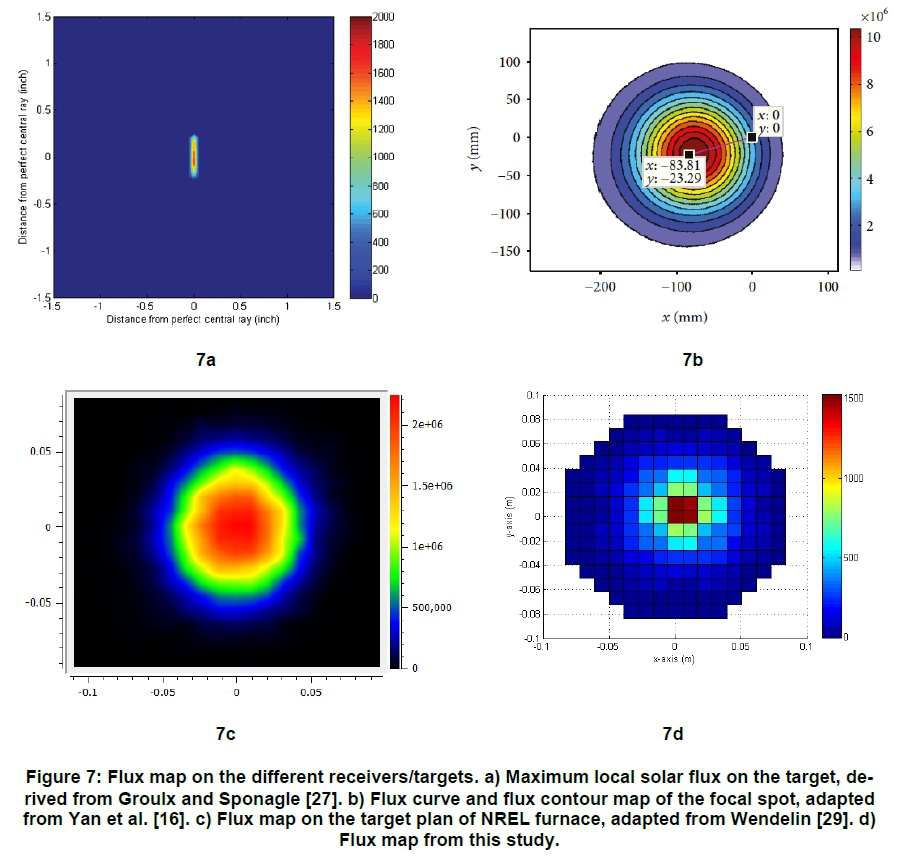
3.3. Validation of images formed on the absorber
Figure 7 presents images produced on the absorber by various authors compared with the results from this study. It is observed that for all the images formed (Figure 7a-d); elongated images centred on the focus were formed. There was an overall agreement that the flux distribution spread around the focal point, but there were observed discrepancies in the intensities and image shapes/sizes. This was attributed to the fact that each study used different number of rays and the tracer involved different geometries.
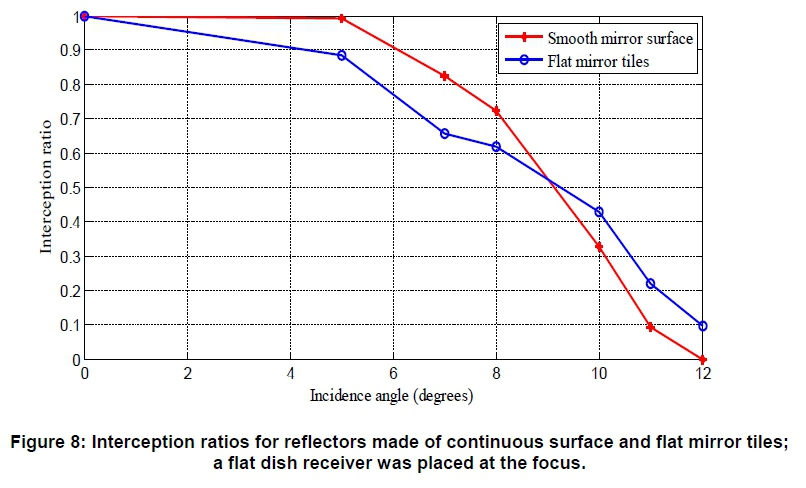
3.4 Interception ratio
The interception ratio is the ratio of the incident rays hitting the reflector and reflecting on the receiver. It is another way of expressing the performance of a solar concentrator and is a useful parameter for determining optical losses and gives insight into the design of tracking systems. Figure 8 shows the interception ratio at various incidence angles θ m degrees for two types of parabolic dish reflectors: a smooth continuous mirror surface and flat mirror tiles. A flat dish receiver of diameter 0.2 m was used. The interception ratio decreases with increasing incident angle
For a smooth reflecting surface, the interception ratio is 1° up to about 5°. For a reflecting surface with flat mirror tiles, the interception ratio is only unity at θ = 0°. The range of angles over which the interception ratio is 1 is referred to as the acceptance angle [10]. At angles beyond the acceptance angle, less radiation reaches the receiver. Duffie and Beckman [10] pointed out that for a perfect parabola, all incidence radiation within the acceptance angle is reflected on the absorber. However, for imperfect parabola, some of the radiations within the acceptance angle do not reach the absorber; and there could be reflections reaching the absorber even when incidence angle is beyond the acceptance angle.
The general trend of the interception ratio of this tracer simulation agrees with the analytical work of Duffie and Beckman [10], which reported an acceptance half-angle of about 12° for an ideal compound parabolic concentrator (CPC). The difference in value of the acceptance angles can be associated to difference in the concentrators used. Interception ratios are affected by the geometry of optical systems used [28]. Similar trends in the interception ration were reported by Radu and Mattox [30], where the optical efficiency was plotted as a function of incident angle for a CPC.
3.5 Tracking errors
Figure 9 shows the impact of tracking errors on the interception ratio for PD concentrators with smooth continuous surface and mirror-tiled surface. A flat dish absorber of diameter 0.2 m was used. For a very small misalignment, for example at approximately 0.2°, the impact of the tracking error on the interception ratio was minimal, but as the tracking error increased there was a sudden decrease in the interception ratio. At a tracking error of +0.5 the interception ratio suddenly fell below 10%. On the other hand, the reflector with mirror-tiled surface was observed to tolerate the tracking errors up to +0.1 although with very low percentage of rays reaching the absorber. A similar observation has been made by Nydal [26] and Madessa [28], where parabolic dish reflectors with mirror-tiled surfaces are less sensitive to tracking errors.
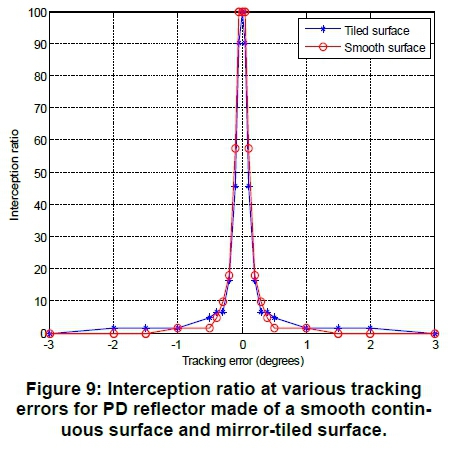
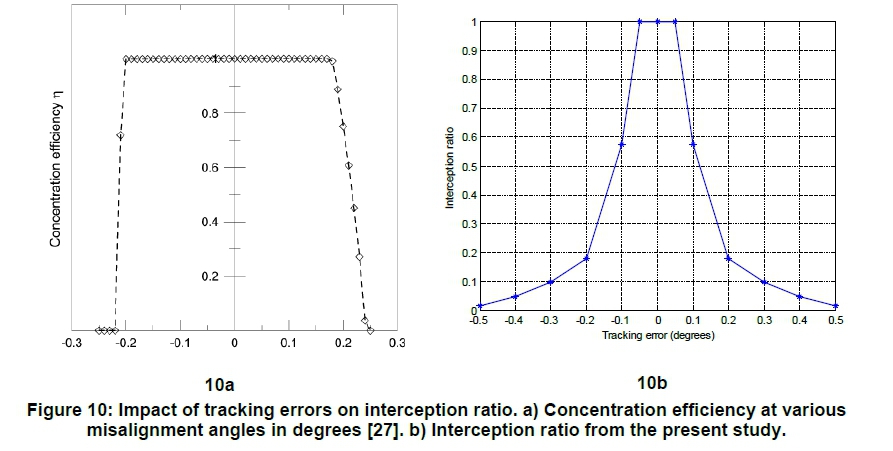
Figure 10 presents the impact of the tracking errors on the interception ratio. Results from this study were compared with those from Groulx and Spon-agle [27]. It was observed that for tracking error Θ, in the range of -0.2° < θ < +0.2°, Figure 10a shows 100% of the reflected rays were intercepted. Figure 10b shows that, for tracking errors in the range of -0.1° < θ < +0.1°, more than 70% of the reflected rays were intercepted. However, both studies show that, for θ > 0.2° and θ < 0.2°, the interception ratio suddenly dropped to about zero. The observed discrepancy in the two figures may be attributed to the fact that the Groulx and Sponagle study was based on using a secondary reflector in addition to the primary reflector and the differences in absorber sizes used.
4. Conclusions
A ray tracing tool to analyse a small-scale solar concentrating system was developed. A comprehensive description of the algorithm and its implementation in MATLAB was provided. The ray tracer was demonstrated for selected cases where a comparison between continuous reflecting surfaces and flat mirror-tiled surfaces was made. The flux distribution on the absorber was analysed and found to be concentrated on a small area on the target for continuous reflecting surfaces and having high intensities. However, for reflectors with mirror tiles, an enlarged image centred on the focal point was formed; with low intensity. A small misalignment of the reflector in the order 0.2° had minimum impact on the interception ratio, but any further increase in the tracking errors caused a sudden drop in the interception ratio to zero. The results obtained suggest it is possible to use the tracer model as a design tool in the construction of solar concentrating systems for low-temperature applications (200° C) suitable for rural cooking applications.
Acknowledgements
The authors are grateful to the Norwegian Agency for Development Cooperation for financial support through the Energy and Petroleum project, and acknowledge a network project between the Norwegian University of Science and Technology and four African universities on developing concentrating solar thermal energy storage systems for rural cooking applications.
References
1. Okello D., Foong C.W., Nydal O.J. and Banda E.J.K.B. 2014. An experimental investigation on the combined use of phase change material and rock particles for high temperature (=350° C) heat storage. Energy Conversion and Management 79: 1-8. https://doi.Org/10.1016/j.enconman.2013.ll.039 [ Links ]
2. Heetkamp van den R.R.J. 2002. The development of small solar concentrating systems with heat storage for rural food preparation. Physica Scripta T97 2002· 99-106. [ Links ]
3. Nyeinga K., Nydal O.J., Okello D. and Banda Ε.J.K.B. 2016. Dynamic model of a small scale concentrating solar cooker with rock bed heat storage. Journal of Energy in Southern Africa 27(1): 20-27. https://doi.org/10.17159/2413-3051/2016/v27ilal563 [ Links ]
4. Okello D., Nydal O.J., Nyeinga K. and Banda Ε.J.K.B. 2016. Experimental investigation on heat extraction from a rock bed heat storage system for high temperature applications. Journal of Energy in Southern Africa 27(2): 30-37. https://doi.org/10.17159/2413-3051/2016/v27i2al339 [ Links ]
5. Nyeinga K, Okello D. and Tabu B. 2017. Experimental investigation of thermal perfomance for selected oils for solar thermal energy storage and rural cooking application. Proceedings of SWC 20171 SHC 20171ISES Solar World Congress, Abu Dhabi, UAE, 29 October - 3 November 2017. https://doi.org/10.18086/swc.2017.14.05 [ Links ]
6. Lugolole R., Mawire Α., Lentswe K.A., Okello D. and Nyeinga Κ 2018. Performance comparison of three sunflower oil based sensible heat thermal energy storage systems during charging cycles. Journal for Sustainable Energy Technologies and Assessment 30: 37-51. https://doi.org/10.1016/j.seta.2018.09.002 [ Links ]
7. Mawire A. 2016. Performance of Sunflower oil as a sensible heat storage medium for domestic applications. Journal of Energy Storage 5: 1-9. https://doi.org/10.1016/j.est.2015.ll.002 [ Links ]
8. Kanyarusoke K.E., Gryzagoridis J. and Oliver G. 2015. Are solar tracking technologies feasible for domestic applications in rural tropical Africa? Journal of Energy in Southern Africa 26(1): 86-95. https://doi.org/10.17159/2413-3051/2015/v26ila2224 [ Links ]
9. Chikukwa A. and Lovseth J. 2009. Modeling of a novel volumetric absorber, suitable for compact solar concentrator with rock storage. Proceedings of ISES Solar World Congress, Johannesburg, 12-14 October 2009. [ Links ]
10. Dufie J.A. and Beckman W.A 2006. Solar Engineering of Thermal Processes, third edition. John Wiley and Sons, Inc., Hoboken, New Jersey. [ Links ]
11. Mawire Α., Abigail Phori A. and Taole S. 2014. Performance comparison of thermal energy storage oils for solar cookers during charging. Applied Thermal Engineering 73(1): 1323-1331. https://doi.org/10.1016/j.ap-plthermaleng.2014.08.032 [ Links ]
12. Mobarak A. and Rahim A. A. 1990. Determination of focal flux distribution of a parabolic dish solar concentrator applying real shape. 12th Annual International Solar Energy Conference, ASME, 79-86. [ Links ]
13. Seron F.J., Gutierrez D., Gutierrez G. and Cerezo E. 2005. Implementation of a method of curved ray tracing for inhomogeneous atmospheres. Computers & Graphics 29: 95-108. [ Links ]
14. Ratzel A.C. and Boughton B.D. 1987. A computer code for analysis of point-focus concentrators with flat targets. SAND86-1866, Sandia National Laboratories, Albuquerque, NM. [ Links ]
15. Nyeinga K, Banda E.J.K.B. and Nydal O.J. 2011. Ray tracer for analysis of solar concentrating systems. Proceedings of Solar World Congress 2011 Kassel, Germany, 28 August - 2 September 2011. https://doi.org/10.18086/swc.2011.25.22 [ Links ]
16. Yan J., Cheng Z. and Peng Y. 2018. Effect of tracking error of double-axis tracking device on the optical performance of solar dish concentrator. International Journal of Photoenergy 2018: 1-13. https://doi.org/10.1155/2018/9046127 [ Links ]
17. Ruelas J., Pando G., Lucero B. and Tzab J. 2014. Ray tracing study to determine the characteristics of the solar image in the receiver for a Scheffler-type solar concentrator coupled with a Stirling engine. Energy Procedia 57: 2858-2866. https://doi.Org/10.1016/j.egypro.2014.10.319 [ Links ]
18. Spencer G.H. and Murty M.V.R.K. 1982. General ray-tracing procedure. Journal of the Optical Society of America 52: 630-678. [ Links ]
19. Te-Tan L. 2009. A skew ray tracing approach for the error analysis of optical elements with paraboloi-dal boundary surfaces. Optik 120: 873-885. [ Links ]
20. Leutz R. and Annen H.P. 2007. Reverse ray-tracing model for the performance evaluation of stationary solar concentrators. Solar Energy 81: 761-767. https://doi.Org/10.1016/j.solener.2006.10.006 [ Links ]
21. Chena CF., Lina CH. and Jan H.T. 2010. A solar concentrator with two reflection mirrors designed by using a ray-tracing method. Optik 121: 1042-1051. https://doi.Org/10.1016/j.ijleo.2008.12.010 [ Links ]
22. Madessa H.B., Foong C. W. and Nydal O.J. 2011. Ray tracing for analysing transportation of concentrated sun rays through a channel. Proceedings of ASES National Solar Conference 2011, Raleigh, Norih Carolina, USA, 17-21 May 2011. [ Links ]
23. Nydal O.J and Tesfay A. 2015. Ray tracing for evaluation of the SK14 solar concentrator as a solar fryer. Conference Proceedings, ISES Solar World Congress, Daegu, Korea, 8-12 November 2015. [ Links ]
24. Foong C.W., Nydal O.J., and Lovesth J. 2011. Investigation of a small-scale double reflector solar concentrating system with high temperature heat storage. Applied Thermal Engineering 31: 18011815. https://doi.org/10.1016/j.ap-plthermaleng.2011.02.026 [ Links ]
25. Van Rooyen D.W., Heimsath Α., Nitz P., and Platzer W. 2011. An optical model of the fix-focus Scheffler reflector. Proceedings of Solar World Congress, Kas-sel-Germany, 28 August - 2 September 2011. https://doi.org/10.18086/swc.2011.28.30 [ Links ]
26. Nydal O.J. 2014. Ray tracing for optimisation of a double reflector system for direct illumination of a heat storage. Energy Procedia 57: 2211-2220. https://doi.Org/10.1016/j.egypro.2014.10.188 [ Links ]
27. Groulx D. and Sponagle B. 2010. Ray-tracing analysis of a two-stage solar concentrator. Transactions of the Canadian Society for Mechanical Engineering 34(2): 263-279. .https://doi.org/10.1139/tcsme-2010-0016 [ Links ]
28. Madessa H.B., Veslum T., Lovseth J. and Nydal O.J. 2011. Investigation of solar absorber for small-scale solar concentrating parabolic dish. Proceedings of Solar World Congress, Kassel-Germany, 28 August - 2 September 2011. https://doi.org/10.18086/swc.2011.19.23 [ Links ]
29. Wendelin T. 2003. SolTRACE: A new optical modelling tool for concentrating solar optics. Proceedings of the International Solar Energy Conference, 15-18 March 2003, Kohala Coast, Hawaii. New York, 253-260. [ Links ]
30. Radu A.A. and Mattox J. 1999. Ray tracing simulations for a modified compound parabolic concentrator to be considered for the Veritas project. Astroparticle Physics 11: 275-276. https://doi.org/10.1016/S0927-6505(99)00065-l [ Links ]
* Corresponding author: Tel: +256790550422; email: karidewa@yahoo.com

