Servicios Personalizados
Articulo
Indicadores
Links relacionados
-
 Citado por Google
 -
 Similares en Google
Compartir
Journal of Energy in Southern Africa
versión On-line ISSN 2413-3051
versión impresa ISSN 1021-447X
J. energy South. Afr. vol.29 no.4 Cape Town 2018
http://dx.doi.org/10.17159/2413-3051/2017/v29i4a5399
ARTICLE
Developing a small photovoltaic power supply system with adaptive technologies for rural Africa: Design, cost and efficiency analyses
Steve Mvili-Gampio; Lukas W. Snyman*
Department of Electrical Engineering, College for Science Engineering and Technology, University of South Africa, Florida, Johannesburg, P.O. Box 392, UNISA, 0003, South Africa
ABSTRACT
The objective of this stud]; was to design a small-scale photovoltaic system to support electricity supply to a rural village in the Republic of Congo. A simple impedance-matching system and an innovative panel-tilting system were implemented as adaptive technologies to increase the power output of the system and reduce its capital and running costs. The experimentally obtained results showed that the daily energy output of a four-panel, 400 W photovoltaic system could be increased by 15% through a series parallel impedance match configuration, and by 36% from 3.3 kWh per day to approximately 4.5 kWh per day through implementing an automated panel tilting system with always normal incidence of solar irradiation on the panels in an equatorial environment. Implementing these technologies accordingly reduced the cost of energy supplied by the same percentages, with an eventual electricity cost of about ZAR 3.60 per kWhr, as calculated over an operation time often years, and an initial capital outlay of ZAR 37 per watt. These costs are much lower than for installing power grid lines to the village, and the technology also ensures complete autonomy of power supply to the community. The study also identified the potential to generate many new business and job opportunities locally in this community, as well as in the rest of Africa.
1. Introduction
A substantial number of people in Africa live in rural areas. Many villages do not have access to electricity because it is not economically viable to connect them to the grid (Marneni et al, 2015). It is therefore a challenge to improve the living conditions of people there. One way to alleviate the cost of electrification of such villages is to use renewable energy resources, such as photovoltaic (PV) systems. The design of such systems poses challenges, and must be done carefully, to ensure that they satisfy the community needs. Both ethical and cost issues should also be acceptable to the communities.
Numerous case studies of PV applications in rural communities have been published, including by Setiawan et al (2013) and Eshita (2010). Praset-yaningsari et al (2013) reported on the optimisation of a solar-powered aeration system for a fish pond in Slenman. Nazar et al (2015) showed how the efficiency of solar panels can be improved following two different methods: the effects of surface preparation and the incidence of the angle of sunrays. Hadj Arab et al (2005) demonstrated the two sizing methods used for PV pumping systems; the first one was analytic and the second one graphic. Boitier et al (2005) demonstrated a methodology of sizing a PV system for a rural consumer. Marnemi et al (2015) showed how loss-reduction and voltage-profile improvement in a rural distribution feeder system could be achieved using solar PV generation and rural feeder optimisation with HOMER custom-designed and optimisation software (Homer, 2018).
Few case studies have however been conducted on the design and implementation of PV systems for larger rural communities in Africa that are completely off-grid, such as in the northern region Republic of Congo. Lack of electricity severely affectsthe living conditions of people in this village, as well as their economic development opportunities (private communication). The present study therefore focused on designing and selecting the most appropriate technologies for implementing a low-cost PV system for rural villages in Africa, specifically for the Ibouna village in Owando, Cuvette province, in the Republic of Congo, a community of about 300 people. Important system design aspects are presented; the cost of implementation values (cost of energy) are derived; and the total running cost of such a system over ten years is estimated. Particularly, the use of adaptive or add-on technologies was investigated in order to increase the efficiency and reduce the cost associated with such systems.
2. Design of a photovoltaic power supply system for Ibouna village
2.1 Determining energy requirements
The PV system designed for Ibouna village needed to be off-grid, since no nearby electricity grid supply was available. The energy needed to be supplied by a small solar power generation station situated at or near the village. The most important loads to be catered for were outdoor and indoor lighting, basic cooking, and cell phones and entertainment equipment. A fluorescent lighting system, light-emitting diode (LED) television, and microwave cooking technology were selected. This could lead to substantial cost savings, as these appliances use much less energy than older technology appliances (Eshita et al, 2010).
Table 1 provides some survey statistics with regard to the determined total energy requirement for the village.
2.2 Available solar irradiation
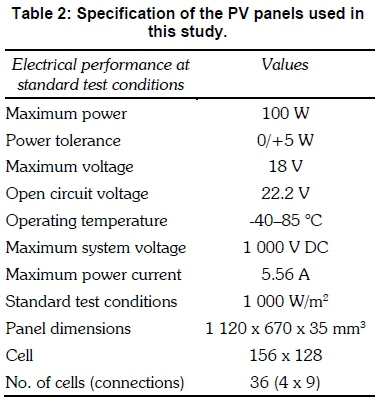
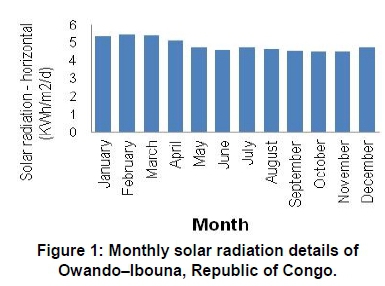
Ibouna is located at latitude 0.5° North and longitude 15.9° East (International Energy Agency, 2014). Table 2 presents the prevailing climatic conditions and Figure 1 shows the monthly solar radiation details tor Ibouna district (Google Maps, 2018).

2.3 Globular system design
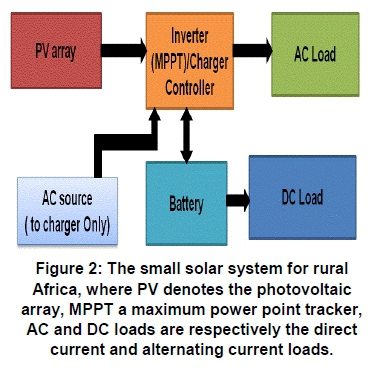
Figure 2 is a block diagram of a common PV power supply system ( Seai, 2013). The PV solar panel array needs to be connected to a multifunction inverter equipped with a maximum power point tracker (MPPT) charge controller to maximise and regulate the direct current (DC) power from the solar array for charging the battery bank. The DC supply was used to supply small DC loads such as cellular communication equipment and LED lighting, while the inverter supplied the alternating current (AC) power loads.
2.3.1 The battery bank
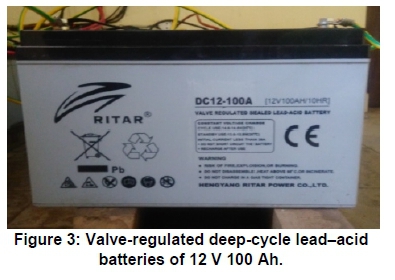
Different types of batteries suitable for PV installations could be used to store energy during the day. Nickel/cadmium batteries are usually used for PV plants. There are other types of high energy density battery, such as sodium-sulphur and zinc-bromine flow batteries. Among medium-term batteries, a nickel metal hydride battery has the best cycling performance (Photovoltaic efficiency, 2011). For a long-term option, zinc-manganese batteries are the best. Valve-regulated sealed lead-acid batteries are some of the best available options for solar PV use, and was chosen for implementation in this study (Figure 3). The lifetime of this type of battery is approximately ten years, after which it should be replaced.
The calculation of the energy per day capable of charging a battery was given by Boitier (2005) as in Equation 1.

where, Es is energy required per day capable of charging the battery, Etis the total energy required, Dautis the days of autonomy, and V is the voltage rating of the system.
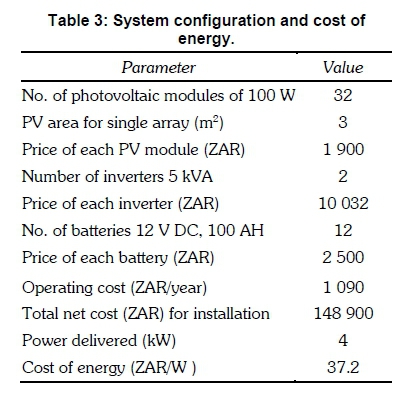
The total Es required to power the village was hence calculated as 18. 544 kWh/ day assuming one day of autonomy and one day for recharge. The battery configuration needed therefore should comprise twelve 12 V DC batteries of 100 Ah capacity each. The cost of each battery was ZAR 2 500, with operating and maintenance costs of about 1 % of the capital cost.
2.3.2 Choice of inverters
The calculation of the inverter capacity, Cinv, was based on Equation 2.

The peak power required was determined from Table 1 with needed appliances running simultaneously at peak day and peak night separately as 1128 W.
From Equation 3, the multifunction inverter with MPFT was 98% efficient, therefore, Cinv = 1128 x 1.02 = 1 151 W.
Eventually it was decided to use two 5 kVA inverters connected in parallel, in order to ensure adequate redundancy. The cost of one 5 kVA inverter being ZAR 10 030, and operating and maintenance cost of 1% of the capital cost. This could give the required power capacity of 4 kVA. The VP MKS 5K inverter equipped with an MPFT solar charge controller was used - a multi-function inverter with a liquid crystal display that combined the functions of an inverter and an MPPT solar charger.
2.3 Total energy to be supplied by the PV supply system
The total energy to be supplied by the PV system was calculated with Equations 3 and 4 (Boitier, 2005).

where, К is an efficiency coefficient, nbat is the battery efficiency, ninv is the inverter efficiency and nl is the supply lines efficiency and Es is the required energy supply .
As a departure point, the study assumed battery efficiencies of 80%, inverter efficiencies of 98% and supply wiring line efficiencies of 95%. These gave a К value of 0.75 and the total daily energy supply necessary was determined as 14. 83 kWh.
The solar panel array power capacity needed, at the average incident monthly radiation, was calculated with Equation 5 (Seai, 2013).

where, Epy is the required total solar panel power capacity, Es is the total daily energy needed to charge the batteries and Sr is the solar radiation per day at Ibouna village.
The system therefore required 32 panels of 100 Wp where Wp was the peak Watts power delivered under full irradiation, and according to the total power needed, as shown in Table 1.
2.4 Design of the PV panel array system
New PV technologies are continuously introduced because of the growing demand for solar power. The present study selected multi- or polycrystalline PV cells with an efficiency of about 12%. Table 2 summarises the characteristics of the solar panels used.
The cost of each solar panel was ZAR 1 900, with operating and maintenance costs of 1% of the capital cost. The capital outlay was therefore ZAR 19 per Watt.
3. Research methodology: Increasing the energy collection capacity through adaptive technologies
Two schemes of adaptive or added technology were investigated: load impedance matching, and mechanical variation of tilt angle for reducing reflected energy from the glass over-layers of the PV panels.
3.1 Investigation of impedance matching between solar panels and the load
The maximum power transfer to a load occurs when the internal resistance of the panel during full illumination conditions is equal to the DC resistance or equivalent DC impedance of the load. Several experiments were conducted to determine the internal resistance of solar cells as well as the equivalent DC impedance of the 300 W inverter, by sequentially connecting a rheostat as a load and measuring voltage changes following standard methodologies (Sze,1981).
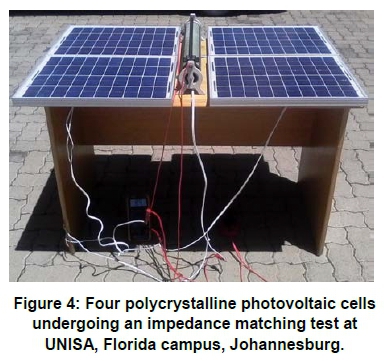
Figure 4 shows the test setup used in this study. The experimental equipment consisted of the following components: Rheostat in the range 0-220 Ω, 10 W; a multi-meter used as an ammeter (A) of type DT9205A; and a multi-meter used as voltmeter of type MS8205F. For the purpose of the experiment, four 20 W polycrystalline solar cells were connected, first in series, then in parallel, and then in various series-parallel configurations.
3.2 Investigation of the effect of reflectance on absorbed energy
The effect of reflectance on absorbed energy in the PV panels was investigated by implementing configurations such as the ones shown in Figure 5. Solar panel-collected energy is dependent on the intensity and nature of the light falling on the panel (Sze, 1981; Jiang et al, 2005). For this experiment, smaller systems were developed consisting of four 100 Watt panels each, each mounted on a pedestal structure which allowed the panels to be tilted with respect to the position of the sun, and such that the sun's irradiation was normal to the panel surfaces. The tilting was initially facilitated by hourly lock-tilting of the panels by the members of the community themselves as participation in the project. This is currently being replaced by fully electronically enabled control modules, which also run from the PV collected energy.
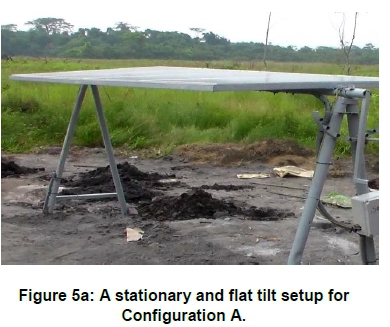
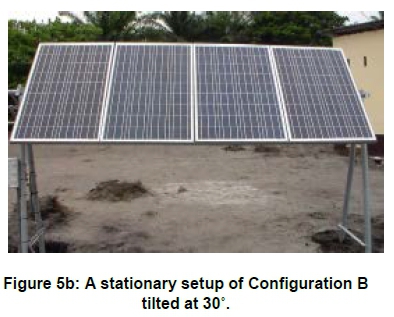
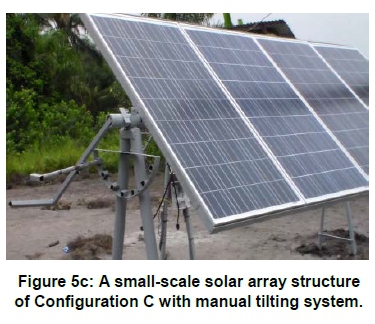
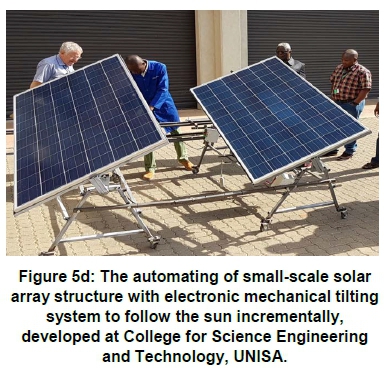
Figure 5 gives an overview of the test structure systems. Figure 5a shows a four-panel PV array in a flat position which was designated as Configuration or setup A. Figure 5b shows a second configuration with a PV array fixed at a stationary tilt angle of 30°, and which was designated as Configuration B. The third configuration, C, as in Figure 5c, featured a PV array that followed the sun through mechanical shifting of the angle every hour such that the sun was continuously at a perpendicular angle of incidence to the surface of the panel. An electronic mechanical system was later developed at the UNISA Florida campus in Johannesburg to allow tilting-automa-tion, and is shown in Figure 5d.
It was also important to take into consideration the impact of wind on the structure, as the effect of wind and dust on the collector needs to considered when designing a PV array system (Setiawan et al, 2013). The effect of increased wind force on the structure was mitigated by securing the mounting points centrally, strengthening the base platform for the panels, and allowing tilting of the panel at a central swivel axis. The beams were used to support a rectangular frame with an adaptive manual lever mechanism that adjusted the plane of PV panel during the day, as shown in Figure 5. The distance of about 1.5 m between frame and ground promoted the cooling of the PV panel.
4. Experimental results
4.1 Impedance matching
The experiments showed that the maximum power transfer occurred for all series, and all parallel ns at RL = 70 Ω, and RL = 4.38 Ω, respectively. The value of internal resistance of one cell of 20 W was determined as 17.5 Ω. A series-parallel configuration as shown in Figure 6 showed maximum power transfer at RL = 17.5 Ω. Figure 7 shows the various power deliveries observed for various wiring configuration setups (i.e., for all panels connected in series, all panels connected in parallel and all panels connected in a series-parallel configuration).
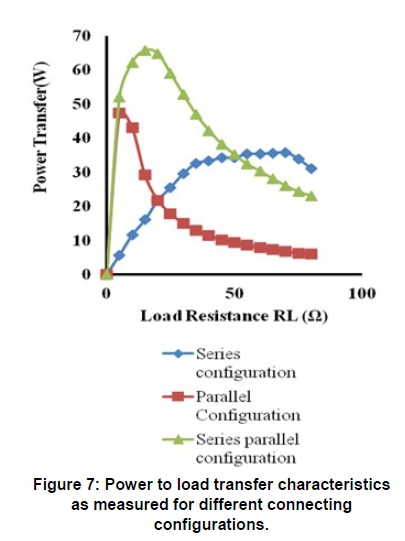
The measurements eventually showed that a simple series-parallel configuration of PV panels (Figure 6) transferred power to the load better than series-only or parallel-only configurations. This indicated that an increase of 30% power delivery could be achieved by using a simple improved series-parallel impedance matching technology with a commercially available multifunction power converter, as well as by satisfactorily matching the output impedance of the solar array with the input impedance of the inverter.
4.2 Effect of tilt in an equatorial environment
Figure 8 gives a plot of three curves based on numerical data as were collected from the three tilt configurations А, В and С in Figure 5. The results show that configurations A and С produced the highest power, approximately 400 W. The tilt angle of the panels in configuration С was continuously adjusted to ensure a normal incidence of sun rays to the panels. This configuration exhibited better performance and produced more power for a longer period, from 07:00 to 18:00. The effect of tilt in the equatorial environment seemed to be particularly impactful because the sun travels directly overhead from early morning to late afternoon; and there is a large change of incidence angle relative to a flat orientated panel relative to ground.
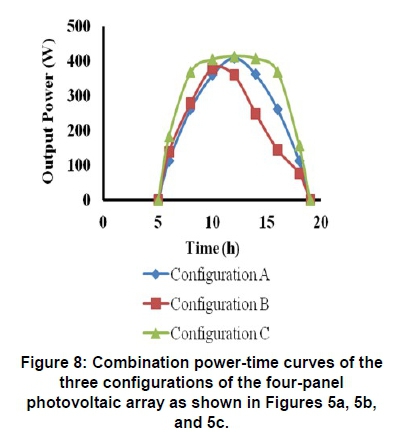
Solar radiation at full illumination during cloudy conditions at Ibouna as derived from Figure 1 was 894 W/m2. The measurements, as in Figure 8, showed that configurations А, В and С gave respectively 19.3, 38.3 and 50.3% of this value. This derivation clearly showed that tilting of the panels according to configuration В (fixed angular tilting at 30 degrees) and Configuration С (varying tilting with normal solar incidence on the panels) had a profound influence on the total energy collected. Figure 8 specifically indicates that the total energy collected (power-hour product) of configuration С was almost double that of Configuration A.
The total energy collection per day for each of the configuration could be calculated for each of the different configurations according to Equation 6 ( Sachin, 2012):

where, Pi (t) is the instantaneous output power as measured though the experiment at a specific time.
Using a graphical numerical integration technique considering the respective areas under the curves and Equation 6, total collected energy values were calculated, respectively for configurations А, В and С as 3.77kWh/ day, 3.27 kWh/day and 4.62 kWh/day. These results show that the total energy output of the tested four-panel 400 Watt system could be increased from 3.3 kWh/day for configuration В to approximately 4.5 kWh/day for configuration C. This correlated with a final increase of collected energy of 36.4%.
4.3 Cost of energy
The total cost of energy or cost of implementation for the system as designed in Section 2 is shown in Table 3, as calculated using the final total appliance configuration of the village as presented in Table 1 and the capital outlay for the various components of system as highlighted in Section 2.
An estimated cost of energy delivered of ZAR per kWh could be calculated as follows:
Initial capital outlay plus once-off replacement of batteries: ZAR 200 000
Total energy delivered to the community over a 10 year period:
(12 kWh x 350 x 10 x 1.3 ) = 54 600 kWhr
where a conservative 30% increase in energy delivery has been assumed: due to implementation of adaptive technologies :
Cost of energy per kWhr: ZAR 3.60 per kWh
Considering the costs required to connect the village with grid electricity over a distance of 20 km and considering the current cost of electricity of approximately ZAR 2 per kWh , excluding taxes and taking into account inflation and escalation costs of approximately 6% per year, these derived values are
5. Conclusions
1. A basic PV energy supply system was designed and implemented for a rural village in the Republic of Congo of approximately 300 people using common existing technology and engineering principles as are available in South Africa.
2. The implementation of adaptive technologies of applying basic optimum impedance matching technology and automated tilting of panels was researched. It was found that by using a special series parallel impedance matching configuration the power delivered could be increased by approximately 30 %. It was found that automated tilting of the panels to follow the sun in this equatorial environment could increase the power delivery by approximately 35 % . This eventually reflected in a reduction of the cost of energy and cost of electricity as supplied to the village over time.
3. The final cost of energy for implementing a standalone 4 kW system was ZAR 37 per kW while the estimated basic cost of electricity supplied to the village over a ten year period was 3.60 ZAR/kWhr.
4. It is suggested that the specific design, technical aspects and setup technologies developed in this study could be implemented successfully throughout Africa, with minor adjustments to allow for local conditions. The system also has the potential to unlock several manufacturing and business opportunities in the respective countries.
Acknowledgements
The Ministry of National Defence of the Republic of Congo and Colonel Francois Elengoua for their financial support and assistance. Thanks to Prof A. Yusuff and Mr J. De Koker from CSET Unisa for their initial inputs into the study.
References
Boitier, V. and Alonso, С 2005. Dimensionnement d'un Systeme photovoltaïque, CETSIS2005, Nancy, 2527 Available at: vincent.boi-tier.free.fr/LPCCSEE/BE/PV/Boitier_Alonso.pdf ; accessed July 2017. [ Links ]
Eshita, S. T. and Hossain, A. 2010. Design and simulation of a solar PV system. Thesis Department of Electrical and Electronics, BRAC University, Dhaka, Bangladesh : 1-16. Available at: dspace.bracu.ac.bd:8080/xmlui/... /thesis%20-%201%20report.pdf?...l, accessed July 2018. [ Links ]
Chandra Mouli, G. R., Bauer, P. and Zeman, M. 2016. System design for a solar-powered electric vehicle charging station for workplaces, Applied Energy 168:434-443. https://doi.Org/10.1016/j.apenergy.2016.01.110 [ Links ]
Hadj Arab, A, Gharbi, A and Benghanem, M., 2005. Dimensionnement des systèmes de pompage photovoltaique. Revue des Energies Renouuelables, 8:1926. [ Links ]
Homer Energy. 2017. Optimization engine for compiling and modelling solar energy supply systems . As available at https://www.homerenergy.com/products/grid/features.html, accessed July 2017. [ Links ]
International Energy Agency. 2014. Solar Photovoltaic Energy, Technology Roadmap, Renewable Energy Division. Available at: https://www.iea.org/publications/freepublications/...pv_roadmap.pdf, accessed July 2017 [ Links ]
IGrid Solar Pry Ltd. 2017. Solar thermal systems modules trainers text book, study materials in renewable energy for ITI students. Content Development, Editing, Design and Layout New Concept Information Systems Pty. Ltd. Available at: https://mnre.gov.in/.../UserFiles/.../Trainers%20Text-book%20-%20Solar, accessed July 2017. [ Links ]
Jiang, J, Huang, T, Hsiao, Y & Chen, C, 2005. Maximum power tracking for photovoltaic power systems. Tamkang Journal of Science and Engineering 8(2):147-153. [ Links ]
Marneni, A, Kulkarni, AD & Ananthapadmanabha, I., 2015. Loss reduction and voltage profile improvement in a rural distribution feeder using solar photovoltaic generation and rural distribution feeder optimization using HOMER. Procedia Technology, 21:507-513. https://doi.Org/10.1016/j.protcy.2015.10.036 [ Links ]
Moolman, S. 2017. 350% increase in a decade:How expensive is electricity in South Africa compared to other countries? http://www.poweroptimal.com/350-increase-decade-expensive-electricity-south-africa-compared-countries/, accessed July 2017. [ Links ]
Nazar, R., 2015. Improvement of efficiency of solar panel using different methods. International Journal of Electrical and Electronics Engineers, 7(1):12-17. [ Links ]
Synergy Energy Solutions.2017. PV Hybrid Systems and Solar Energy Solutions. 2017; available at www.synergyenergy.co.za, accessed July 2017. [ Links ]
International Finance Corporation . 2017. Project developer's guide to utility-scale solar photovoltaic power. O&M Workers at a Large-scale Solar PV. Available at: www.ifc.org/wps/wcm/connect/.../IFC+Solar+Re-port_;.accessed July 2017. [ Links ]
Prasetyaningsari, I, Setiawan, A & Setiawan, AA., 2013. Design optimization of solar powered aeration system for fish pond in Sleman Regency, Yogyakarta using HOMER software. Energy Procedia, 32:90-98. https://doi.Org/10.1016/j.egypro.2013.05.012 [ Links ]
Satyen, K. 2000. Recent developments in high-efficiency PV Cells, World Renewable Energy Congress VI, NREL/CP-590-28060. Available at: www.nrel.gov/docs/fy00osti/28060.pdf [ Links ]
Sachin, S. 2012. Numerical Integration (quadrature) pdf.department of scientific computer Available at: https://people.sc.fsu.edu/~sshanbhacyNumericalInte-gration.pdf. [ Links ]
Sustainable Energy Authority of Ireland (SEAI). 2017 Best practice guide photovoltaics: 1-70. Available at: https://www.seai.ie/resources/.../Best_Practice_Guide_for_PV.pdf, accessed July 2017. [ Links ]
Setiawan, A & Setiawan, AA., 2013. Community development in solar energy utilization to support fish farming in Sendangsari village. Energy Procedia, 32:39-46. https://doi.Org/10.1016/j.egypro.2013.05.006 [ Links ]
Sze, S.M., 1981. Physics of semiconductor devices, 2nd edition, New York, NY, USA: Wiley. [ Links ]
* Corresponding author: Tel: +27 11 471 2299 email: snymalw@unisa.ac.za


