


Services on Demand
Article
 English (pdf)
 Article in xml format
 Article references
Indicators

Related links
-
 Cited by Google
 -
 Similars in Google
Share

 Permalink
Journal of Energy in Southern Africa
On-line version ISSN 2413-3051
Print version ISSN 1021-447X
J. energy South. Afr. vol.29 n.4 Cape Town 2018
http://dx.doi.org/10.17159/2413-3051/2018/v29i4a5581
ARTICLE
System adequacy in the Southern African Power Pool: A case for capacity mechanisms
Jarrad G. WrightI, II, *; John van CollerII
ISchool of Electrical and Information Engineering, University of the Witwatersrand, Private Bag 3, Wits 2050, Johannesburg, South Africa
IIEnergy Centre, Council for Scientific and Industrial Research, PO Box 395, Pretoria 0001, South Africa
ABSTRACT
The requirement for increased investment in electrical energy infrastructure in the Southern African Power Pool (SAPP) region is contextualised. Background on the SAPP is provided for reference. A brief assessment of historical capacity adequacy in the SAPP region shows historically sustained levels of inadequacy as well as distinctive investment cycles primarily as a result of administratively determined generation capacity investments within each member country. The introduction of an appropriately designed capacity mechanism is proposed for SAPP to facilitate system adequacy and incentivise long-term capacity investment.
Highlights
• Increased investment in electrical energy infrastructure in the SAPP region is needed to enable increased electricity access and economic growth.
• The SAPP region has exhibited historical sustained system inadequacy and distinctive investment cycles.
• Competitive electricity trade is increasing and displacing bilateral contacts.
• An appropriately designed capacity mechanism for SAPP could facilitate system adequacy and incentivise long-term capacity investment.
Keywords: Interconnection; capacity investment; electricity access; competitive electricity trade, capacity mechanisms.
1. Introduction
This study aims to provide a collated summary of the existing Southern African Power Pool (SAPP) market architecture and its markets, as literature in this regard is sparse and fragmented. Thus, an easy-to-reference collation of SAPP market arrangements and statistics becomes useful. This aims to contribute to better understanding system adequacy in the SAPP to support the need for a proposed market mechanism that could incentivise capacity investment in the region. This has not yet been presented in the literature for the SAPP and provides for an understanding of the chronic historical adequacy issues faced by the region, and proposes a solution in the form of a market mechanism.
The Southern African Development Community (SADC) was established in 1992, covering an area of almost 10 million km2 [1] - over twice the land area of the European Union and equal to that of the United States of America and the People's Republic of China [1]. The population of the SADC region grew from approximately 180 million in 1995 to 300 million in 2015 [2]. This equates to an equivalent annual average population growth rate of 2.6% per year for 20 years. During this same period, world population grew at only half this rate (1.3% per year) [2]. Except for the larger Sub-Saharan African region (2.7% per year), no other region has shown such high levels of population growth, the closest being the Middle-East and North Africa (1.8% per year) and South Asia (1.6% per year) [2].
Demand for electricity in the SADC region grew from approximately 200 TWh in 1996 [3] to 295 TWh in 2016 [4], an average annual growth rate of 2.0% per year. The interconnected maximum demand within the mainland SADC region was 43.2 GW in 2016 (46.4 GW including countries not yet interconnected) [4]. The SADC region per capita electricity consumption ranged from 501000 kWh/capita in 1996 to 100-1750 kWh/capita in 2015 (excluding South Africa) [5], while annual per capita electricity consumption in Organisation for Economic Development and Cooperation countries ranged from approximately 74008000 kWh/capita between 1996 and 2015. In addition, the electricity access rate in the region has remained unchanged since 2000, when electricity access was at 13.9% moving to 13.4% in 2015 [6]. With clearly defined goals of electrification, high levels of economic growth and expected population growth in the SADC region in future, there is an expectation for considerably increased electrical energy demand. The exceptional historical and expected future increase in electrical energy demand has placed, and will continue to place, pressure on SADC nations for infrastructure development, specifically on electrical energy infrastructure, with expansion of networks and supply capacity to enable increased electricity access and meet industrial, manufacturing and agricultural demand.
Within the SADC community, it was realised early on that there would be clear benefits in regional co-operation and co-ordination (notably for electrical energy infrastructure) to enable economic growth and development [7,8]. The Southern African Power Pool (SAPP) was established in 1995, the oldest power pool in Africa. It aims to 'provide the least cost, environmentally friendly and affordable energy and increase accessibility to rural communities.' [9]. While the region had already been trading electricity since the 1950s (albeit only on a bilateral basis and at very low volumes), increased electricity trading between SAPP members was promoted and better co-ordinated, while pursuing increased electricity access (especially in rural areas) and attempting to ensure the region attracted electrical infrastructure investment [1013]. As will be shown, the SAPP has matured over time, with more members, higher trading volumes, and additional sub-markets for electricity trade [14].
A summary of the existing SAPP market architecture and markets is presented in Section 2. Section 3 assesses historical SAPP system adequacy based on available data. The historical performance of legacy and existing SAPP markets is reviewed in Section 4. Section 5 presents a proposed market mechanism to incentivise capacity investment in the SAPP considering historical lack of system adequacy in the region. Section 6 provides some conclusions derived from the findings with regard to historical system adequacy and competitive electricity market performance, while looking into the future and answering how system adequacy could be delivered in the SAPP region.
2. The Southern African Power Pool
2.1 Establishment
The member countries of the SAPP are shown in Figure 1. Historically, the mainland SADC region has not been highly electrically interconnected (as will be further described in Section 2.3). Thus, minimal electricity trade took place, with bilateral contracts between national power utilities, typically on a medium- to long-term basis to exchange electricity with predefined delivery requirements, volumes and prices. The first such contract was in the 1950s between Zaire (now known as the Democratic Republic of Congo (DRC) and Zambia. This was followed by the interconnection of Zimbabwe and Zambia at Lake Kariba in the 1960s [11]. The Songo-Apollo high voltage direct current link between Mozambique and South Africa followed in 1975. These developments resulted in two separate interconnected power systems (northern and southern).
Following the emergence of relative political stability, it became clear that integrated and co-operative trading of electricity from the rich hydro resources in the northern system (Congo and Zambezi rivers) and the rich thermal resources in the southern region (coalfields of Botswana and South Africa and onshore gas fields in Mozambique) would be beneficial for all countries [15]. As a result, in 1995, the northern and southern systems were electrically interconnected with the construction of the 400 kV line between Matimba (South Africa) and Insukamini (Zimbabwe) [16]. This created a platform for electricity trading between the two previously disconnected power systems. This trading, however, remained in the form of bilateral contracts updated and renegotiated on a periodic basis. With only this interconnector between the two systems, there was a distinct requirement for better electrical interconnection between southern African nations as well as an enabling platform that would further promote the trading of electricity. The platform that was established was the SAPP Some history, and the general governance framework under which it was established and currently operates, are outlined below.
2.2 Brief history
The Lusaka Declaration of 1980 (signed in Lusaka, Zambia) [7] initiated regional co-operation and development between southern African states. An update to this (signed in Windhoek, Namibia in 1992) [8] created what is now known as the SADC, which now has 15-member states, as listed in Table 1.

The SAPP was established in 1995 and is currently governed via a framework encapsulated in the following:
-
inter-governmental Memorandum of Understanding (MoU);
-
inter-utility MoU;
-
agreement between operating members;
-
SAPP operating guidelines; and
-
SAPP market guidelines.
The inter-governmental MoU that established the SAPP in 1995 at the SADC summit in South Africa included the majority of the national utilities of each country in the SADC [18]. The 2006 revised intergovernmental MoU for the SAPP extended the scope of members to include new entities, as outlined in Section 2.3. Using the inter-governmental MoU as an enabling framework, the second SAPP document, the inter-utility MoU governing the management of the SAPP was enacted in 1995 [19]. The latest version of this was signed in 2007, defining a new structure for the management and operations of the SAPP [12]. The third SAPP document, the agreement between operating members (OPs) of the SAPP was originally signed in 1995 [ 20]. This document outlined responsibilities of OPs (members whose transmission systems are interconnected) with respect to standards, operations and pricing in the SAPP. A revised version of was signed in 2008 [21] and has been under review since 2012; it is unclear whether a revised version is enacted as yet [22].
The fourth and fifth SAPP documents within this governance framework are respectively the SAPP operating and market guidelines. The former were first developed in 1996 [23] and defined the sharing of costs and responsibilities in the SAPP (including, inter alia, standards and guidelines for plant operations, maintenance and safety). This document was updated in 2014 [22]. Simultaneously, the newly established SAPP market guidelines were also developed and approved.
Another component critical to the ongoing operations of the SAPP was the establishment of the SAPP co-ordination centre in 2002 in Harare, Zimbabwe [18]. This implements, inter alia, the SAPP objectives (a regional wholesale market for electricity in the SADC), monitors SAPP transactions between members, carries out technical studies to assess the impact of future projects on the SAPP, coordinates training of members, and provides SAPP statistics for planning and development in the region [18].
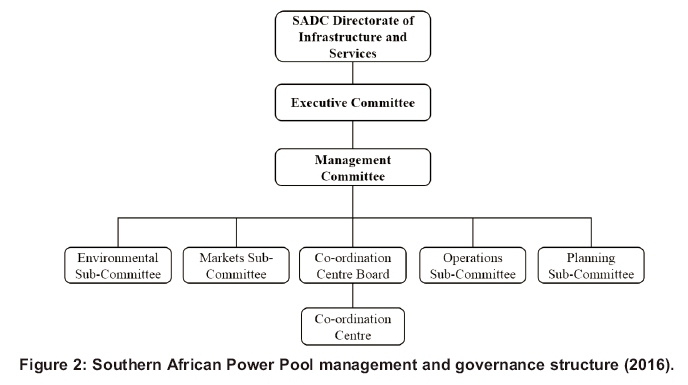
The governance structure of SAPP is depicted in Figure 2 and outlined below [9,12]:
-
The Directorate of Infrastructure and Services is made up of ministers and officials from the respective SADC countries and forms the direct link between the SADC and the SAPP. Major policy issues are referred from the Executive Committee to this Directorate.
-
The Executive Committee is made up of Chief Executive Officers of the SAPP members and a representative from the SADC Secretariat.
-
The Management Committee decides on recommendations of sub-committees and the SAPP Coordination Centre Board.
-
The Operating Sub-Committee establishes and updates methods and standards to measure technical performance and operating procedures.
-
The Planning Sub-Committee establishes and updates common planning and reliability standards, reviews integrated generation and transmission plans, evaluates software and other planning tools, determines transfer capability between systems amongst other aspects of power system operation.
-
The Environmental Sub-Committee develops environmental guidelines for the SAPP amongst other issues the environmental impact of power systems.
-
The Markets Sub-Committee is responsible for the design and continued development of the SAPP electricity market and determines criteria to authorise this trade.
-
The SAPP Coordination Centre reports to a Co-ordination Centre Board consisting of a maximum of two representatives of each national power utility.
2.3 Market participants
The classes of SAPP membership are as follows [18]:
-
independent transmission company;
-
independent power producer;
-
power utility;
-
service provider; and
-
observer.
As detailed in Table 2, as at 2016 there are 12 member states, and 16 members of the SAPP [24]: nine operating members (national power utilities), three non-operating members (national power utilities), two independent transmission companies and two independent power producers.
2.4 Size and interconnections
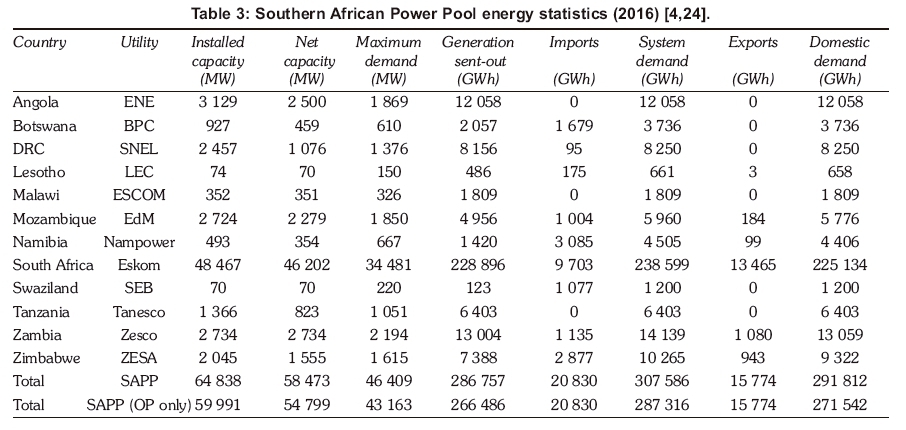
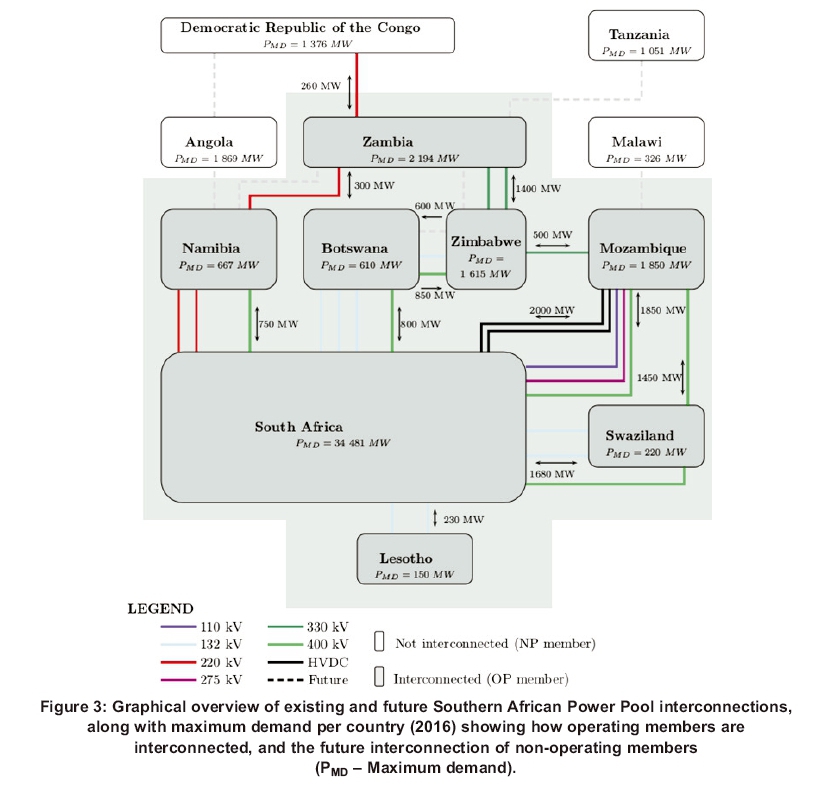
To provide some perspective on the electrical size of the SAPP, a summary of the SAPP demand and energy statistics for 2016 is given in Table 3. The graphical overview in Figure 3 complements Table 3 and shows peak demands, domestic energy demand, existing interconnectors (voltage levels and transfer capacities) as well as future (planned) interconnectors of each SAPP member country [24,25]. There is a relatively low level of interconnection between SAPP member countries and, although Angola, Malawi and Tanzania are currently non-operating members, there are plans to interconnect these countries. South Africa is by far the largest market in the SAPP with domestic demand making up about 90% of the total SAPP electrical energy demand and 85% of the interconnected SAPP demand in 2016. The three next biggest markets are the DRC and Zambia (each with 3.0% of total and 3.3% of interconnected demand) and Zimbabwe (2.2% of total and 2.4% of interconnected demand). Thus, South Africa is -30 times larger than the next-biggest market participant.
2.5 The changing SAPP market architecture
Following the establishment of the SAPP in 1995, a considerable amount of time passed before any formal sub-markets were formed within the SAPP market architecture (other than already existing and periodically updated bilateral contracts). Market participation by SAPP market participants is voluntary (a net-pool), meaning that the use of SAPP markets for trading of electricity is not compulsory as in a gross-pool. The short-term energy market (STEM) was established in 2001 as a collaborative market structure within the SAPP to allow for the trading of electricity on a shorter timeframe between SAPP members and for trading in addition to bilateral contracts [11,26]. From 2004 onwards, the SAPP wished to move from the collaborative STEM towards a market where buyers and sellers would compete in the trading of electricity. This was predominantly driven by principles in Nordic power markets and resulted in the establishment of the SAPP Day-Ahead Market (DAM) to replace the STEM in late 2009. The SAPP DAM is a firm energy market that trades (via a double-sided auction process) hourly energy contracts for the following day inclusive of existing bilateral contracts (cleared first), transmission capacity constraints and wheeling fees [11,27]. A post-DAM (PDAM) was established in 2013 to settle any outstanding imbalances that were still present following DAM trading. The PDAM was then discontinued when the intra-day market (IDM) went live in December 2015.
The SAPP market architecture was further updated recently when a number of new sub-markets were established. The sub-markets included in this new SAPP market architecture are enabled for market participants by the SAPP market trading platform [28]. An overview of each of the sub-markets in the SAPP market architecture is provided below (the sub-markets below are cleared in this order):
-
Bilateral contracts (legacy): To meet longterm energy supply-demand balance between market participants (can be firm and non-firm). This sub-market predates the establishment of the SAPP and has been the legacy sub-market within which most electricity trading in the SAPP has occurred. The magnitude of planned volumes and time of delivery are confirmed the day-ahead.
-
Forward physical market (monthly) (FPM-M), (April 2016): A sub-market where market participants can trade either an off-peak product for a single month (same volume and price in off-peak hours for the month) or a non-off-peak product for a single month (same volume and price in non-off-peak hours of the month). This is a sub-market that acts as a bridge between bilateral contracts and the FPM-W (outlined next). The magnitude of planned volumes and time of delivery are confirmed the day-ahead following bilateral contracts.
-
Forward physical market (weekly) (FPM-W), (April 2016): A sub-market where market participants can trade off-peak, standard and Ppeak products for a week (with the same volume and price for all off-peak, standard and peak hours of the week respectively). This is a sub-market that acts as a bridge between the FPM-M and the DAM.
-
Day-ahead market (DAM) (January 2010): An open and competitive sub-market traded on a day-ahead basis with gate-closure at 12h00 for next delivery day to meet short-term supply-demand balances between SAPP market participants. The market clearing price of the DAM is the main reference price for the competitive electricity market in the SAPP.
-
Intra-day market (IDM) (December 2015): A sub-market where market participants can continuously trade up to one hour prior to delivery. This essentially replaces the previous postDAM. The IDM matches market participants automatically on a first-come first-served basis if a seller's offer price is less than a buyer's bid price and a seller's volume is lower than (or equal to) a buyer's volume.
-
Interchange imbalance energy: Imbalance energy is settled based on the differences between schedules and actuals in a specific hour of operation. This is currently settled in the SAPP by averaging the system frequency over the dispatch period (one hour) and requiring a rate to be paid as a function of the frequency deviation from nominal (50 Hz). This is currently linked to the average and highest generation cost in the SAPP, but there are proposals to link this deviation to the DAM MCP.
3. The SAPP system adequacy
3.1 Power system reliability
As is well known, and described by Kundur [29] and Billinton [30], power system reliability is usually conceptualised as being made up of two components: (1) adequacy: The existence of sufficient facilities in the power system to satisfy demand; and (2) ecurity (resiliency): The ability of the power system to respond to and recover from unexpected disturbances within the power system or from external disturbances. These two concepts are interdependent and only separated for convenience. Adequacy typically relates to a steady state of the power system and whether it has sufficient capability to match supply and demand, whilst security (resiliency) is the dynamic process of transitioning from one state to another. The focus of this section is on the historical adequacy of the SAPP and does not address system security. In addition, adequacy is assessed from the perspective of hierarchical level (HL) I only (the collective ability of supply capacity to meet demand) and excludes HL II (supply and transmission networks) and HL III (generation, transmission and distribution networks) [30].
3.2 Historical review of system adequacy
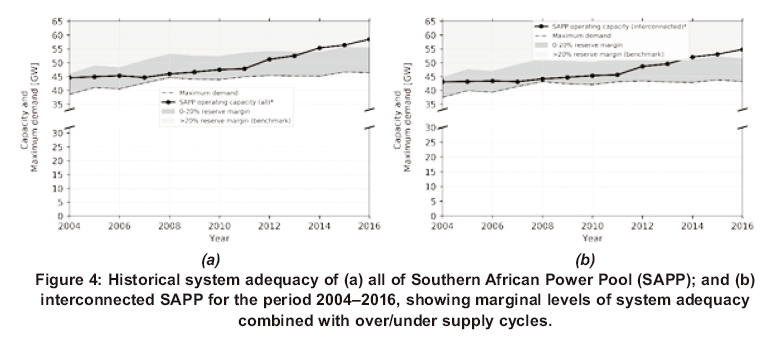
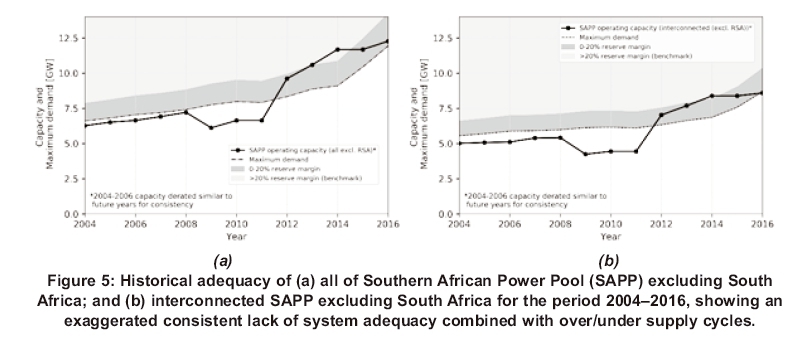
A brief assessment of the historical capacity adequacy in the SAPP is conducted in this section, predominantly based on the available data in [9,21,37-39,22,24,31-36]. The proxy used for the assessment of system adequacy is the annual operating supply capacity relative to annual maximum demand, with a benchmark of 20% reserve margin used as a typical demonstrative metric for system adequacy. Figure 4(a) summarises the adequacy of the overall SAPP region while Figure 4(b) summarises the adequacy of the interconnected SAPP. Due to the significant size of the South African power system, Figure 5(a) considers the overall SAPP adequacy without South Africa, while Figure 5(b) considers the interconnected SAPP also without South Africa. The SAPP maximum demand has been growing at an average rate of 1.6% per year (including South Africa), but at a much higher rate of 5.2% when removing South Africa. The interconnected SAPP has seen average peak demand growth of 1.2% per year (including South Africa) and, similarly, much higher at 3.9% per year when excluding South Africa. If focus is given on the interconnected SAPP in Figure 4(b) , there are almost no years within which an adequate regional power system has been realised (using the adequacy criteria benchmark of reserve margin >20%). When considering the interconnected SAPP without South Africa in Figure 5(b), not only has there been perpetual inadequacy but there have been extended periods (2004-2011) with insufficient supply capacity relative to maximum demand.
Another significant outcome from the data presented is a distinct investment cycle over the period considered, as can be seen in Figures 4 and 5 (particularly noticeable in Figure 5). Although more data would help to further assess whether this has been an ongoing phenomenon in the SAPP region (even prior to interconnection and the SAPP), the clear investment cycle is noticeable with the available data.
4. Performance of SAPP electricity markets
4.1 Bilateral contracts
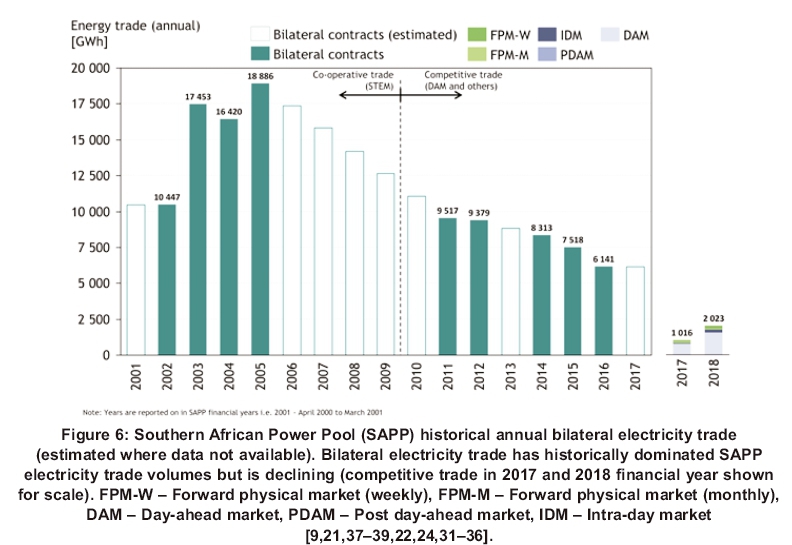
Although a full set of data is not available for SAPP bilateral trades, volumes traded in SAPP bilateral contracts are shown in Figure 6 based on available data. Although these do vary year-on-year depending on specific regional conditions, a maximum of approximately 19 000 GWh was traded bilaterally in 2005 (about 8.1% of the interconnected SAPP demand). From this, bilateral contract volumes seem to have been decreasing, more recently, down to about 6 100 GWh in 2015 (2.9% of the interconnected SAPP annual energy demand). This is important, considering the context of competitive electricity markets introduced into the SAPP It is also important to note that, as a result of SAPP market participants being predominantly vertically integrated utilities and network congestion in the SAPP, bilateral trading has historically resulted in a relatively small role for both co-operative and competitive electricity trade. This is evident in the data presented, where the relative electricity trade volumes for competitive electricity markets in the SAPP are shown in Figure 6. This has also been considered by other authors more recently [40].
4.2 Performance of SAPP competitive markets
The SAPP historical electricity trade (annual) excluding bilateral trading is shown in Figure 7, differentiating between co-operative and competitive electricity trade (transition from STEM to DAM). This is based on similar data used for extracting bilateral contract trade volumes supplemented by data in historical SAPP Monthly Market Performance Reports [14]. Bilateral contracts had been supplemented by the collaborative SAPP STEM between 2001 and 2007. The SAPP STEM traded with volumes of between 70-740 GWh annually when in operation.
Since the STEM was replaced by the competitive SAPP DAM, which effectively went live at the beginning of 2010, increasing year-on-year trade volumes have been realised in almost all years, as can be seen in Figure 7. The DAM is the main competitive electricity market in the SAPP. The DAM was supplemented by the IDM in December 2015, followed by the FPM-W and FPM-M, both of which went live in April 2016. Significant increases in trade volumes on the DAM have been realised since 2015 where trade shifted from 71 GWh in 2014 to 451 GWh in 2015 and 924 GWh in 2016. Although absolute competitive electricity trade volumes increased in 2017, a slight decrease in DAM trade volumes occurred in 2017 mostly as a result of increased competitive trade volumes in other markets established (IDM, FPM-W and FPM-M). The increase in competitive electricity trade is also demonstrated in Figure 8, where in the first half of the 2017/18 year alone there has already been almost as much competitive electricity trade as there was in the full 2016/17 year.
The increased interest by SAPP market participants' competitive electricity markets and the introduction of additional competitive electricity markets (as previously described) has driven the increase in competitive electricity trade volumes. For further insight into this in more recent times, the monthly trade volumes (along with average MCP) for the DAM, IDM, FPM-W and FPM-M are shown in Figure 8, where the upward trend in trade volumes is even more clearly indicated. The MCP on the DAM (and other markets) trended downwards in 2017 (likely because of the considerable increase in trade volumes). Despite this downward trend very recently, the SAPP DAM has become a market within which a stabilised reference price for electricity (the DAM MCP) has been established over more than five years and has started to prove itself as a market where increased trading and investment could be incentivised for existing and future market participants.
It is appreciated that although these increases in competitive electricity trade volumes mean there is a larger role being played by these markets in the SAPP, they are still relatively small in volume compared with SAPP bilateral trades and the overall SAPP interconnected electrical energy demand. Bilateral contracts still dominate trading (but to a lesser extent in recent years) while most domestic electrical energy demand is met by domestic supply in the SAPP countries. A concerted effort is necessary to ensure that these competitive markets play a larger role in electricity trade in the region using the established reference prices for electricity in future as this assists in providing transparent price signals to potential investors.
5. A market mechanism to incentivise capacity investment in the SAPP
5.1 Addressing chronic lack of system adequacy in the SAPP
At a system operations level, most countries within the SAPP (and associated SAPP market participants) aim to implement and ensure a pre-defined level of operating reserves. Trading on the SAPP is undertaken by market participants at this level utilising the previously described markets available as part of the SAPP market architecture. At a planning level, however, fragmented approaches to ensuring system adequacy (if any) are adopted and there is no consistent approach to this. In addition, administrative and bureaucratic processes often hamper and delay timely electrical infrastructure investments. More specifically, investments in supply capacity to ensure sustained system adequacy both within each country and regionally are not made timeously.
Although not in the public domain, some regional-level master-planning has been undertaken periodically in the past for the SAPP but has not resulted in a harmonised manner in which sustained system adequacy could be ensured in the future.
Notwithstanding the existing regulatory frameworks within particular countries, there is a distinct need to ensure that sufficient capacity is available when needed to ensure a pre-defined level of system adequacy in future. Investment cycles and persistent lack of system adequacy (as demonstrated) are not sustainable in the long-term and need to be sufficiently addressed.
At the other end of the electricity market design spectrum, in a completely deregulated market environment with energy traded as the only primary product (wholesale energy-only markets), scarcity pricing is meant to provide the necessary incentives for new market entry and also keeps existing capacity operational to provide capacity when needed [41-47]. Practically, this is often not the case for various reasons including demand-side inelasticity, demand uncertainty, non-zero lead times for capacity investments, market power and investor risk aversion as noted in [44,45,47,48]. It is debatable whether the inherent scarcity pricing that results under tight supply-demand conditions will incen-tivise new marginal generation capacity and/or keep existing capacity operational if only needed for a low number of hours in the year. This has driven active research into capacity mechanisms (CMs) and/or mechanisms regulatory frameworks that should bring sufficient capacity to market (via a capacity product).
5.2 Capacity mechanisms for the SAPP
The previously provided context is particularly pertinent in a regional market environment like the SAPP where individual countries have their own regulatory framework within which they operate, whilst also having the opportunity to trade electricity regionally. Based on the assessment in Section 3, it was shown that system adequacy has not been consistently maintained in the SAPP and, in Section 4, it was shown that the share of total energy traded versus total energy demand in the SAPP has been historically quite low (but is nevertheless growing). Thus, the introduction of an appropriately designed CM in the SAPP is proposed to facilitate system adequacy and incentivise capacity investment in the region in future. Leveraging on the historical experience gained on the SAPP market trading platforms, whilst embracing regional integration, could allow for a more transparent, effective (ability to avoid shortages) and efficient (low-cost) approach that ensures system adequacy across the region by various market participants in future.
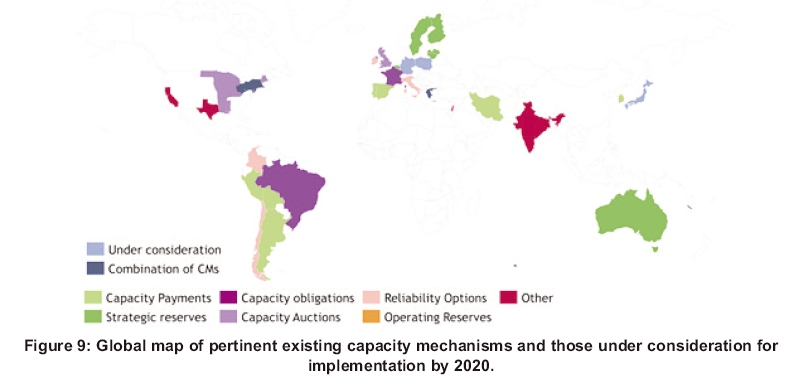
Globally, CMs have been in operation in several jurisdictions for several years, with more being considered in the near future. Some better-known implementations are shown graphically in Figure 9 (including those under consideration for implementation by 2020) [49-54]. The range of pertinent CM types are mentioned in Figure 9 but for brevity are not described here and will instead be provided in future publications.
At this stage, the most appropriate CM for the SAPP is probably a forward-looking capacity auction type of CM with a pre-defined capacity (volume) spatially disaggregated into each country (or SAPP node), supplied by all possible resources (supply- and demand-side options) with all feasible SAPP market participants participating. This would likely be managed by appropriately mandated institutions like a regional regulatory authority and regional transmission system operators on an annual basis. An implementing institution would likely be the SAPP co-ordination centre working in collaboration with regional operators. Incentivisation of new-entry into the market should be provided, considering the expected significant growth in demand as well as previous performance and market dominance of incumbents in the SAPP region. Crossborder participation principles for capacity provision should be prioritised to promote regional integration.
6. Conclusions
The introduction of an appropriately designed capacity mechanism (CM) is proposed for the Southern African Power Pool ( SAPP) region to facilitate system adequacy and incentivise long-term capacity investment. Resulting sustained adequacy should enable increased electricity access and economic growth in the region, as has been experienced globally. Administratively determined supply capacity decisions within each country have historically dominated the region but have been shown not to be capable of ensuring acceptable adequacy levels and also result in investment cycles. Similarly, in a competitive market environment, scarcity pricing should incentivise new market entry and keep existing capacity operational.
However, in globally deregulated competitive electricity markets as well as those established as part of the SAPP market design, this does not occur in reality for various reasons highlighted. At this stage, for the SAPP, a CM utilising a forward looking capacity auction for capacity spatially disaggregated, including all supply- and demand-side resources with all participating SAPP market participants, is proposed. This could be implemented by an appropriately mandated institution (likely a regional regulatory authority) with the involvement of key implementing institutions like the SAPP co-ordination centre and regional transmission system operators. It has been identified that literature on SAPP market performance and, more specifically, CMs in the region is scarce, and this paper contributes to the literature on these topics. However, future research aims to further formalise and assess CM options for the SAPP based on relevant design criteria that better characterises the proposed CM as well as other CMs for the region.
References
[1] World Bank Group. Land area (sq. km) [Internet]. [accessed 2018 Nov]. Available from: https://data.worldbank.org/indicator/AG.LND.TOT L.K2 [ Links ]
[2] World Bank Group. Population, total [Internet]. World Development Indicators. 2015 [accessed 2016 Nov]. Available from: http://data.world-bank.org/indicator/SFPPOFPTOTL [ Links ]
[3] Southern African Power Pool (SAPP). SAPP Annual Report [Internet]. 1996. Available from: http://www.sapp.co.zw/docs/SAPPreport(1995-1997).pdf [ Links ]
[4] Southern African power Pool (SAPP). Demand and Supply [Internet]. 2016 [accessed 2017 Oct]. Available from: http://www.sapp.co.zw/demand-and-supply [ Links ]
[5] World Bank Group. Electric power consumption (kWh per capita) [Internet]. World Development Indicators. 2014 [accessed 2017 Oct]. Available from: https://data.worldbank.org/indicator/EG.USE.ELEC.KH.PC [ Links ]
[6] International Energy Agency (IEA). Energy Access Outlook 2017: From poverty to prosperity [Internet]. 2017. Available from: https://www.iea.org/publications/freepublications/publication /WEO2017SpecialReport_EnergyAccess Outlook.pdf [ Links ]
[7] SADCC. Southern Africa: Toward economic liberation. A declaration by the governments of independent states of Southern Africa made at Lusaka on the 1st April 1980 [Internet]. Southern African Development Coordination Conference (SADCC); 1980. Available from: http://www.sadc.int/english/key-documents/declaration-and-treaty-of-sadc/ [ Links ]
[8] SADC. Towards a Southern African development community - A declaration made by the Heads of state or government of Southern Africa at Windhoek [Internet]. Windhoek: Southern African Development COmmunity (SADC); 1992. Available from: http://www.sadc.int/english/key-documents/declaration-and-treaty-of-sadc/ [ Links ]
[9] Southern African Power Pool. SAPP Annual Report [Internet]. 2015. Available from: http://www.sapp.co.zw/docs/SAPPAnnual Report-2015.pdf [ Links ]
[10] Musaba, L. SAPP Overview and Interconnections [Internet]. Harare, Zimbabwe; 2011. Available from: www.sapp.co.zw [ Links ]
[11] Musaba, L. The development of the SAPP competitive electricity market. In: IEEE Power Engineering Society Inaugural Conference and Exposition in Africa. Durban, South Africa; 2005. p. 11-5. [ Links ]
[12] Southern African Power Pool. Southern African Power Pool Inter-Utility Memorandum of Understanding [Internet]. 2005. Available from: http://www.sadc.int/documents-publications/show/1024 [ Links ]
[13] SADC Energy Ministers. Southern African Power Pool Inter-Governmental Memorandum of Understanding. 2006. [ Links ]
[14] Southern African Power Pool (SAPP). SAPP Monthly Market Performance Report [Internet]. Available from: http://www.sapp.co.zw/mreports.html [ Links ]
[15] Graeber, B Spalding-Fecher, R Gonah, B. Optimising trans-national power generation and transmission investments: A Southern African example. Energy Policy. 2005; 33(18):2337-49. [ Links ]
[16] Coetzee, MC. The operational experience of the first 400 kV feeder in the Southern African power pool. In: 1996 IEEE AFRICON 4th Africon conference in Africa. Stellenbosch, South Africa; 1996. p. 48-51. [ Links ]
[17] Southern African Development Community (SADC). MEMBER STATES [Internet]. 2012 [accessed 2011 Jun]. Available from: http://www.sadc.int/member-states/ [ Links ]
[18] Hammons, TJ. Electricity infrastructures in the global marketplace. Intech; 2011. [ Links ]
[19] Southern African Power Pool (SAPP). Southern African Power Pool Inter-Utility Memorandum of Understanding. 1995. [ Links ]
[20] Southern African Power Pool. Southern African Power Pool Agreement between Operating Members [Internet]. 1995. Available from: www.sapp.co.zw [ Links ]
[21] Southern African Power Pool. SAPP Annual Report [Internet]. 2009. Available from: www.sapp.co.zw [ Links ]
[22] Southern African Power Pool. SAPP Annual Report [Internet]. 2012. Available from: www.sapp.co.zw [ Links ]
[23] Southern African Power Pool. Southern African Power Pool Operating Guidelines. 1996. [ Links ]
[24] Southern African Power Pool (SAPP). SAPP Annual Report. 2016. [ Links ]
2003[25] Southern African Power Pool (SAPP). SAPP Transfer Limits (2017) [Internet]. 2017 [accessed Jul]. Available from: http://www.sapp.co.zw/transfer-limits [ Links ]
[26] Musaba, L Naidoo, P. Towards developing a competitive market for regional electricity cross border trading: the case of the Southern African power pool. In: IEEE Power Engineering Society General Meeting. Denver, USA; 2004. [ Links ]
[27] Southern African Power Pool. Southern African Power Pool (SAPP) Day Ahead Market (DAM) Book of Rules [Internet]. 2009. Available from: www.sapp.co.zw [ Links ]
[28] Southern African Power Pool (SAPP). SAPP Market Trading [Internet]. 2017 [accessed 2017 Sep]. Available from: http://sappmarket.com/ [ Links ]
[29] Kundur, P Power System Stability and Control, McGraw-Hill; 1994. [ Links ]
[30] Billinton, R Allen, RA. Reliability Evaluation of Power Systems. New York: Plenum Press; 1996. [ Links ]
[31] Southern African Power Pool (SAPP). SAPP Annual Report [Internet]. 2004. Available from: www.sapp.co.zw [ Links ]
[32] Southern African Power Pool (SAPP). SAPP Annual Report [Internet]. 2005. Available from: www.sapp.co.zw [ Links ]
[33] Southern African Power Pool. SAPP Annual Report [Internet]. 2006. Available from: www.sapp.co.zw [ Links ]
[34] Southern African Power Pool. SAPP Annual Report [Internet]. 2007. Available from: www.sapp.co.zw [ Links ]
[35] Southern African Power Pool. SAPP Annual Report [Internet]. 2008. Available from: www.sapp.co.zw [ Links ]
[36] Southern African Power Pool. SAPP Annual Report [Internet]. 2010. Available from: www.sapp.co.zw [ Links ]
[37] Southern African Power Pool. SAPP Annual Report [Internet]. 2011. Available from: www.sapp.co.zw [ Links ]
[38] Southern African Power Pool. SAPP Annual Report. 2013. [ Links ]
[39] Southern African Power Pool. SAPP Annual Report. 2014. [ Links ]
[40] Rose, A Stoner, R Pérez-Arriaga, I. Integrating market and bilateral power trading in the South African Power Pool [Internet]. 2016 [accessed 2017 Jun]. Available from: https://www.wider.unu.edu/sites/default/files/wp2016-132_0.pdf [ Links ]
[41] Sioshansi, FP Pfaffenberger, W. Electricity Market Reform: An International Perspective. Elsevier; 2006. [ Links ]
[42] Caramanis, MC Bohn, RE Schweppe, FC. Optimal spot pricing: Practice and theory. IEEE Trans Power Appar Syst. 1982; 101:3234-45. [ Links ]
[43] Schweppe, FC Caramanis, MC Tabors, RD Bohn, RE. Spot Pricing of Electricity. Springer US, Kluwer Academic Publishers; 1988. 356 p. [ Links ]
[44] Stoft, S. Power System Economics : Designing Markets for Electricity. Wiley-IEEE Press; 2002. [ Links ]
[45] Kirschen, D Strbac, G. Fundamentals of Power System Economics. John Wiley and Sons Inc.; 2004. [ Links ]
[46] Milstein, I Tishler, A. The inevitability of capacity underinvestment in competitive electricity markets. Energy Econ. 2012; 34(1):62-77. [ Links ]
[47] Biggar, DR Hesamzadeh, MR. The Economics of Electricity Markets. Wiley - IEEE; 2014. [ Links ]
[48] Doorman, G Barquin, J Barroso, L Batlle, C Cruickshank, A Dervieux, C et al. Capacity mechanisms: needs, solutions and state of affairs. 2016. [ Links ]
[49] Doorman, G. Peaking capacity in restructured power systems [Internet]. Norwegian University of Science and Technology; 2000. Available from: http://www.diva-portal.org/smash/get/diva2:125349/FULLTEXT01.pdf [ Links ]
[50] De Vries, LJ. Securing the public interest in electricity generation markets: The myths of the invisible hand and the copper plate. Delft University of Technology; 2004. [ Links ]
[51] The Agency for the Cooperation of Energy Regulators (ACER). Capacity remuneration mechanisms and the internal market for electricity [Internet]. 2013. Available from: www.acer.europa.eu/...of.../crmsandtheiemreport130730.pdf [ Links ]
[52] Iychettira, KK. Orchestrating investment in an evolving power sector: An analysis of capacity markets [Internet]. Delft University of technology; 2013. Available from: http://repository.tudelft.nl/view/ir/uuid:b96aaa13-96fc-488b-be96-24c627c12be6/ [ Links ]
[53] Caldecott, B McDaniels, J. Stranded generation assets : Implications for European capacity mechanisms , energy markets and climate policy. 2014. [ Links ]
[54] Hancher, L Houteclocque, A de. Capacity mechanisms in EU energy markets: Law, policy, and economics. 1st ed. Oxford University Press; 2015. [ Links ]
* Corresponding author: Tel. (+27) 12 842 7269; email: jwright@csir.co.za

